
Comparable Sales Near 810 Socorro Song Lane, Henderson, NV 89052
1st Realty · Comparable sales report · 1st.estate · October 20, 2026
Read the Henderson area guide →
810 Socorro Song Lane, Henderson, NV 89052
Status: Sold
$2,300 Sold Price
$1
$ / Sq Ft
2,218
Living Area
6,970 sqft
Lot Size
4
Beds
3
Baths
2005
Year Built
Search Parameters
Property Type
Status
Radius
Sold Within
Beds
Baths
Living Area (Sq Ft)
Lot Size (Sq Ft)
This comp search reflects your current search parameters — adjust the filters above as needed for a more accurate estimate.
Estimated Value
—
Average $/Sqft
—
Check one or more comps below to calculate an estimate.
Nearest 10 of 16 comparable sales and listings within 1 mile of this home. Use the filters above and press Search to refine.
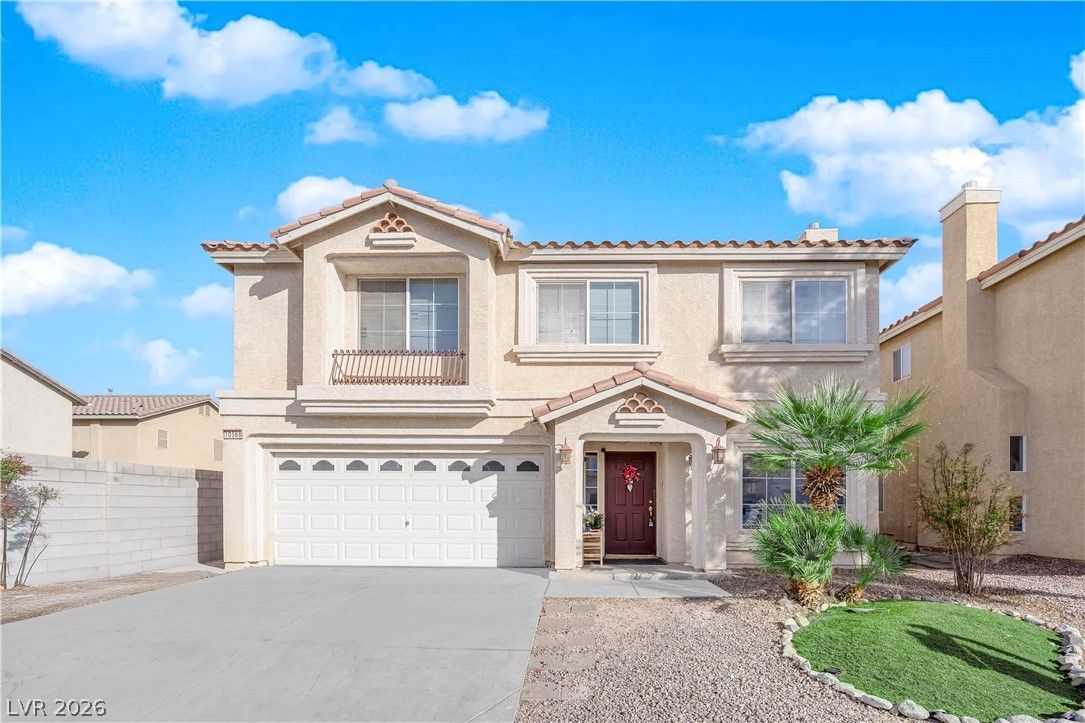
10568 Salmon Leap StreetActive
$599,0004 bd3 ba2,730 sqft$219/sqft0.24 mi85 days
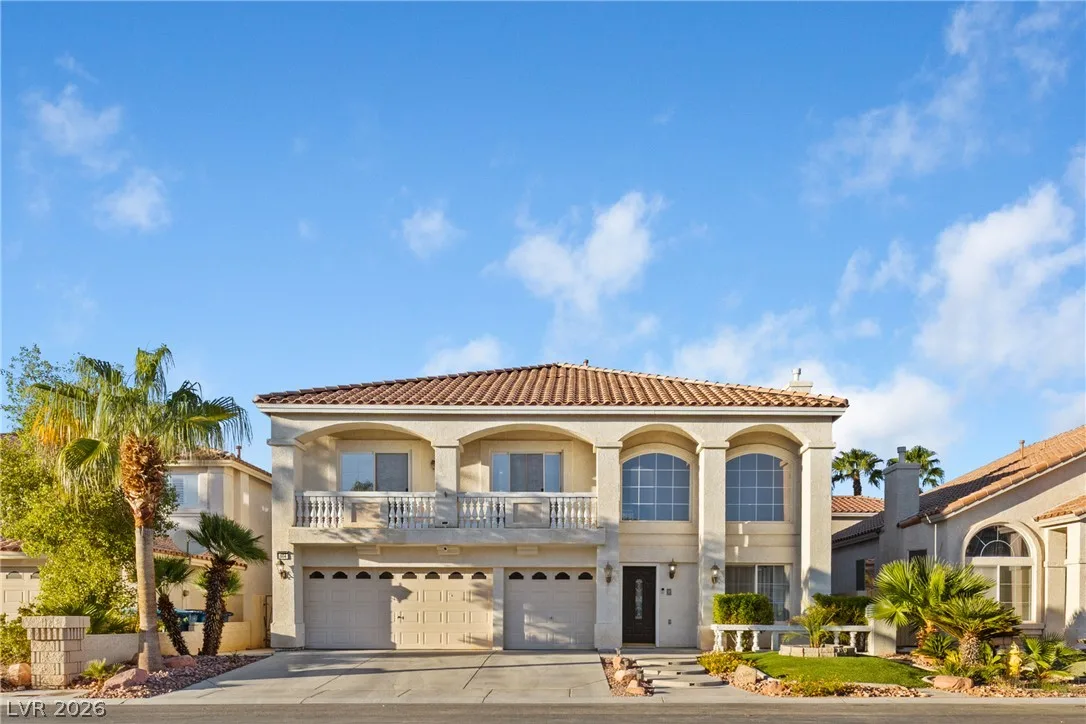
664 Pacific Star CourtUnder Contract
$575,0005 bd3 ba2,766 sqft$208/sqft0.24 mi4 days
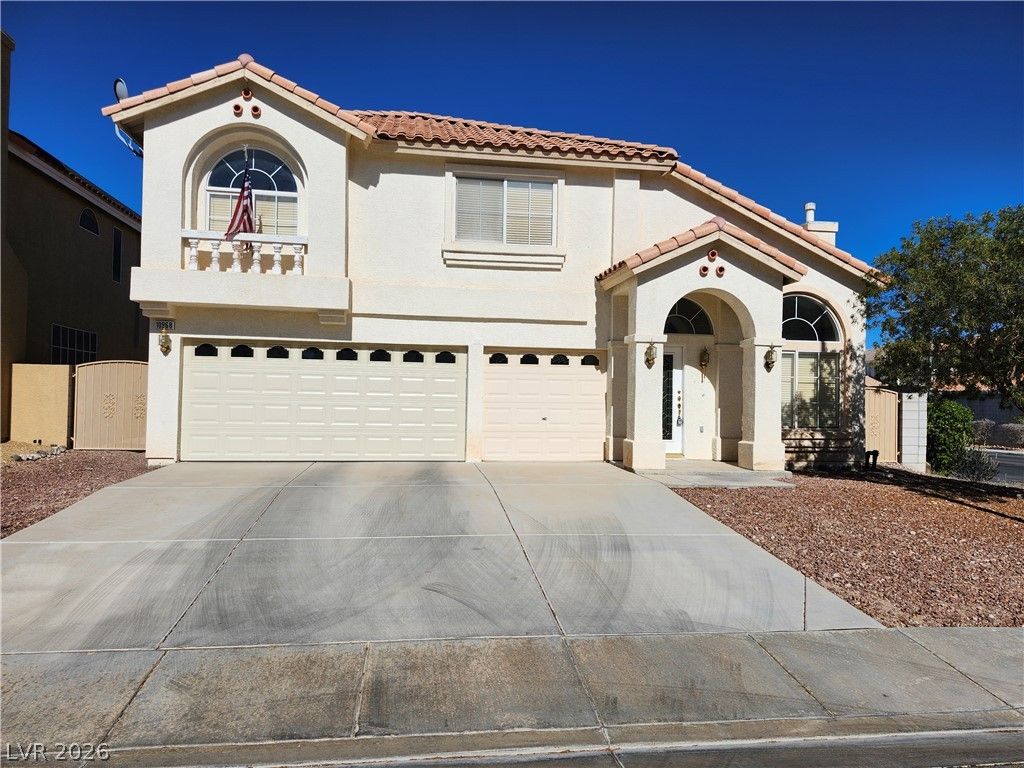
$383,5004 bd3 ba2,255 sqft$170/sqft0.34 mi60 daysSold 2026-09-11
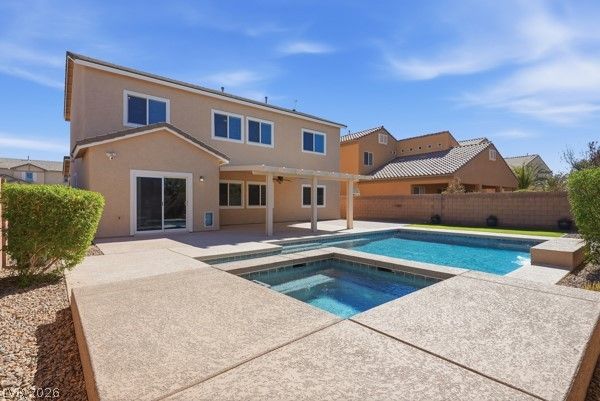
$636,0005 bd4 ba2,664 sqft$239/sqft0.35 mi5 daysSold 2026-09-25
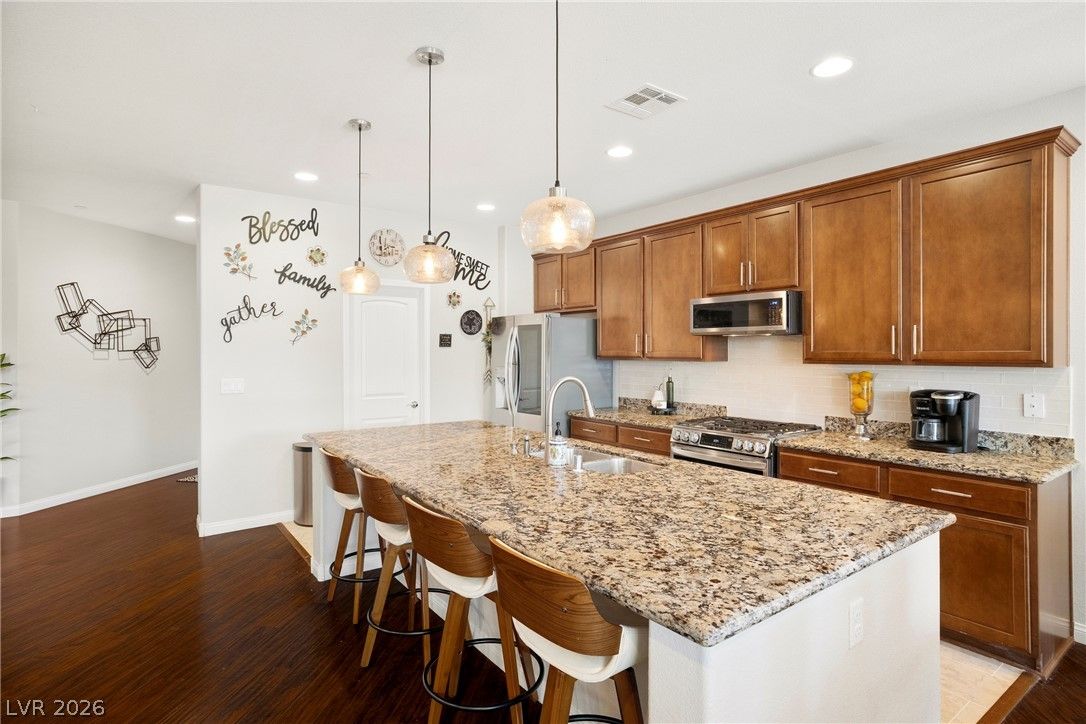
$615,0004 bd3 ba2,534 sqft$243/sqft0.49 mi64 daysSold 2026-09-16
$477,7504 bd3 ba2,169 sqft$220/sqft0.81 mi332 daysSold 2026-05-19
$435,0004 bd3 ba2,169 sqft$201/sqft0.81 mi6 daysSold 2026-07-09
$424,0003 bd3 ba1,692 sqft$251/sqft0.83 mi34 daysSold 2026-07-23

$525,0004 bd3 ba2,523 sqft$208/sqft0.89 mi284 days
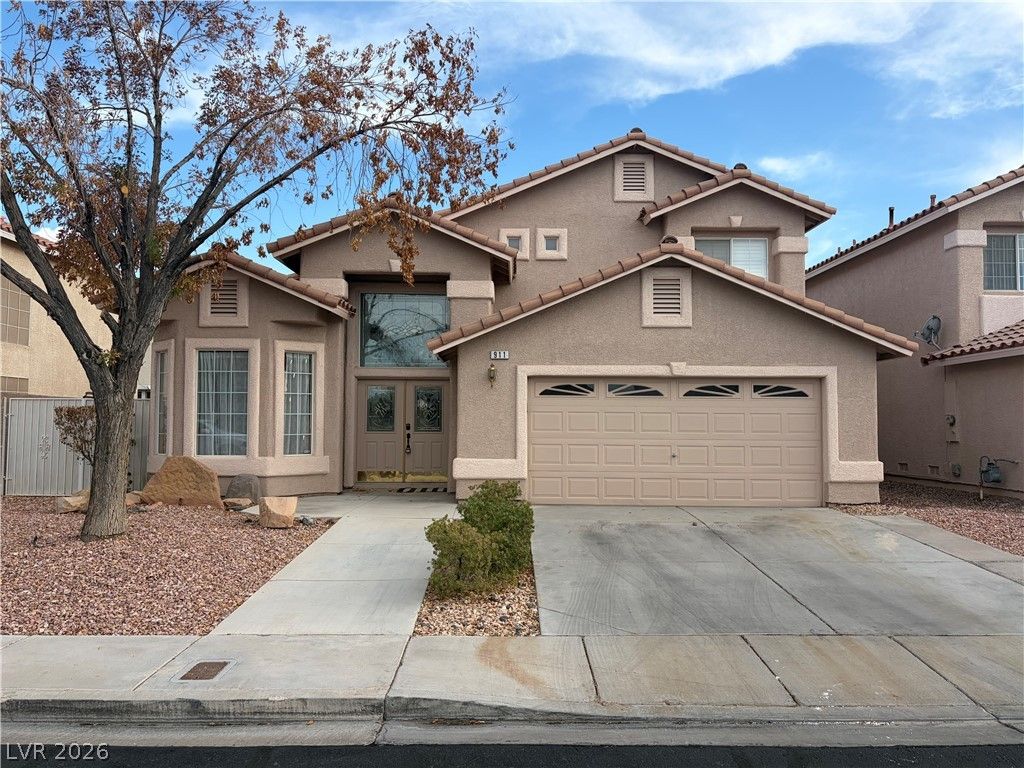
911 Sterling Thorn CourtActive
$450,0003 bd3 ba1,866 sqft$241/sqft0.90 mi40 days
Nearest comparable sales and listings
12 comparables · median price $512,500 · range $383,500 – $750,000 · median $/sq ft $230 · average $/sq ft $233
| Address | Status | Price | $/Sq Ft | Bd / Ba | Sq Ft | Sold / market time | Distance |
|---|---|---|---|---|---|---|---|
| 10568 Salmon Leap Street | Active | $599,000 | $219 | 4 / 3 | 2,730 | 85 days on market | 0.24 mi |
| 664 Pacific Star Court | Under Contract | $575,000 | $208 | 5 / 3 | 2,766 | 4 days on market | 0.24 mi |
| 10968 Geyser Peak Street | Sold | $383,500 | $170 | 4 / 3 | 2,255 | Sold 2026-09-11 | 0.34 mi |
| 3708 Toscanella Avenue | Sold | $636,000 | $239 | 5 / 4 | 2,664 | Sold 2026-09-25 | 0.35 mi |
| 3745 Via Corso Avenue | Sold | $615,000 | $243 | 4 / 3 | 2,534 | Sold 2026-09-16 | 0.49 mi |
| 829 Dancing Vines Avenue | Sold | $477,750 | $220 | 4 / 3 | 2,169 | Sold 2026-05-19 | 0.81 mi |
| 893 Dancing Vines Avenue | Sold | $435,000 | $201 | 4 / 3 | 2,169 | Sold 2026-07-09 | 0.81 mi |
| 10085 Mystic Dance Street | Sold | $424,000 | $251 | 3 / 3 | 1,692 | Sold 2026-07-23 | 0.83 mi |
| 10016 Mystic Dance Street | Active | $525,000 | $208 | 4 / 3 | 2,523 | 284 days on market | 0.89 mi |
| 911 Sterling Thorn Court | Active | $450,000 | $241 | 3 / 3 | 1,866 | 40 days on market | 0.90 mi |
| 1031 Bluebell Brook Street | Active | $750,000 | $341 | 3 / 3 | 2,202 | 0 days on market | 0.91 mi |
| 517 Pearberry Avenue | Active | $500,000 | $255 | 3 / 2 | 1,962 | 135 days on market | 0.95 mi |


