
Comparable Sales Near 7758 Fieldfare Drive, North Las Vegas, NV 89084
1st Realty · Comparable sales report · 1st.estate · October 20, 2026
Read the Aliante neighborhood guide →
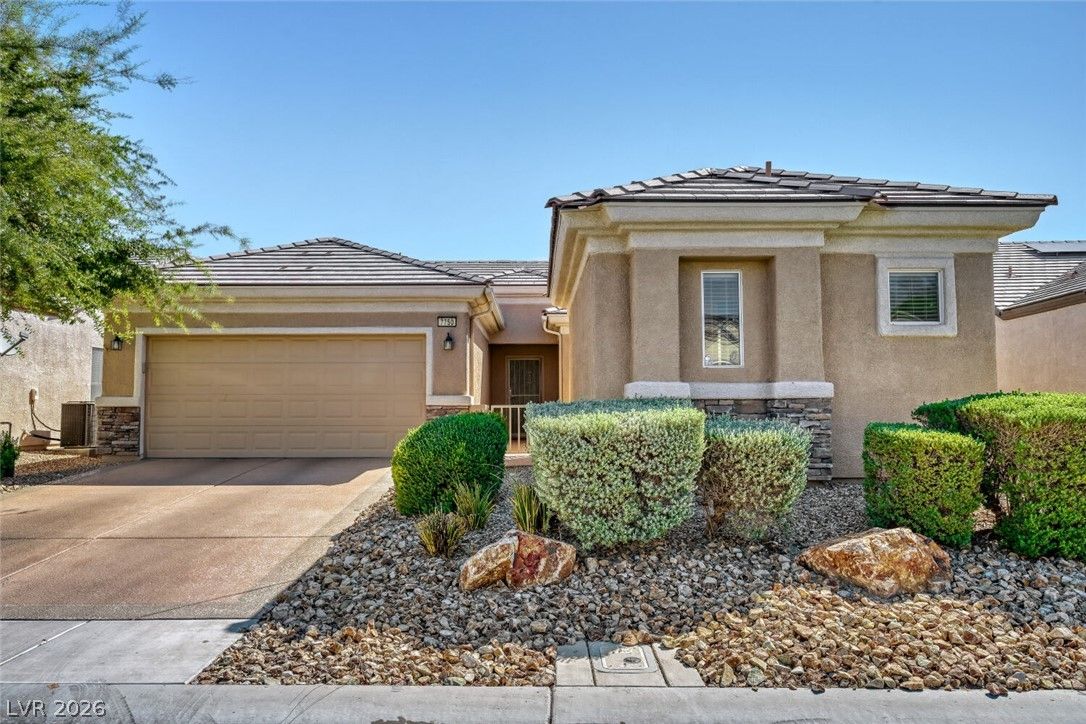
7758 Fieldfare Drive, North Las Vegas, NV 89084
Status: Sold
$2,100 Sold Price
$1
$ / Sq Ft
1,718
Living Area
5,227 sqft
Lot Size
3
Beds
2
Baths
2005
Year Built
Search Parameters
Property Type
Status
Radius
Sold Within
Beds
Baths
Living Area (Sq Ft)
Lot Size (Sq Ft)
This comp search reflects your current search parameters — adjust the filters above as needed for a more accurate estimate.
Estimated Value
—
Average $/Sqft
—
Check one or more comps below to calculate an estimate.
Nearest 10 of 63 comparable sales and listings within 1 mile of this home. Use the filters above and press Search to refine.
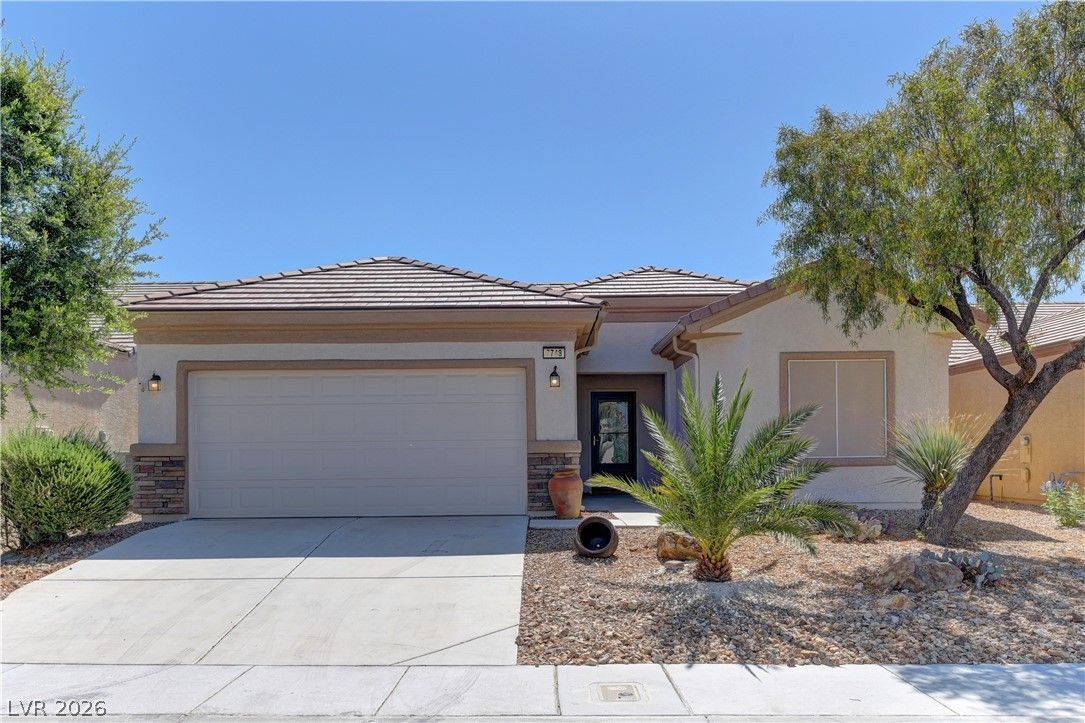
$358,0003 bd2 ba1,718 sqft$208/sqft0.08 mi105 daysSold 2026-10-02
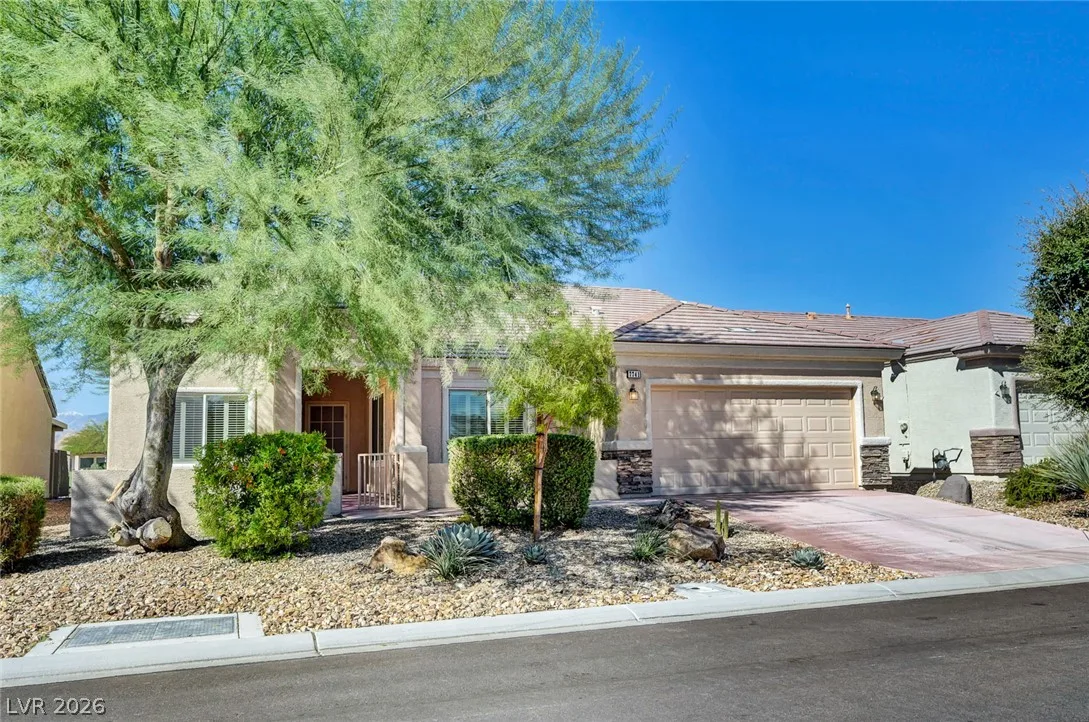
7741 Island Rail DriveActive
$449,9003 bd2 ba2,104 sqft$214/sqft0.11 mi0 days
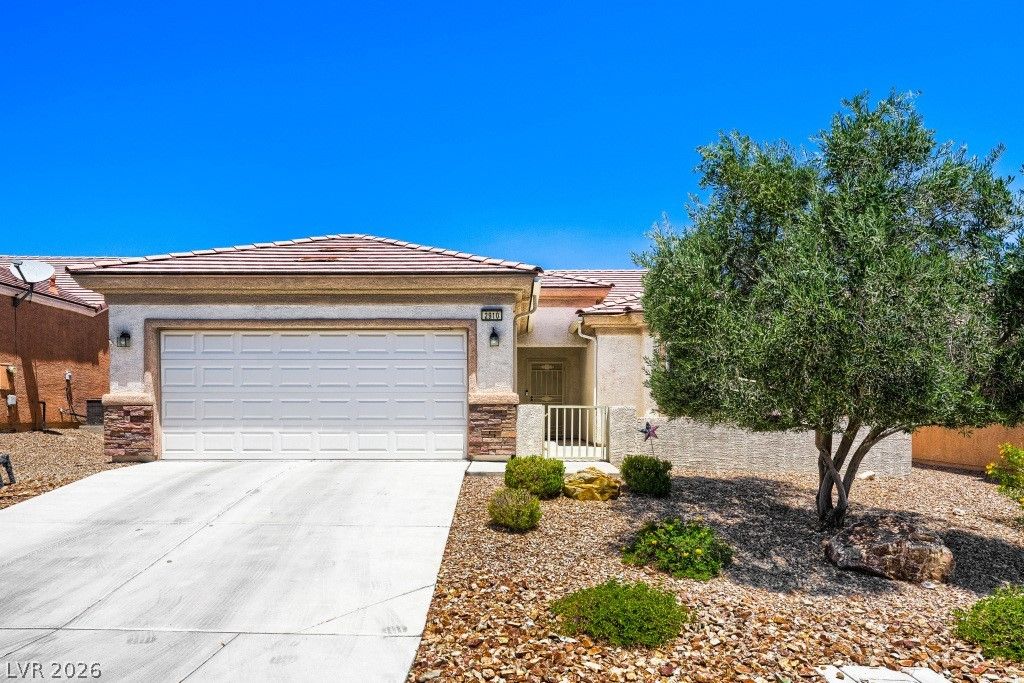
$374,8002 bd2 ba1,570 sqft$239/sqft0.11 mi67 daysSold 2026-09-23
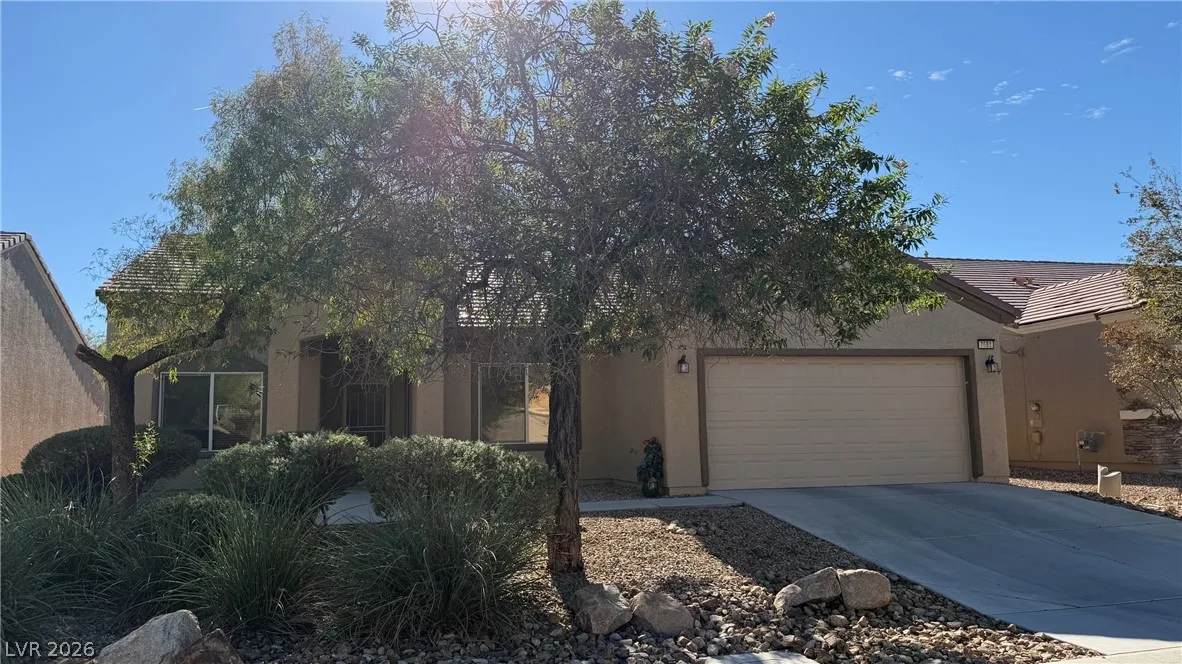
7682 Fieldfare DriveActive
$465,0002 bd2 ba2,104 sqft$221/sqft0.12 mi3 days
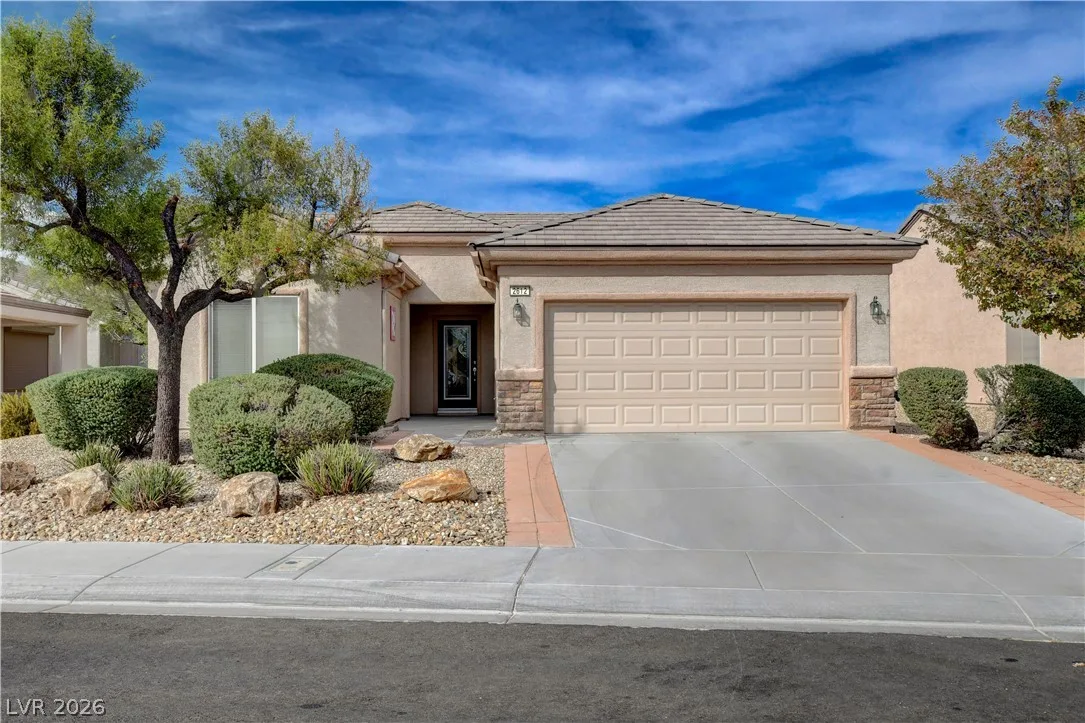
2612 Rock Pigeon AvenueActive
$412,5003 bd2 ba1,718 sqft$240/sqft0.12 mi13 days
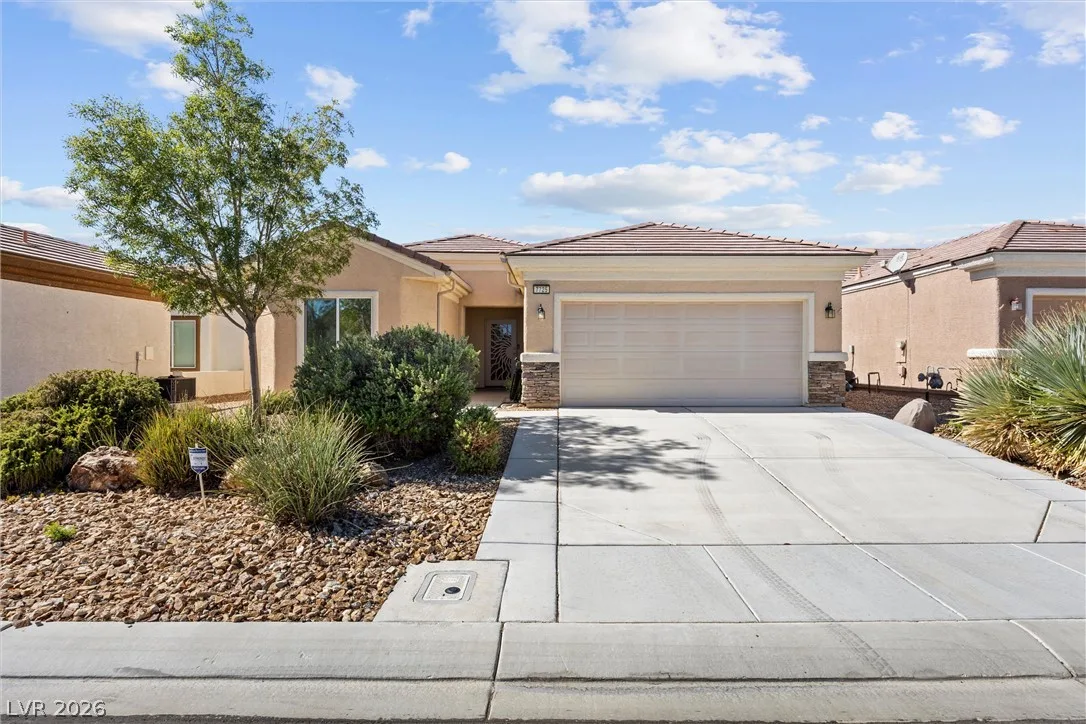
7725 Island Rail DrivePending
$429,0003 bd2 ba1,718 sqft$250/sqft0.12 mi3 days
$405,0002 bd2 ba1,570 sqft$258/sqft0.12 mi8 daysSold 2026-06-17
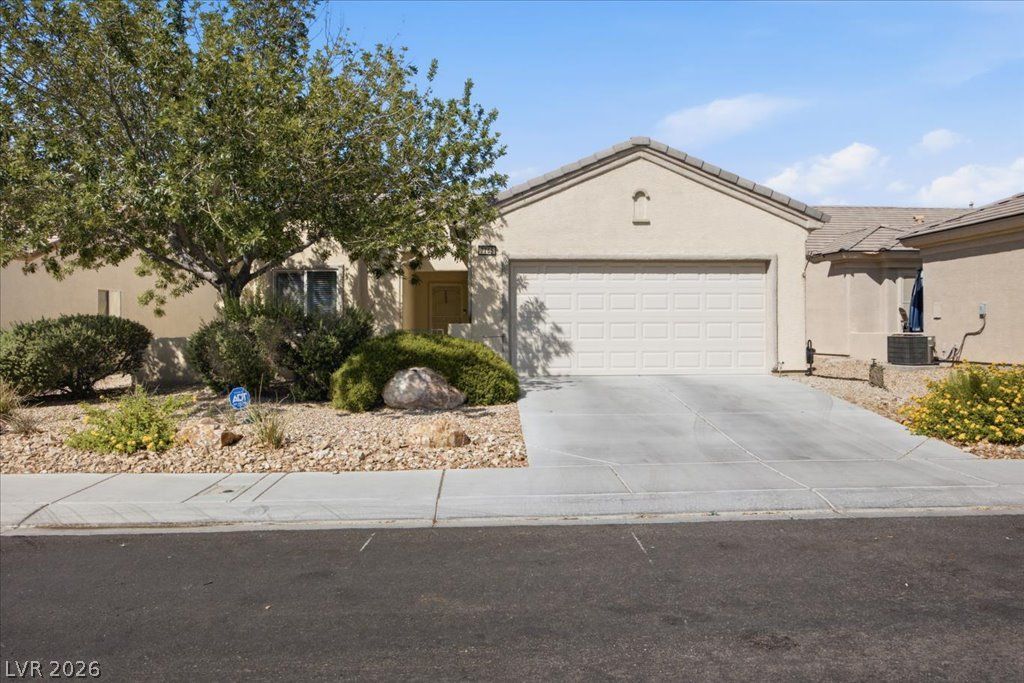
7765 Coast Jay StreetActive
$381,9002 bd2 ba1,570 sqft$243/sqft0.16 mi69 days
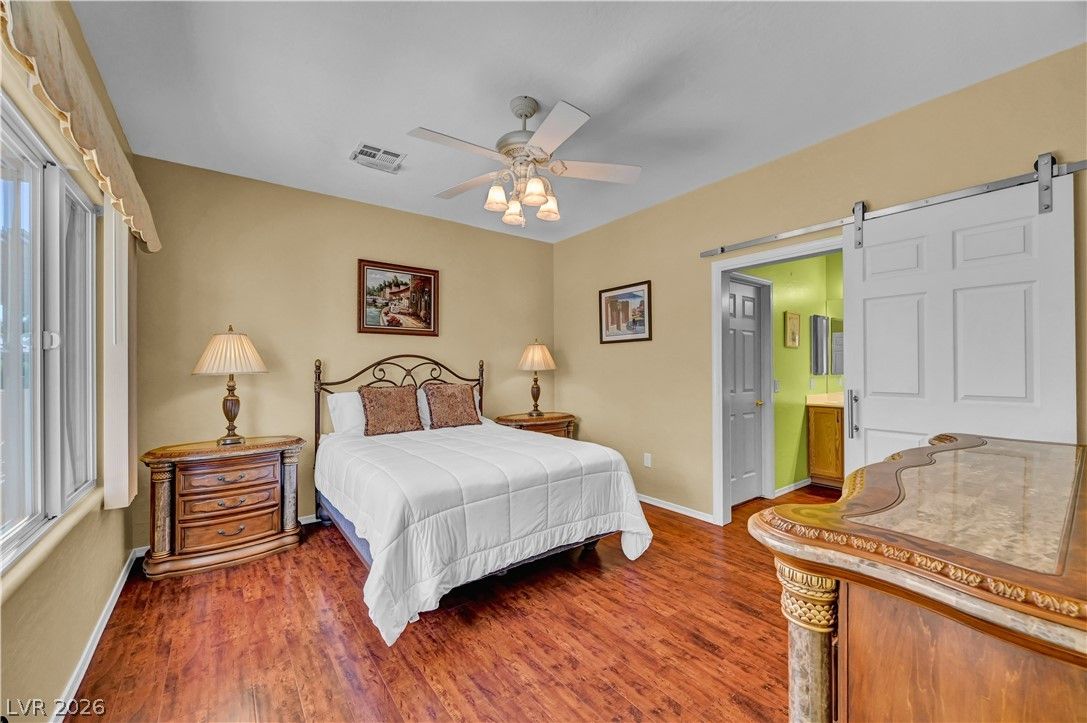
$367,0003 bd2 ba1,420 sqft$258/sqft0.18 mi37 daysSold 2026-09-23
7750 Coast Jay StreetPending
$425,0002 bd3 ba1,850 sqft$230/sqft0.20 mi70 days
Nearest comparable sales and listings
12 comparables · median price $408,750 · range $358,000 – $465,000 · median $/sq ft $242 · average $/sq ft $241
| Address | Status | Price | $/Sq Ft | Bd / Ba | Sq Ft | Sold / market time | Distance |
|---|---|---|---|---|---|---|---|
| 7748 Island Rail Drive | Sold | $358,000 | $208 | 3 / 2 | 1,718 | Sold 2026-10-02 | 0.08 mi |
| 7741 Island Rail Drive | Active | $449,900 | $214 | 3 / 2 | 2,104 | 0 days on market | 0.11 mi |
| 2910 Horned Owl Way | Sold | $374,800 | $239 | 2 / 2 | 1,570 | Sold 2026-09-23 | 0.11 mi |
| 7682 Fieldfare Drive | Active | $465,000 | $221 | 2 / 2 | 2,104 | 3 days on market | 0.12 mi |
| 2612 Rock Pigeon Avenue | Active | $412,500 | $240 | 3 / 2 | 1,718 | 13 days on market | 0.12 mi |
| 7725 Island Rail Drive | Pending | $429,000 | $250 | 3 / 2 | 1,718 | 3 days on market | 0.12 mi |
| 7681 Songster Street | Sold | $405,000 | $258 | 2 / 2 | 1,570 | Sold 2026-06-17 | 0.12 mi |
| 7765 Coast Jay Street | Active | $381,900 | $243 | 2 / 2 | 1,570 | 69 days on market | 0.16 mi |
| 2717 Willow Wren Drive | Sold | $367,000 | $258 | 3 / 2 | 1,420 | Sold 2026-09-23 | 0.18 mi |
| 7750 Coast Jay Street | Pending | $425,000 | $230 | 2 / 3 | 1,850 | 70 days on market | 0.20 mi |
| 7724 Fruit Dove Street | Sold | $415,000 | $264 | 2 / 2 | 1,570 | Sold 2026-06-18 | 0.21 mi |
| 2373 Desert Sparrow Avenue | Sold | $380,000 | $268 | 3 / 2 | 1,420 | Sold 2026-07-13 | 0.25 mi |


