
Comparable Sales Near 1318 Surrey Downs, Las Vegas, NV 89135
1st Realty · Comparable sales report · 1st.estate · October 20, 2026
Read the Summerlin neighborhood guide →
1318 Surrey Downs, Las Vegas, NV 89135
Status: Sold
$4,500 Sold Price
$2
$ / Sq Ft
2,358
Living Area
5,663 sqft
Lot Size
3
Beds
3
Baths
2006
Year Built
Search Parameters
Property Type
Status
Radius
Sold Within
Beds
Baths
Living Area (Sq Ft)
Lot Size (Sq Ft)
This comp search reflects your current search parameters — adjust the filters above as needed for a more accurate estimate.
Estimated Value
—
Average $/Sqft
—
Check one or more comps below to calculate an estimate.
Nearest 10 of 47 comparable sales and listings within 1 mile of this home. Use the filters above and press Search to refine.
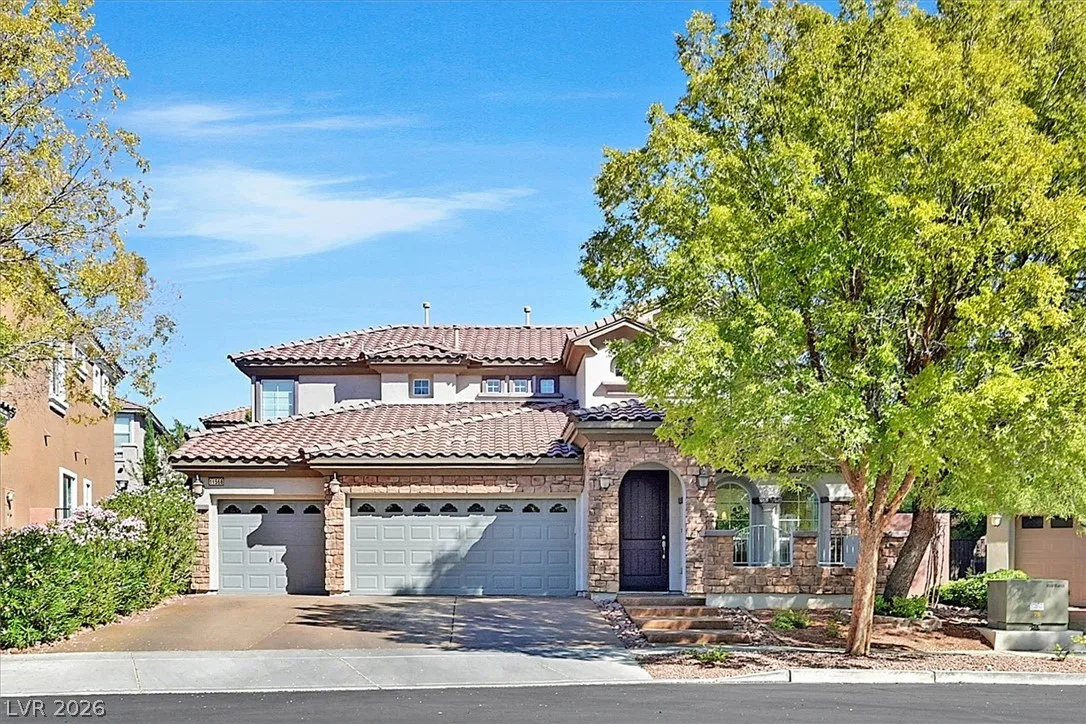
$875,0004 bd3 ba2,548 sqft$343/sqft0.07 mi1 days
$825,0004 bd3 ba2,744 sqft$301/sqft0.18 mi5 daysSold 2026-07-01
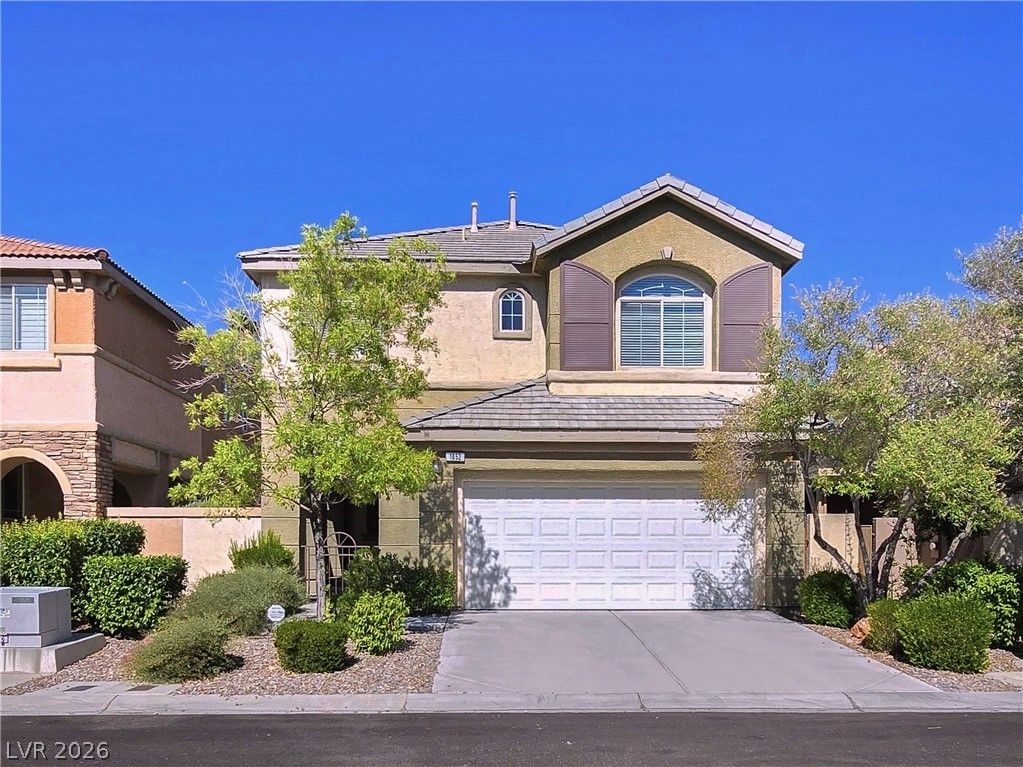
$505,0003 bd3 ba1,922 sqft$263/sqft0.21 mi43 daysSold 2026-09-09
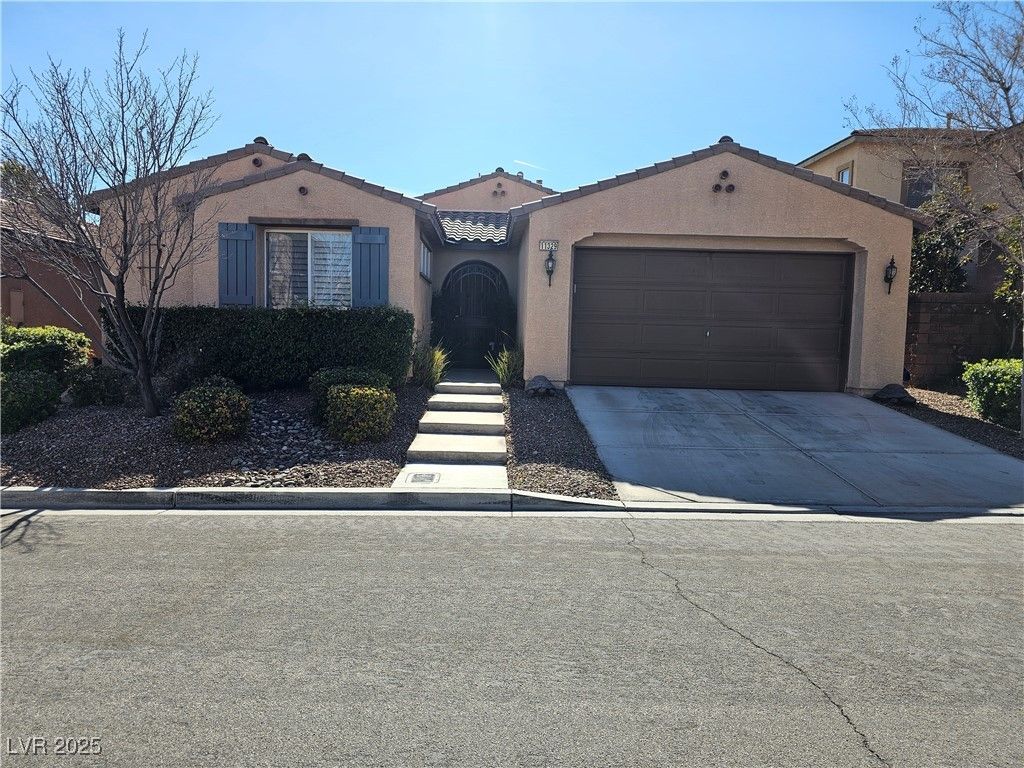
11329 Hedgemont AvenuePending
$625,0003 bd3 ba2,155 sqft$290/sqft0.26 mi5 days
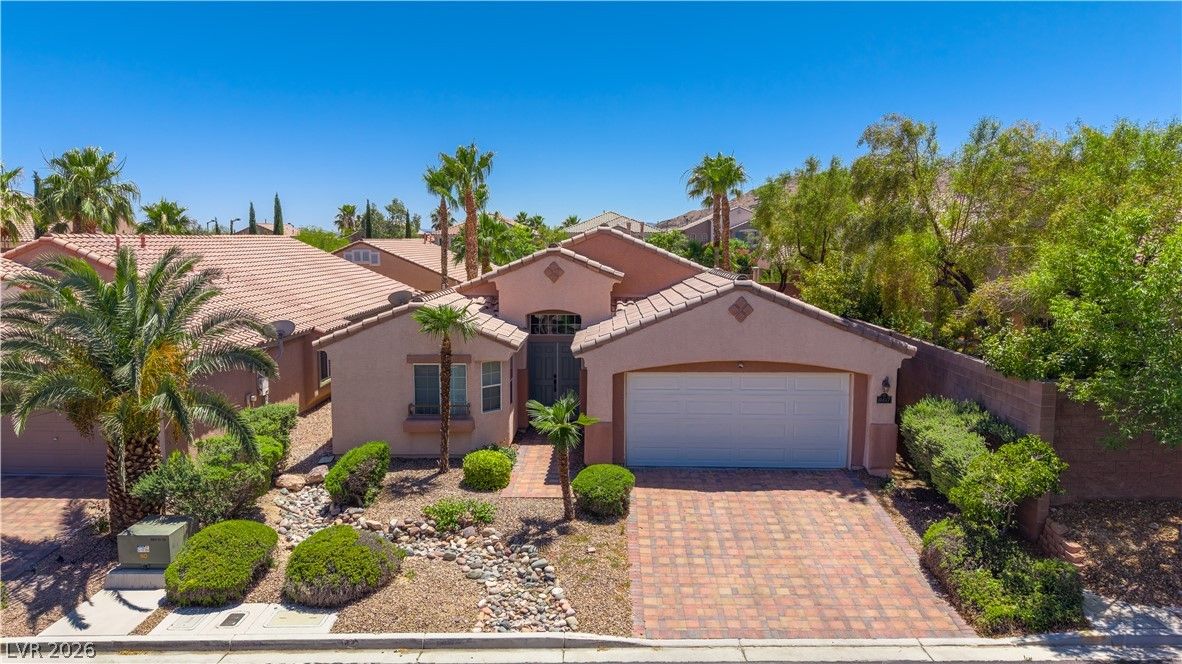
$777,5003 bd2 ba1,860 sqft$418/sqft0.26 mi74 daysSold 2026-10-02
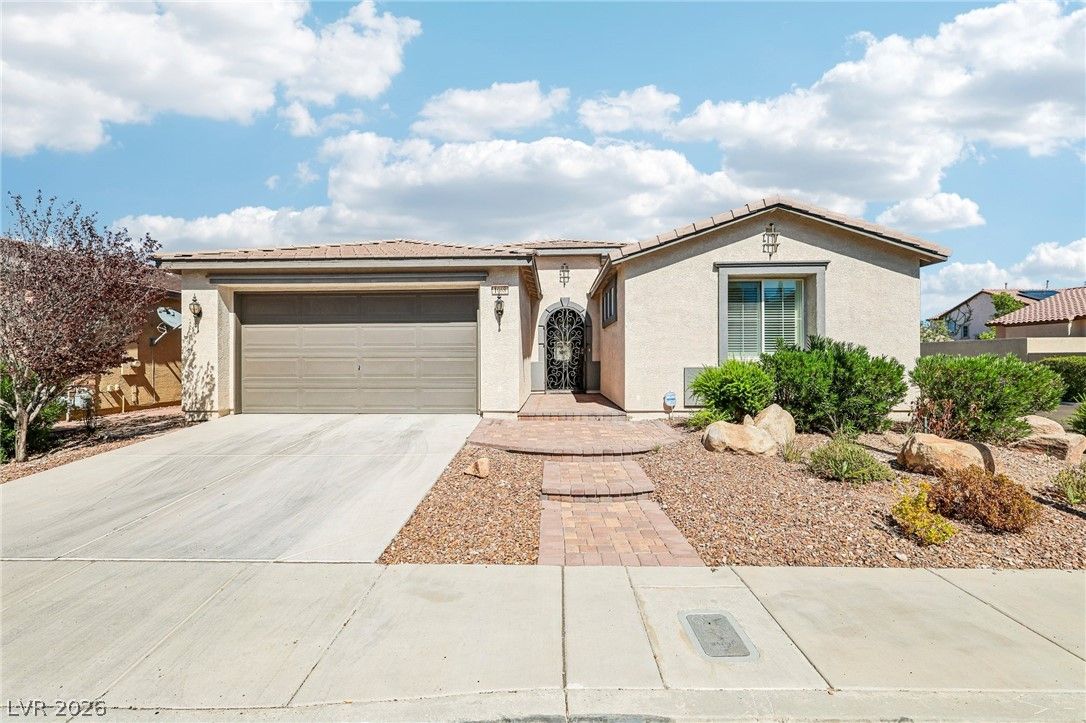
$660,0003 bd3 ba2,155 sqft$306/sqft0.29 mi1 daysSold 2026-09-28

1081 Maple Bend CourtActive
$699,9993 bd3 ba1,909 sqft$367/sqft0.30 mi59 days
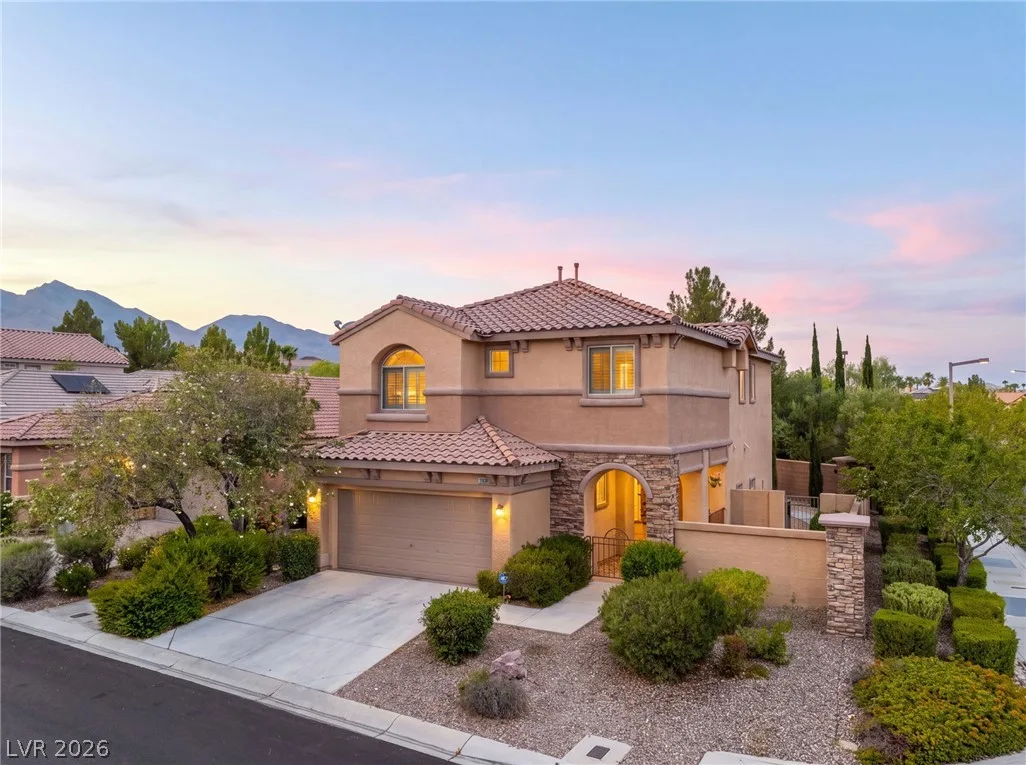
11436 Diveley AvenueActive
$609,0003 bd3 ba1,922 sqft$317/sqft0.30 mi0 days
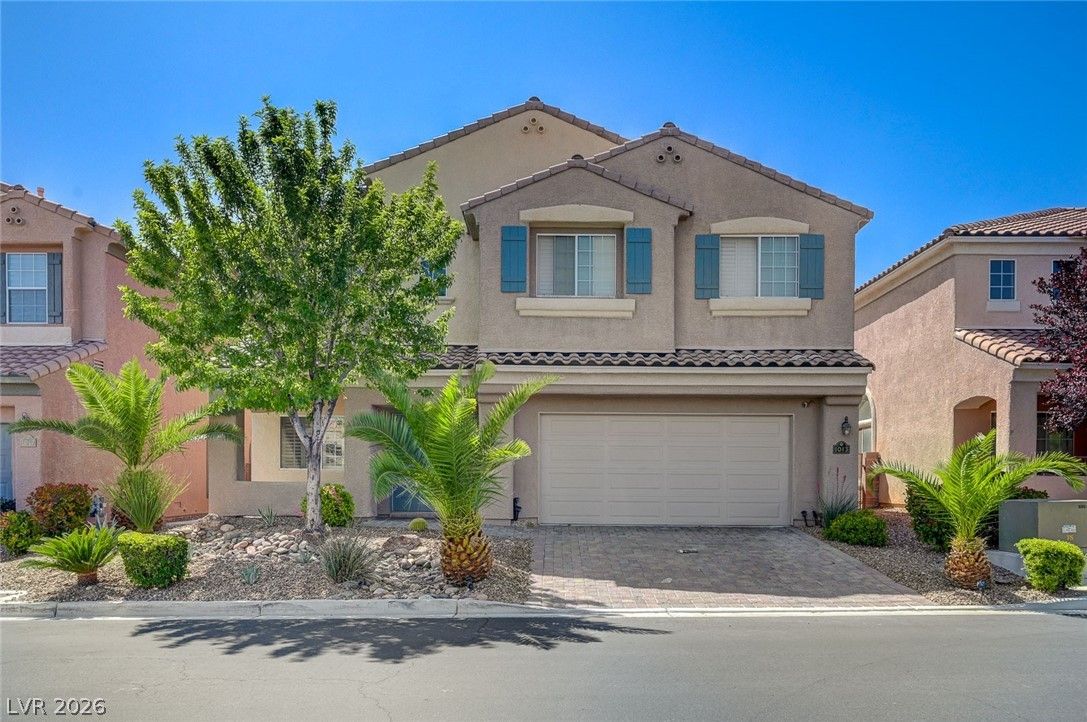
$679,3003 bd3 ba2,440 sqft$278/sqft0.31 mi50 daysSold 2026-07-24

1084 Maple Bend CourtActive
$695,0004 bd4 ba1,989 sqft$349/sqft0.32 mi14 days
Nearest comparable sales and listings
12 comparables · median price $679,650 · range $505,000 – $875,000 · median $/sq ft $303 · average $/sq ft $316
| Address | Status | Price | $/Sq Ft | Bd / Ba | Sq Ft | Sold / market time | Distance |
|---|---|---|---|---|---|---|---|
| 11568 Bradford Commons Drive | Active | $875,000 | $343 | 4 / 3 | 2,548 | 1 days on market | 0.07 mi |
| 1376 Cranston Court | Sold | $825,000 | $301 | 4 / 3 | 2,744 | Sold 2026-07-01 | 0.18 mi |
| 1052 Brinkman Street | Sold | $505,000 | $263 | 3 / 3 | 1,922 | Sold 2026-09-09 | 0.21 mi |
| 11329 Hedgemont Avenue | Pending | $625,000 | $290 | 3 / 3 | 2,155 | 5 days on market | 0.26 mi |
| 11617 Cabo Del Mesa Avenue | Sold | $777,500 | $418 | 3 / 2 | 1,860 | Sold 2026-10-02 | 0.26 mi |
| 1068 Oak Fair Street | Sold | $660,000 | $306 | 3 / 3 | 2,155 | Sold 2026-09-28 | 0.29 mi |
| 1081 Maple Bend Court | Active | $699,999 | $367 | 3 / 3 | 1,909 | 59 days on market | 0.30 mi |
| 11436 Diveley Avenue | Active | $609,000 | $317 | 3 / 3 | 1,922 | 0 days on market | 0.30 mi |
| 1013 Puerta Del Sol Drive | Sold | $679,300 | $278 | 3 / 3 | 2,440 | Sold 2026-07-24 | 0.31 mi |
| 1084 Maple Bend Court | Active | $695,000 | $349 | 4 / 4 | 1,989 | 14 days on market | 0.32 mi |
| 1001 Puerta Del Sol Drive | Active | $679,999 | $279 | 3 / 3 | 2,440 | 5 days on market | 0.33 mi |
| 11653 Royal Derwent Drive | Pending | $525,000 | $282 | 3 / 3 | 1,864 | 88 days on market | 0.38 mi |


