
Comparable Sales Near 768 Lawrence Drive, Henderson, NV 89015
1st Realty · Comparable sales report · 1st.estate · October 21, 2026
Read the Henderson area guide →
768 Lawrence Drive, Henderson, NV 89015
Status: Sold
$300,000 Sold Price
$205
$ / Sq Ft
1,462
Living Area
2,178 sqft
Lot Size
3
Beds
3
Baths
1981
Year Built
Search Parameters
Property Type
Status
Radius
Sold Within
Beds
Baths
Living Area (Sq Ft)
Lot Size (Sq Ft)
This comp search reflects your current search parameters — adjust the filters above as needed for a more accurate estimate.
Estimated Value
—
Average $/Sqft
—
Check one or more comps below to calculate an estimate.
Nearest 10 of 19 comparable sales and listings within 1 mile of this home. Use the filters above and press Search to refine.
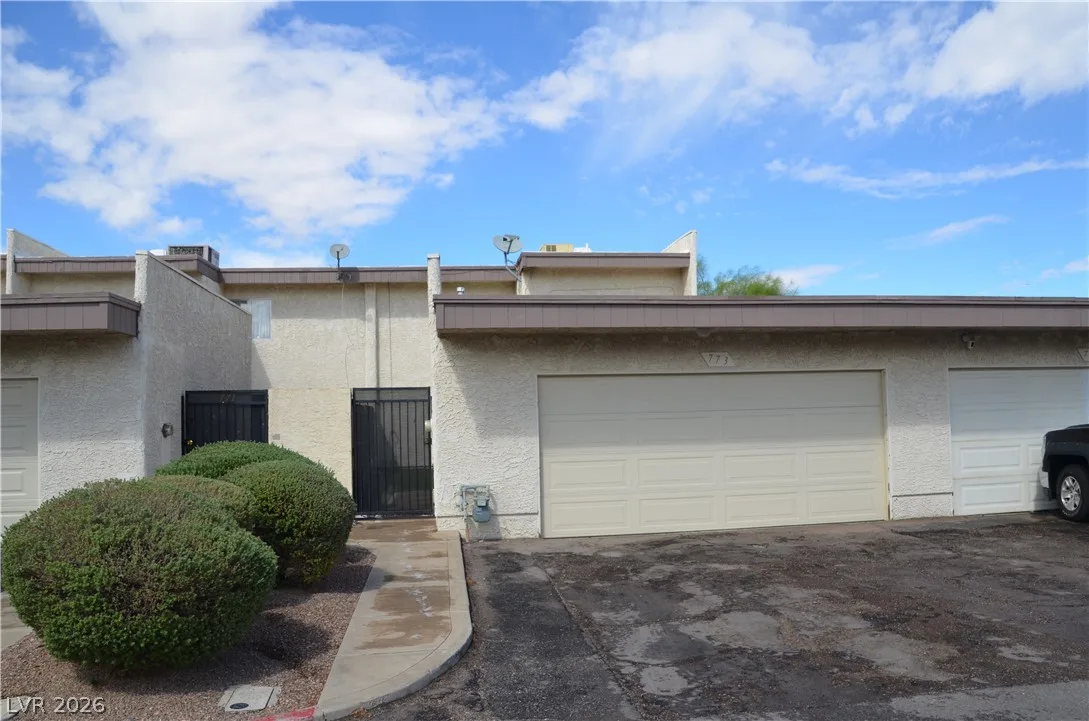
773 Cathy LaneActive
$269,0002 bd2 ba1,316 sqft$204/sqft0.02 mi20 days
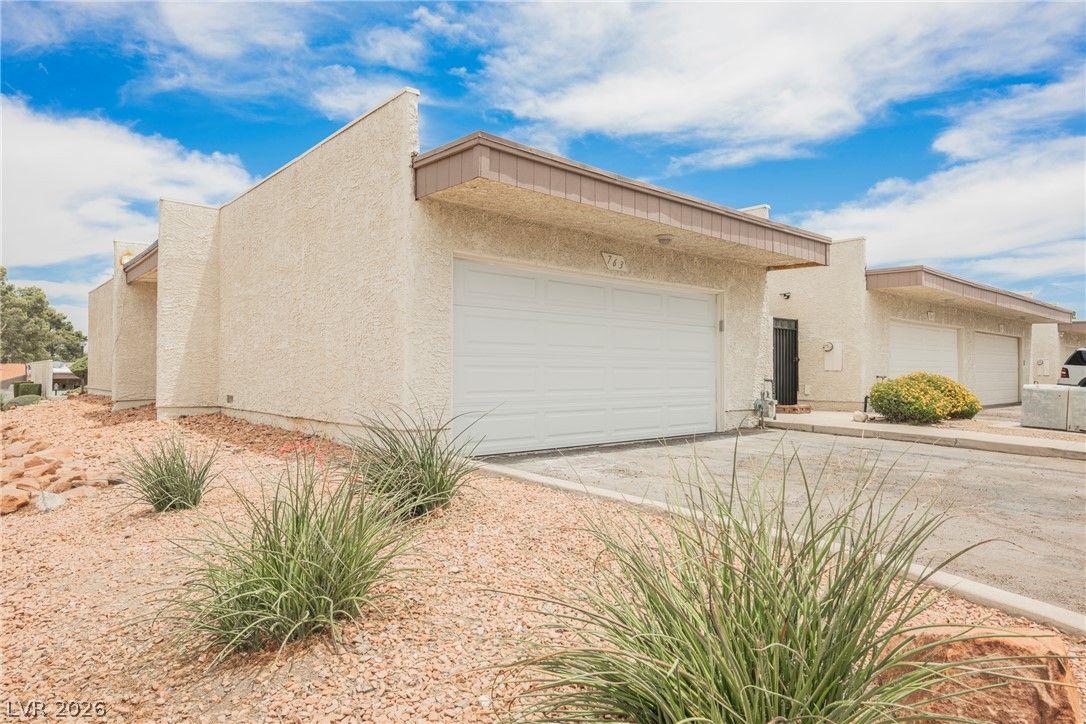
763 Cathy LaneSold
$304,5003 bd2 ba1,153 sqft$264/sqft0.03 mi50 daysSold 2026-08-19
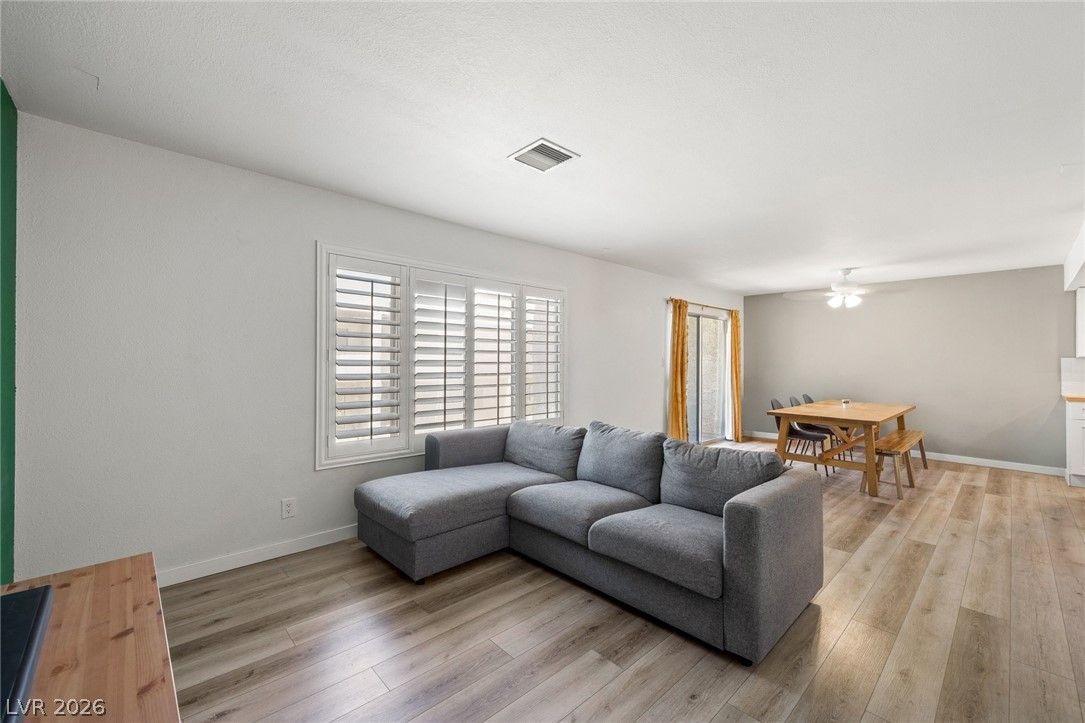
769 Anne LaneSold
$275,0003 bd3 ba1,462 sqft$188/sqft0.07 mi14 daysSold 2026-08-28
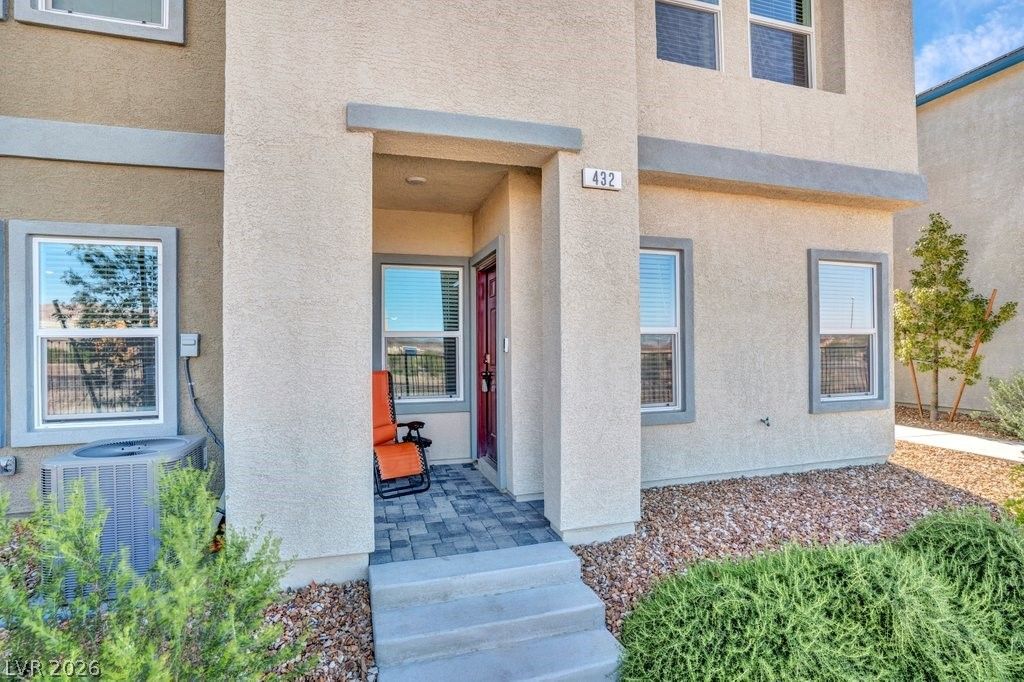
432 Horizon Cove PlaceActive
$305,0003 bd3 ba1,407 sqft$217/sqft0.22 mi164 days
$305,0003 bd3 ba1,407 sqft$217/sqft0.29 mi67 daysSold 2026-04-28

684 Harbor Mist AvenuePending
$318,0003 bd3 ba1,523 sqft$209/sqft0.45 mi26 days
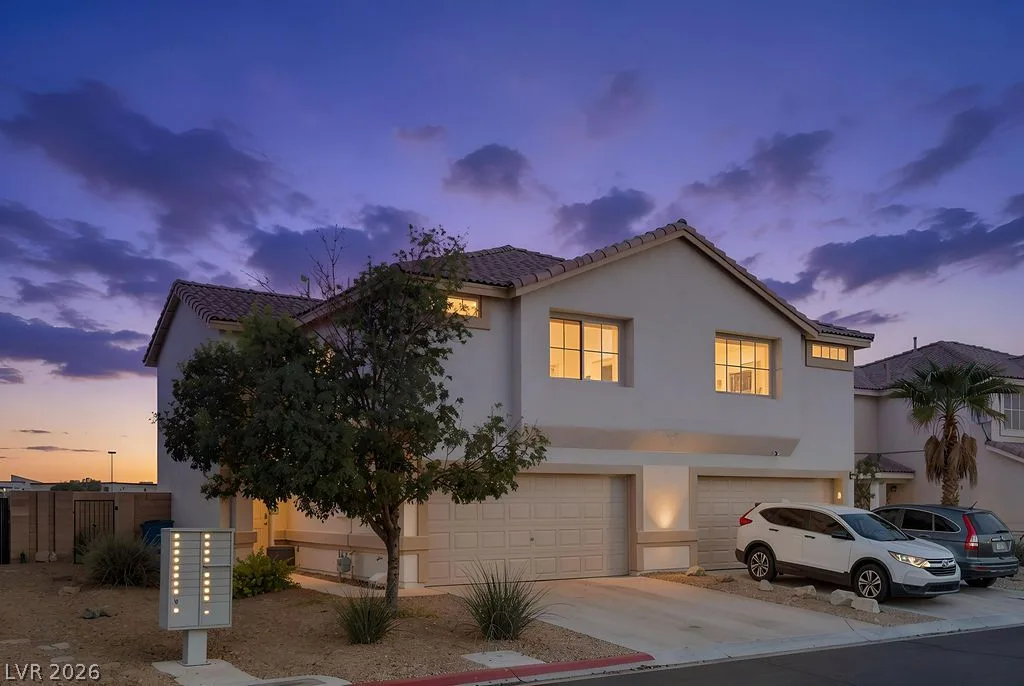
$305,0003 bd3 ba1,370 sqft$223/sqft0.57 mi19 days
$330,0003 bd3 ba1,370 sqft$241/sqft0.58 mi22 daysSold 2026-04-24
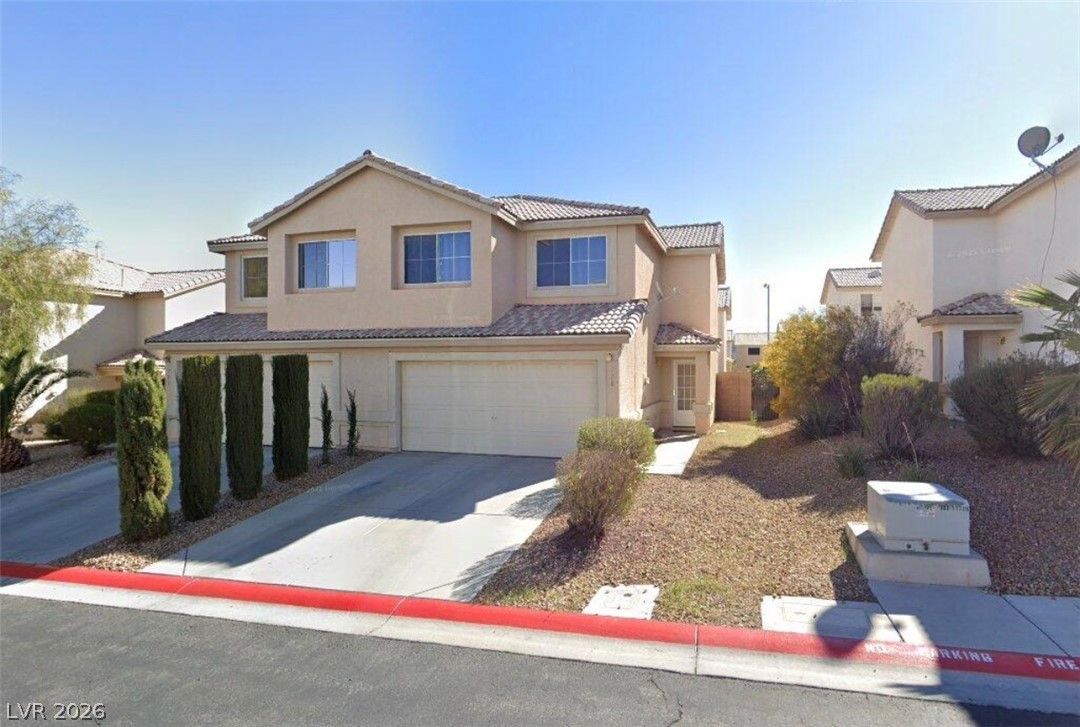
$330,0003 bd4 ba1,290 sqft$256/sqft0.59 mi0 days
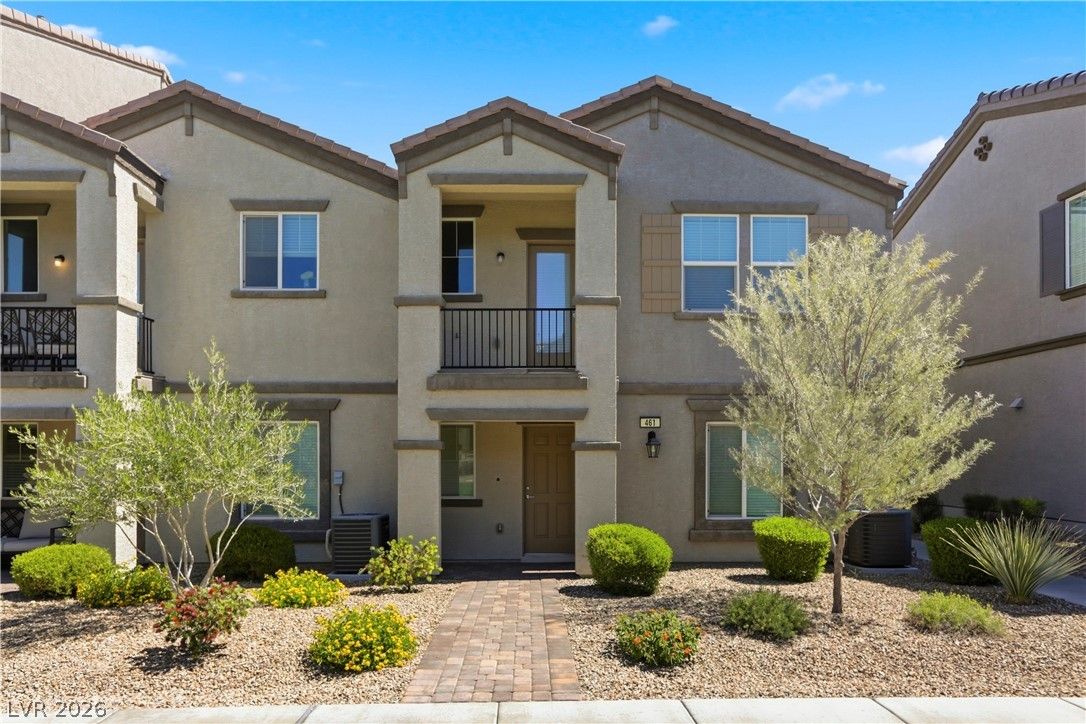
461 Ylang PlaceSold
$319,0003 bd2 ba1,376 sqft$232/sqft0.60 mi92 daysSold 2026-08-18
Nearest comparable sales and listings
12 comparables · median price $305,000 · range $269,000 – $330,000 · median $/sq ft $227 · average $/sq ft $227
| Address | Status | Price | $/Sq Ft | Bd / Ba | Sq Ft | Sold / market time | Distance |
|---|---|---|---|---|---|---|---|
| 773 Cathy Lane | Active | $269,000 | $204 | 2 / 2 | 1,316 | 20 days on market | 0.02 mi |
| 763 Cathy Lane | Sold | $304,500 | $264 | 3 / 2 | 1,153 | Sold 2026-08-19 | 0.03 mi |
| 769 Anne Lane | Sold | $275,000 | $188 | 3 / 3 | 1,462 | Sold 2026-08-28 | 0.07 mi |
| 432 Horizon Cove Place | Active | $305,000 | $217 | 3 / 3 | 1,407 | 164 days on market | 0.22 mi |
| 492 Waterfall Cove Court | Sold | $305,000 | $217 | 3 / 3 | 1,407 | Sold 2026-04-28 | 0.29 mi |
| 684 Harbor Mist Avenue | Pending | $318,000 | $209 | 3 / 3 | 1,523 | 26 days on market | 0.45 mi |
| 715 Peregrine Falcon Street | Active | $305,000 | $223 | 3 / 3 | 1,370 | 19 days on market | 0.57 mi |
| 787 Peregrine Falcon Street | Sold | $330,000 | $241 | 3 / 3 | 1,370 | Sold 2026-04-24 | 0.58 mi |
| 770 Peregrine Falcon Street | Active | $330,000 | $256 | 3 / 4 | 1,290 | 0 days on market | 0.59 mi |
| 461 Ylang Place | Sold | $319,000 | $232 | 3 / 2 | 1,376 | Sold 2026-08-18 | 0.60 mi |
| 705 Spotted Eagle Street | Sold | $329,000 | $240 | 3 / 3 | 1,370 | Sold 2026-05-27 | 0.61 mi |
| 713 Spotted Eagle Street | Sold | $305,000 | $236 | 3 / 3 | 1,290 | Sold 2026-06-12 | 0.61 mi |


