
Comparable Sales Near 758 RISE CANYON Drive, Henderson, NV 89052
1st Realty · Comparable sales report · 1st.estate · October 20, 2026
Read the Henderson area guide →
758 RISE CANYON Drive, Henderson, NV 89052
Status: Sold
$2,095 Sold Price
$1
$ / Sq Ft
1,776
Living Area
4,792 sqft
Lot Size
3
Beds
2
Baths
2004
Year Built
Search Parameters
Property Type
Status
Radius
Sold Within
Beds
Baths
Living Area (Sq Ft)
Lot Size (Sq Ft)
This comp search reflects your current search parameters — adjust the filters above as needed for a more accurate estimate.
Estimated Value
—
Average $/Sqft
—
Check one or more comps below to calculate an estimate.
Nearest 10 of 21 comparable sales and listings within 1 mile of this home. Use the filters above and press Search to refine.
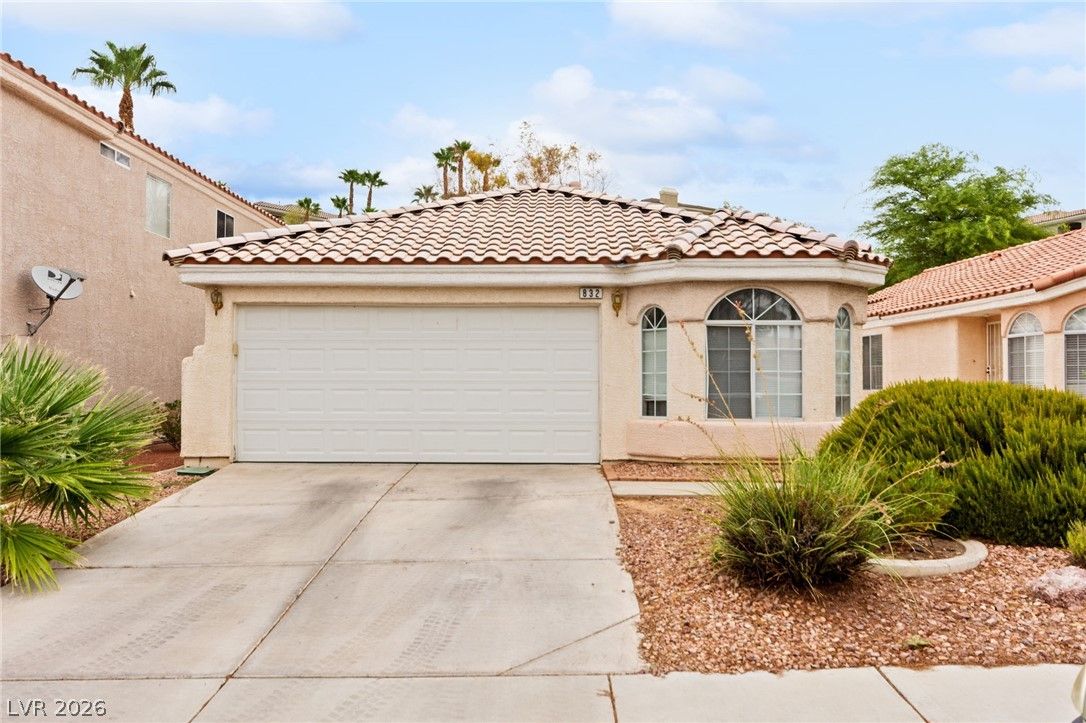
$388,0004 bd2 ba1,350 sqft$287/sqft0.19 mi31 daysSold 2026-10-16
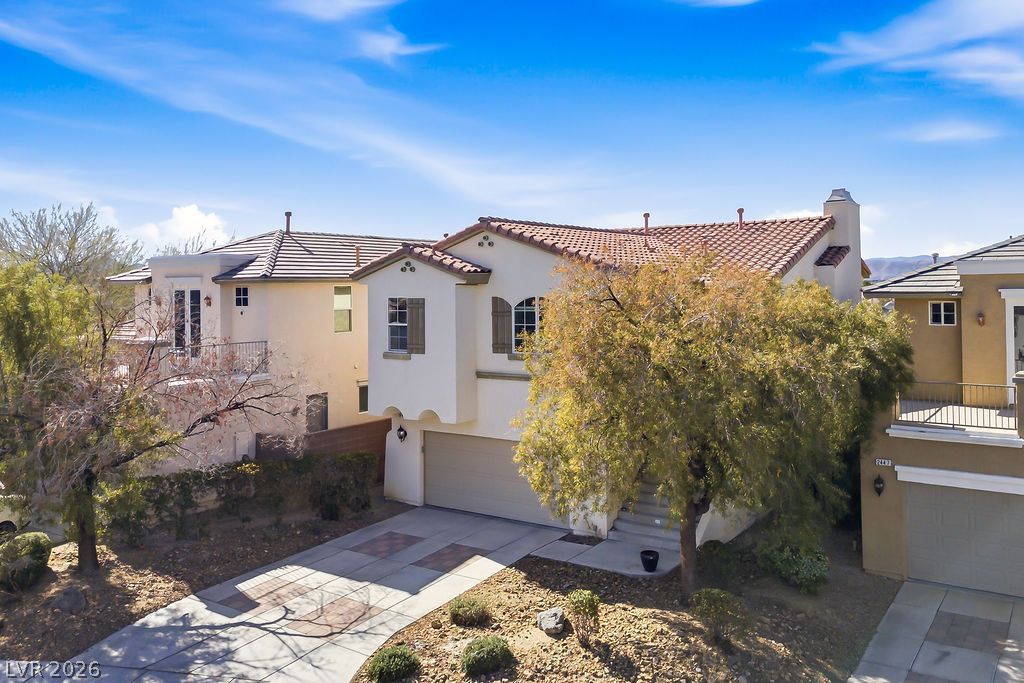
2443 Kaymin Ridge RoadUnder Contract
$499,9003 bd3 ba2,022 sqft$247/sqft0.20 mi84 days
2400 Worth CourtSold
$482,5003 bd3 ba1,902 sqft$254/sqft0.21 mi31 daysSold 2026-07-07
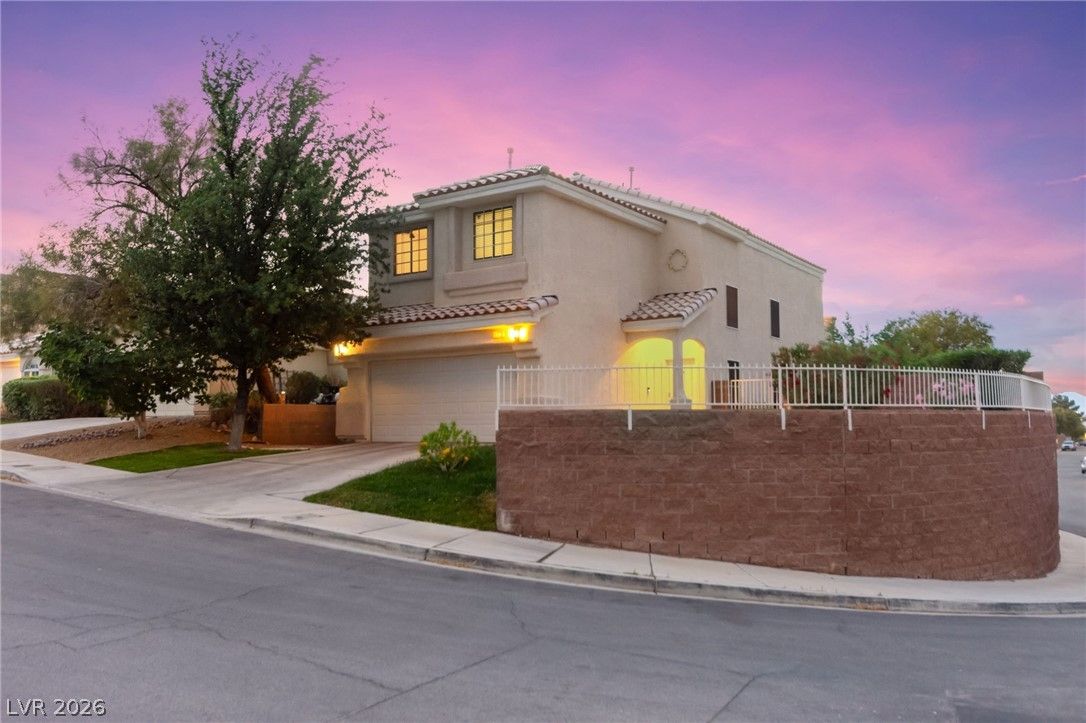
855 Binbrook DriveActive
$485,0003 bd3 ba1,902 sqft$255/sqft0.22 mi0 days
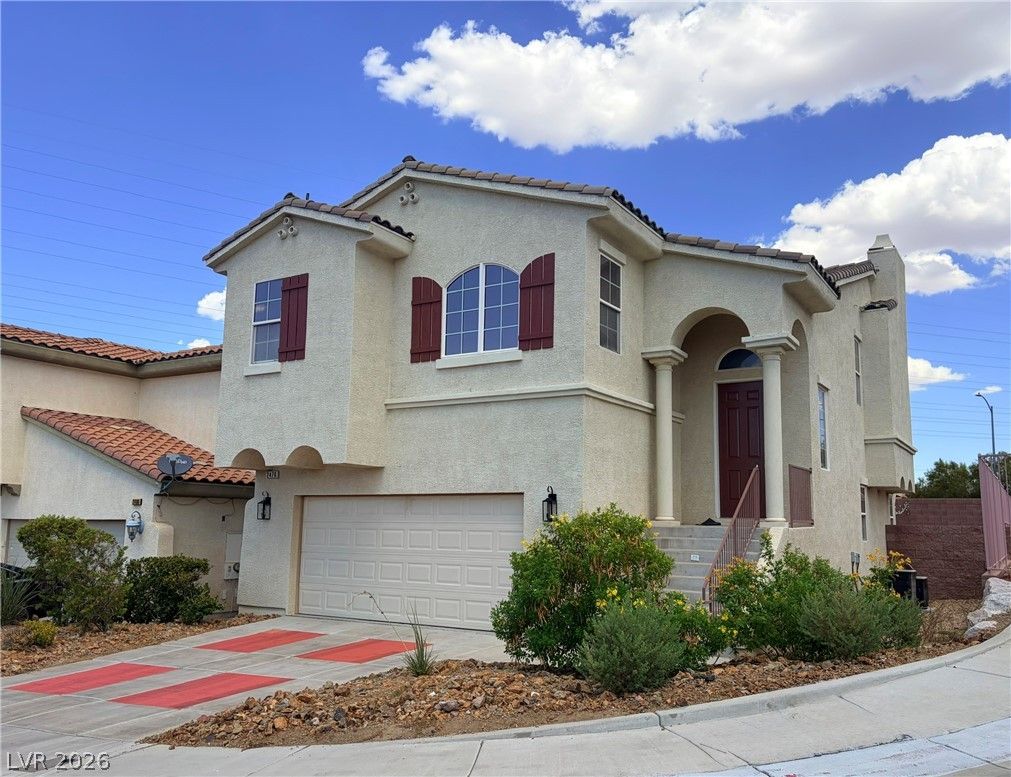
2476 Autumn Chase LaneActive
$527,0003 bd3 ba2,022 sqft$261/sqft0.22 mi26 days
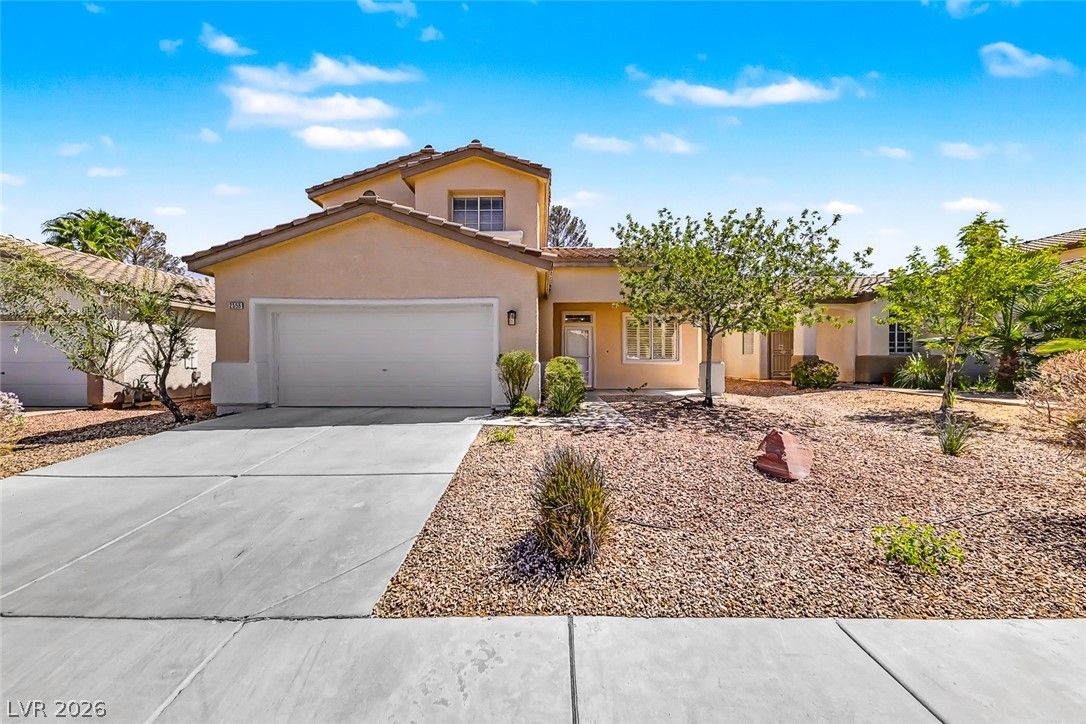
2555 Swans Chance AvenueActive
$568,0004 bd3 ba1,820 sqft$312/sqft0.30 mi10 days
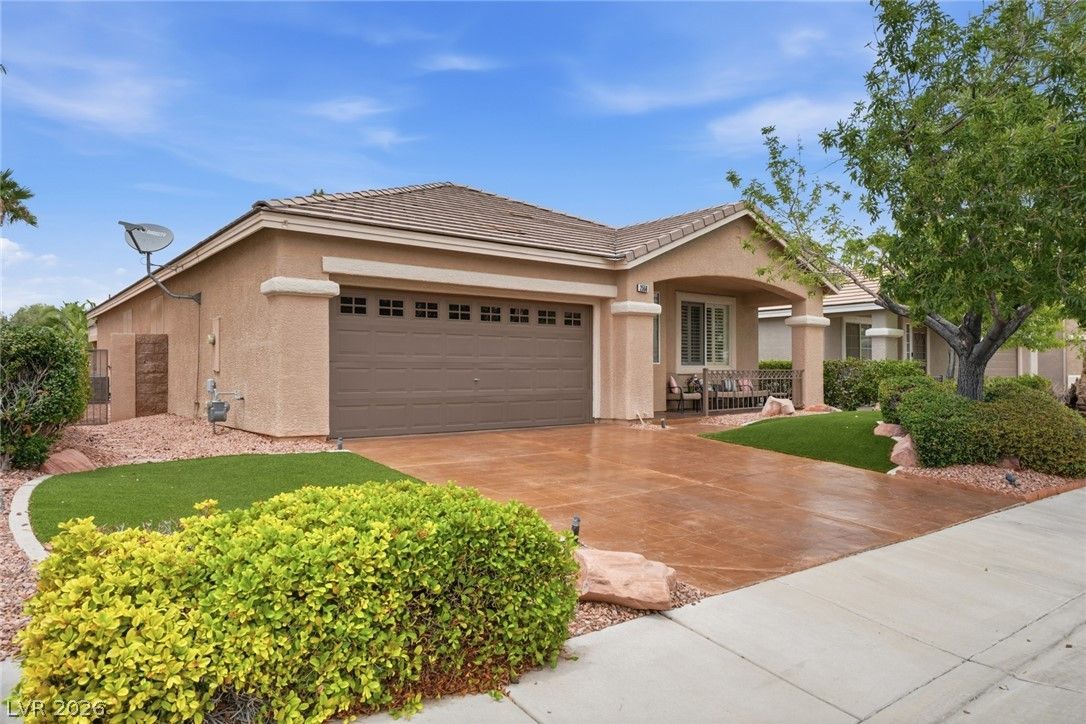
$515,0003 bd2 ba1,963 sqft$262/sqft0.31 mi23 daysSold 2026-09-08
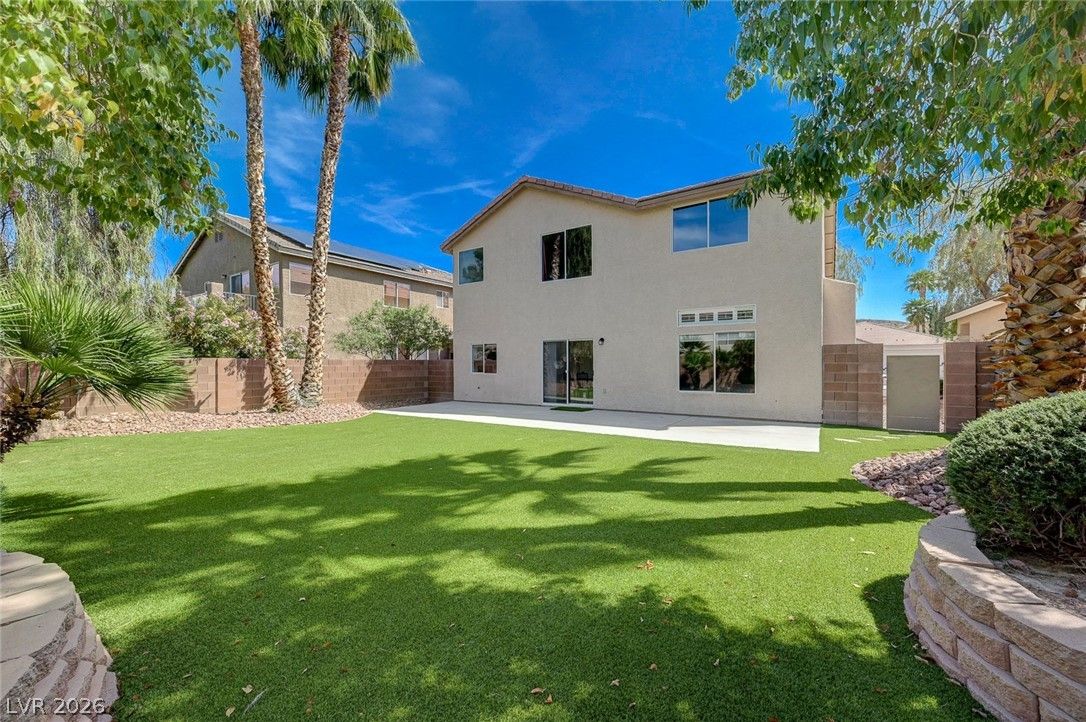
$515,0003 bd3 ba1,764 sqft$292/sqft0.32 mi16 daysSold 2026-08-13

972 Upper Meadows PlaceActive
$548,8883 bd3 ba1,706 sqft$322/sqft0.55 mi153 days
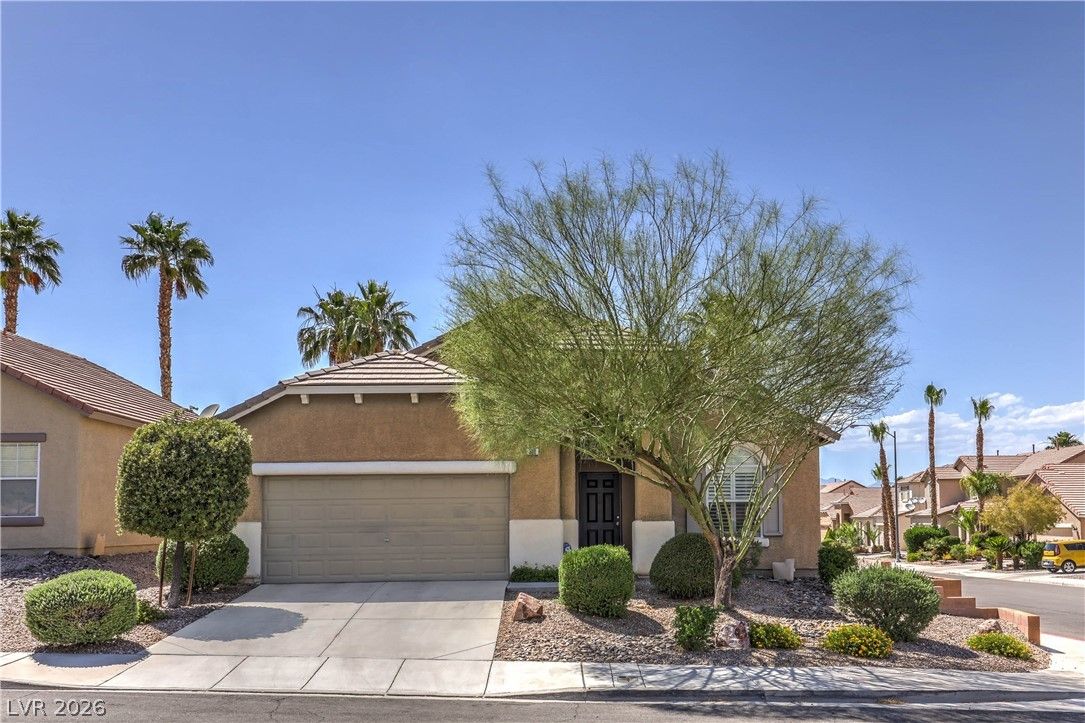
$499,5003 bd2 ba1,672 sqft$299/sqft0.70 mi49 daysSold 2026-07-24
Nearest comparable sales and listings
12 comparables · median price $507,450 · range $388,000 – $568,000 · median $/sq ft $290 · average $/sq ft $293
| Address | Status | Price | $/Sq Ft | Bd / Ba | Sq Ft | Sold / market time | Distance |
|---|---|---|---|---|---|---|---|
| 832 Binbrook Drive | Sold | $388,000 | $287 | 4 / 2 | 1,350 | Sold 2026-10-16 | 0.19 mi |
| 2443 Kaymin Ridge Road | Under Contract | $499,900 | $247 | 3 / 3 | 2,022 | 84 days on market | 0.20 mi |
| 2400 Worth Court | Sold | $482,500 | $254 | 3 / 3 | 1,902 | Sold 2026-07-07 | 0.21 mi |
| 855 Binbrook Drive | Active | $485,000 | $255 | 3 / 3 | 1,902 | 0 days on market | 0.22 mi |
| 2476 Autumn Chase Lane | Active | $527,000 | $261 | 3 / 3 | 2,022 | 26 days on market | 0.22 mi |
| 2555 Swans Chance Avenue | Active | $568,000 | $312 | 4 / 3 | 1,820 | 10 days on market | 0.30 mi |
| 2558 Hitchcock Street | Sold | $515,000 | $262 | 3 / 2 | 1,963 | Sold 2026-09-08 | 0.31 mi |
| 2558 Williamsburg Street | Sold | $515,000 | $292 | 3 / 3 | 1,764 | Sold 2026-08-13 | 0.32 mi |
| 972 Upper Meadows Place | Active | $548,888 | $322 | 3 / 3 | 1,706 | 153 days on market | 0.55 mi |
| 568 Broken Shale Circle | Sold | $499,500 | $299 | 3 / 2 | 1,672 | Sold 2026-07-24 | 0.70 mi |
| 533 Kings Links Street | Sold | $475,000 | $343 | 2 / 2 | 1,386 | Sold 2026-05-15 | 0.75 mi |
| 2189 Eagle Watch Drive | Active | $539,000 | $380 | 2 / 2 | 1,420 | 37 days on market | 0.78 mi |


