
Comparable Sales Near 2708 Norbeck Street, Las Vegas, NV 89117
1st Realty · Comparable sales report · 1st.estate · October 21, 2026
Read the Spring Valley neighborhood guide →
2708 Norbeck Street, Las Vegas, NV 89117
Status: Sold
$430,000 Sold Price
$357
$ / Sq Ft
1,205
Living Area
4,356 sqft
Lot Size
3
Beds
2
Baths
1988
Year Built
Search Parameters
Property Type
Status
Radius
Sold Within
Beds
Baths
Living Area (Sq Ft)
Lot Size (Sq Ft)
This comp search reflects your current search parameters — adjust the filters above as needed for a more accurate estimate.
Estimated Value
—
Average $/Sqft
—
Check one or more comps below to calculate an estimate.
Nearest 10 of 23 comparable sales and listings within 1 mile of this home. Use the filters above and press Search to refine.
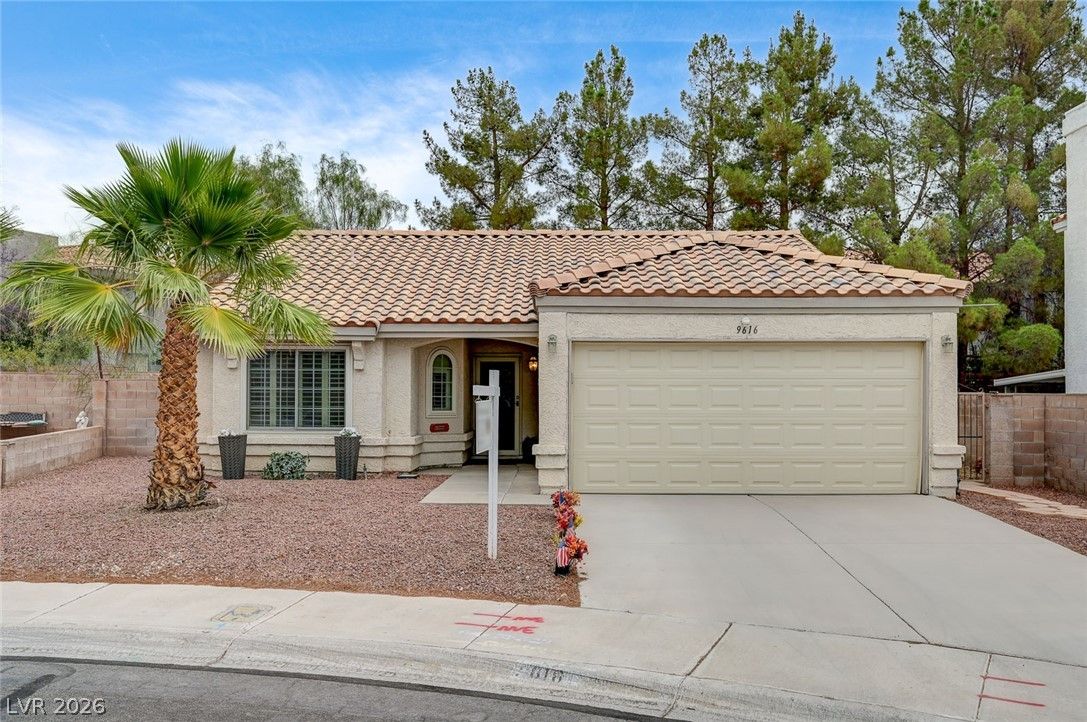
$370,0002 bd2 ba1,070 sqft$346/sqft0.06 mi61 daysSold 2026-10-02
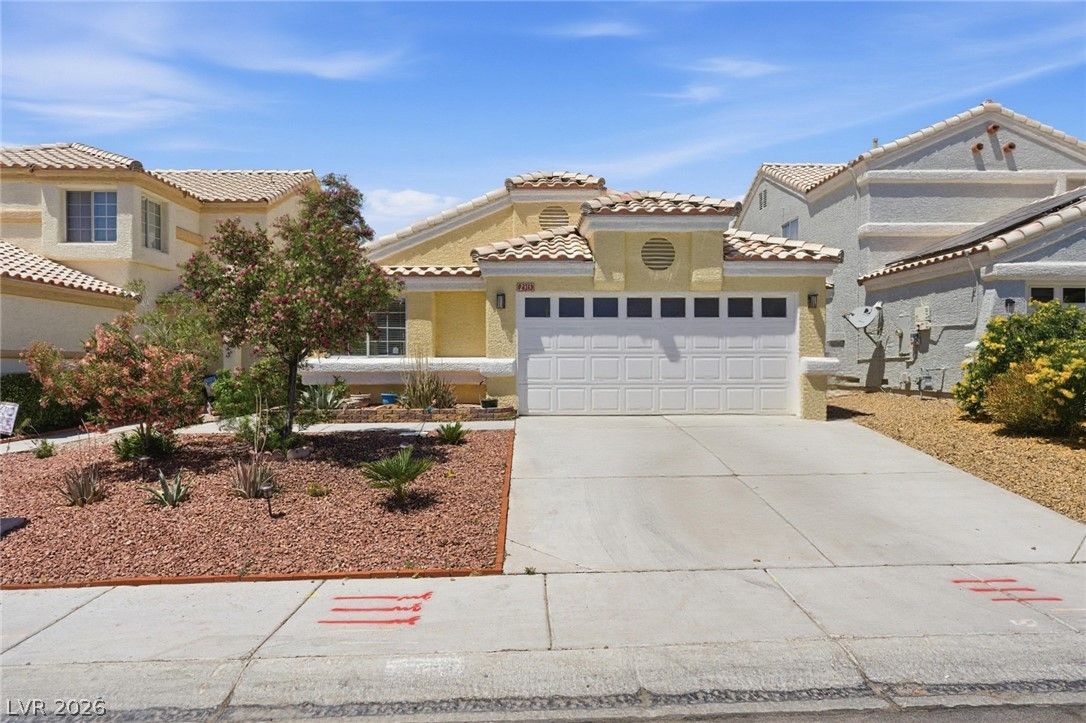
2313 Diamondback DriveActive
$419,9903 bd2 ba1,485 sqft$283/sqft0.40 mi91 days
$450,0003 bd2 ba1,321 sqft$341/sqft0.55 mi28 daysSold 2026-06-04
$333,0002 bd2 ba1,259 sqft$264/sqft0.56 mi15 daysSold 2026-06-29
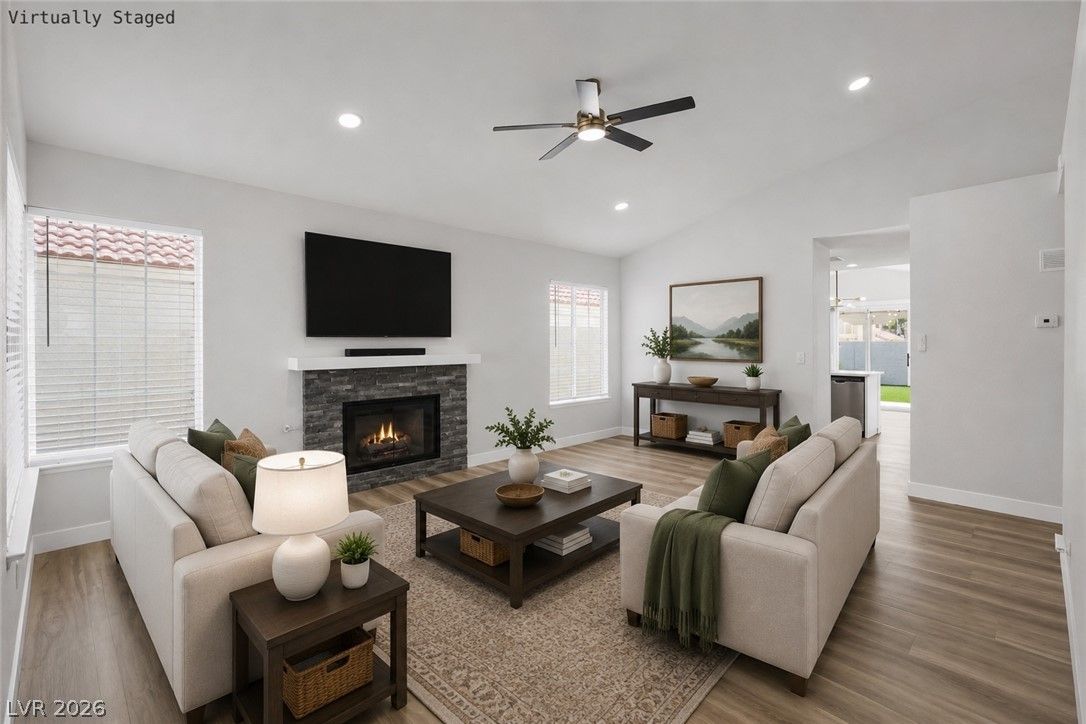
$430,0003 bd2 ba1,259 sqft$342/sqft0.56 mi5 daysSold 2026-09-25
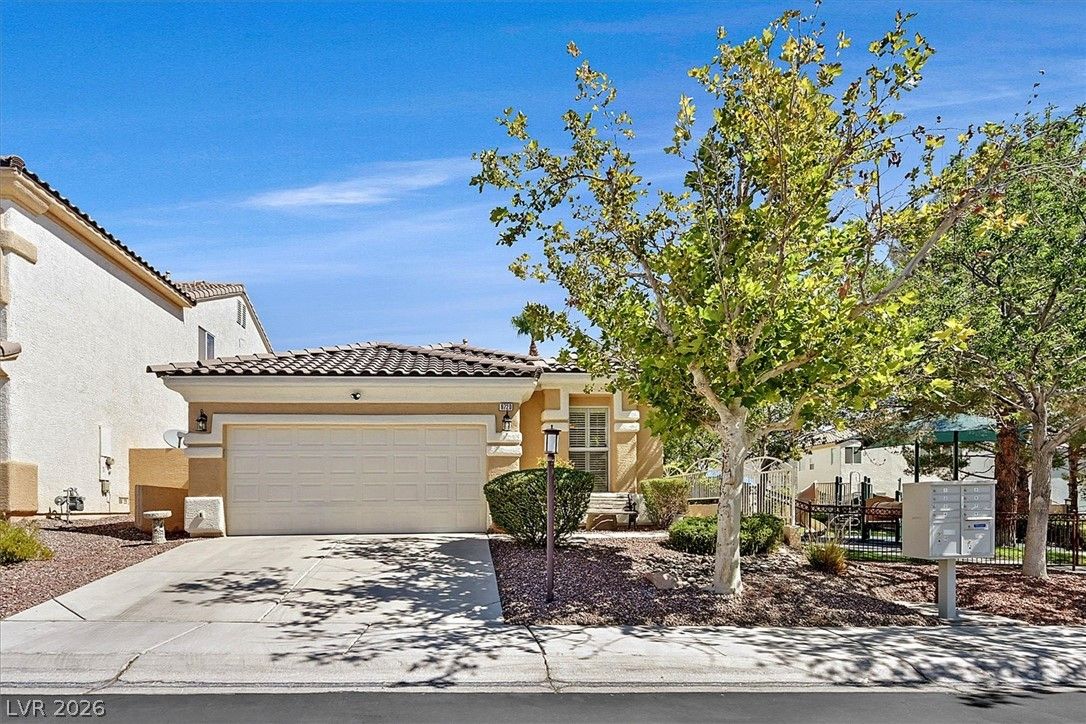
$445,0003 bd2 ba1,321 sqft$337/sqft0.66 mi5 daysSold 2026-08-24
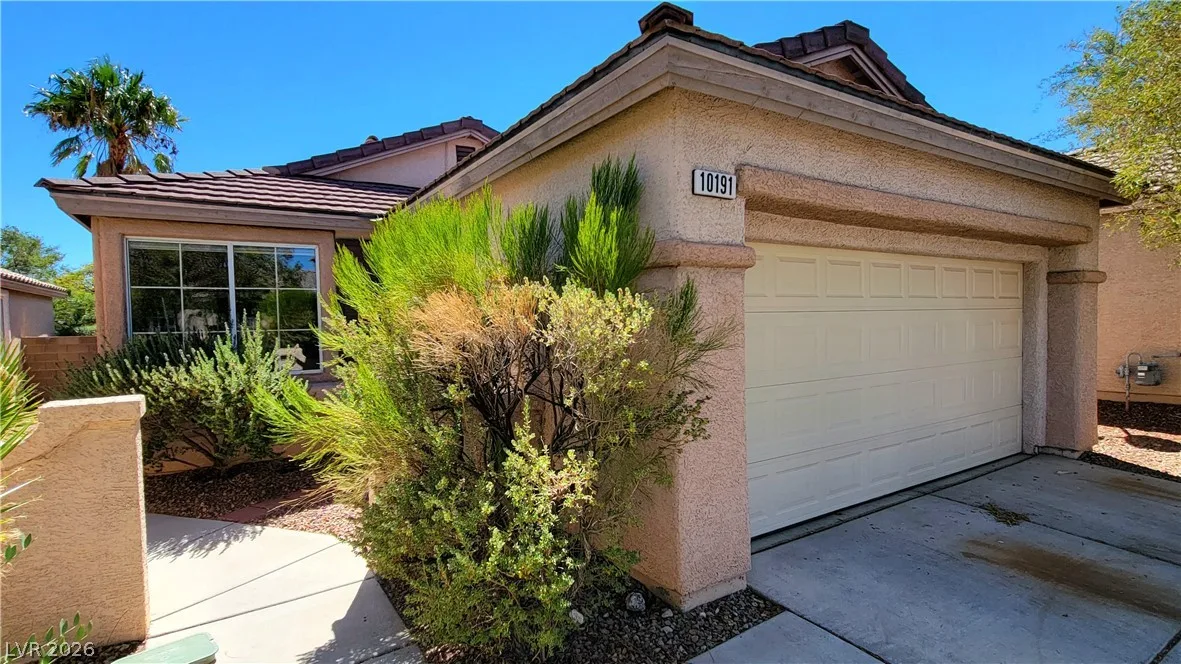
$458,0002 bd2 ba1,310 sqft$350/sqft0.67 mi1 days
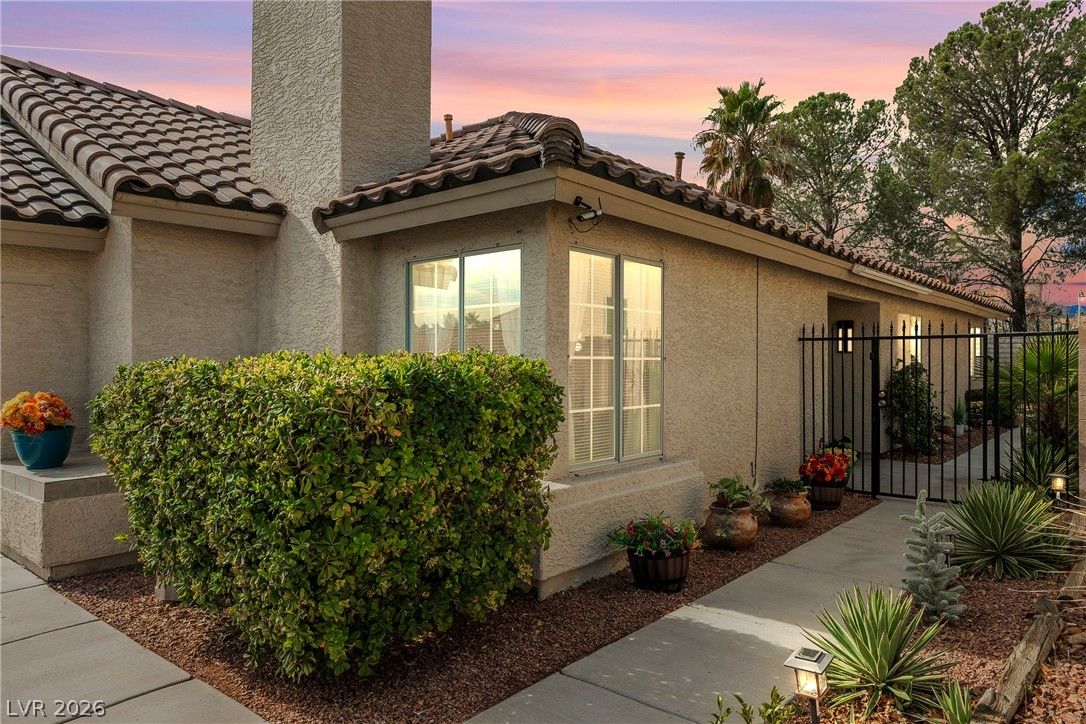
3213 Oyster Bay StreetActive
$444,9993 bd2 ba1,350 sqft$330/sqft0.68 mi0 days
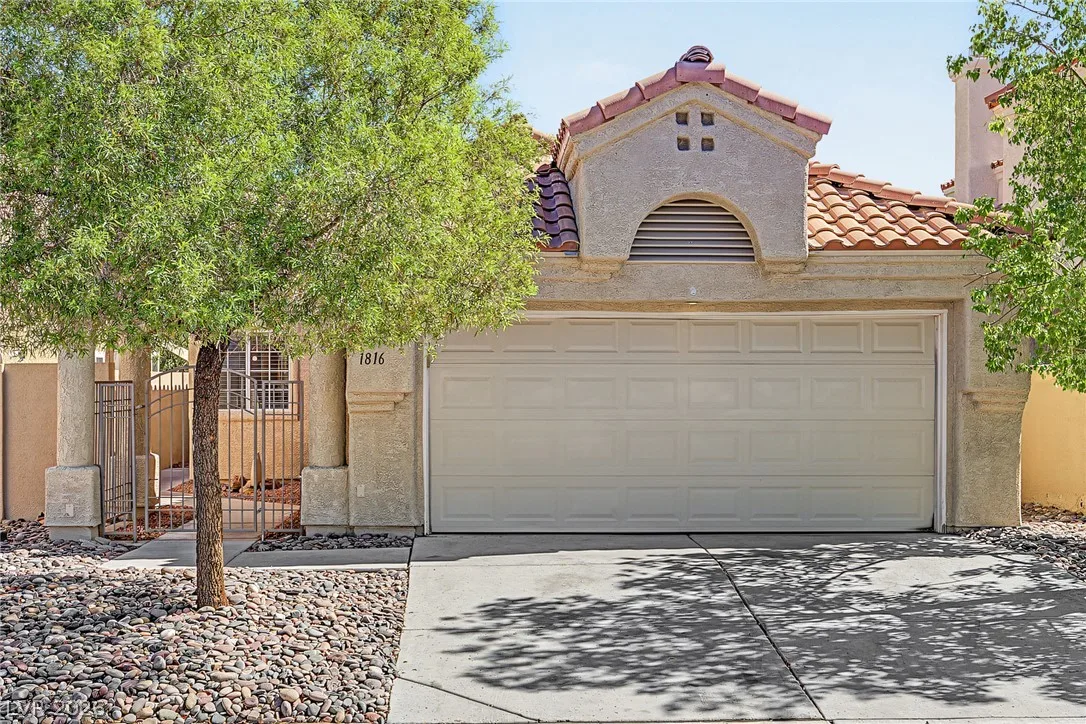
1816 Glenwillow DriveActive
$375,0002 bd2 ba1,268 sqft$296/sqft0.68 mi5 days
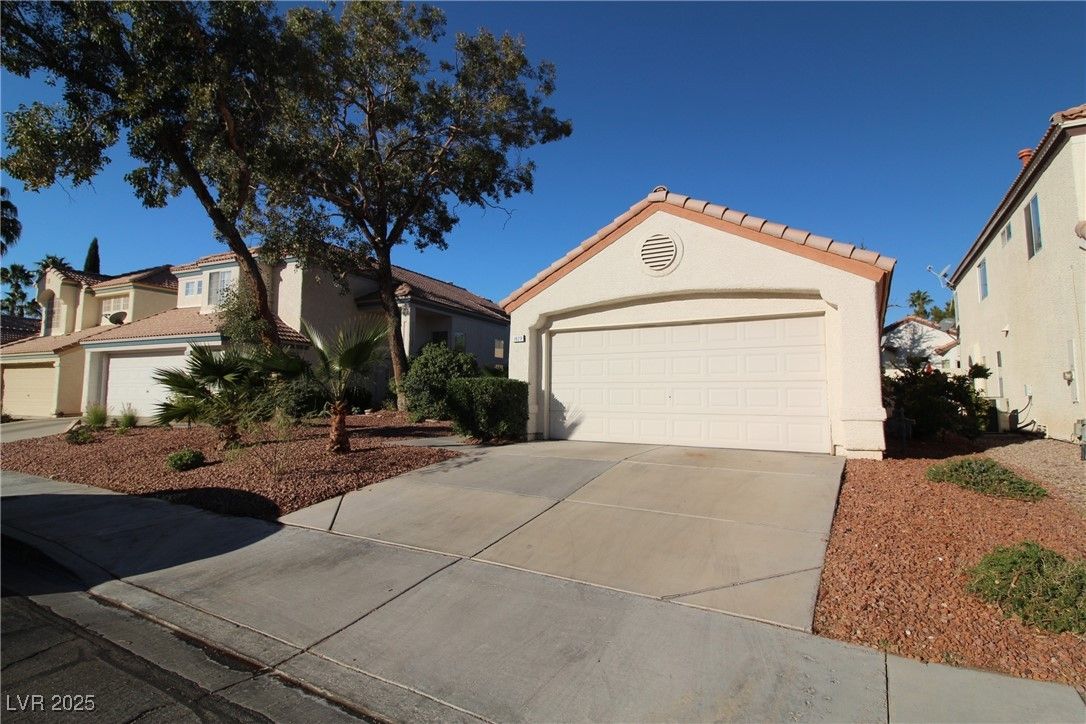
1629 British Cup DriveActive
$449,9003 bd2 ba1,259 sqft$357/sqft0.68 mi352 days
Nearest comparable sales and listings
12 comparables · median price $437,500 · range $333,000 – $458,000 · median $/sq ft $339 · average $/sq ft $326
| Address | Status | Price | $/Sq Ft | Bd / Ba | Sq Ft | Sold / market time | Distance |
|---|---|---|---|---|---|---|---|
| 9616 Kinlock Court | Sold | $370,000 | $346 | 2 / 2 | 1,070 | Sold 2026-10-02 | 0.06 mi |
| 2313 Diamondback Drive | Active | $419,990 | $283 | 3 / 2 | 1,485 | 91 days on market | 0.40 mi |
| 9765 Floweret Avenue | Sold | $450,000 | $341 | 3 / 2 | 1,321 | Sold 2026-06-04 | 0.55 mi |
| 9713 Peacock Hill Circle | Sold | $333,000 | $264 | 2 / 2 | 1,259 | Sold 2026-06-29 | 0.56 mi |
| 9713 Peacock Hill Circle | Sold | $430,000 | $342 | 3 / 2 | 1,259 | Sold 2026-09-25 | 0.56 mi |
| 9720 Ravine Avenue | Sold | $445,000 | $337 | 3 / 2 | 1,321 | Sold 2026-08-24 | 0.66 mi |
| 10191 Bentley Oaks Avenue | Active | $458,000 | $350 | 2 / 2 | 1,310 | 1 days on market | 0.67 mi |
| 3213 Oyster Bay Street | Active | $444,999 | $330 | 3 / 2 | 1,350 | 0 days on market | 0.68 mi |
| 1816 Glenwillow Drive | Active | $375,000 | $296 | 2 / 2 | 1,268 | 5 days on market | 0.68 mi |
| 1629 British Cup Drive | Active | $449,900 | $357 | 3 / 2 | 1,259 | 352 days on market | 0.68 mi |
| 2690 Wood Sorrel Street | Sold | $427,000 | $326 | 3 / 2 | 1,310 | Sold 2026-07-15 | 0.68 mi |
| 2665 Wood Sorrel Street | Active | $450,000 | $344 | 3 / 2 | 1,310 | 40 days on market | 0.71 mi |


