
Comparable Sales Near 1153 Mesa Verde Run, Mesquite, NV 89027
1st Realty · Comparable sales report · 1st.estate · October 21, 2026
Read the Mesquite area guide →
1153 Mesa Verde Run, Mesquite, NV 89027
Status: Sold
$389,000 Sold Price
$259
$ / Sq Ft
1,502
Living Area
5,227 sqft
Lot Size
2
Beds
2
Baths
2013
Year Built
Search Parameters
Property Type
Status
Radius
Sold Within
Beds
Baths
Living Area (Sq Ft)
Lot Size (Sq Ft)
This comp search reflects your current search parameters — adjust the filters above as needed for a more accurate estimate.
Estimated Value
—
Average $/Sqft
—
Check one or more comps below to calculate an estimate.
Nearest 10 of 12 comparable sales and listings within 1 mile of this home. Use the filters above and press Search to refine.
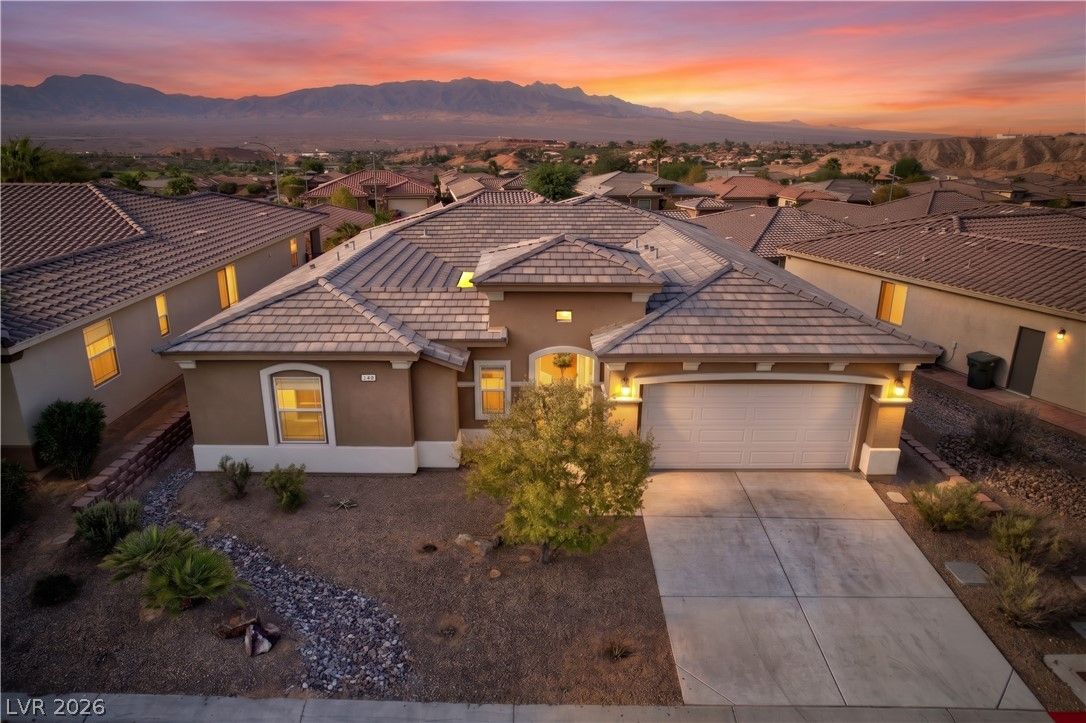
140 Admiral Benbow WayActive
$459,0003 bd3 ba1,868 sqft$246/sqft0.29 mi0 days
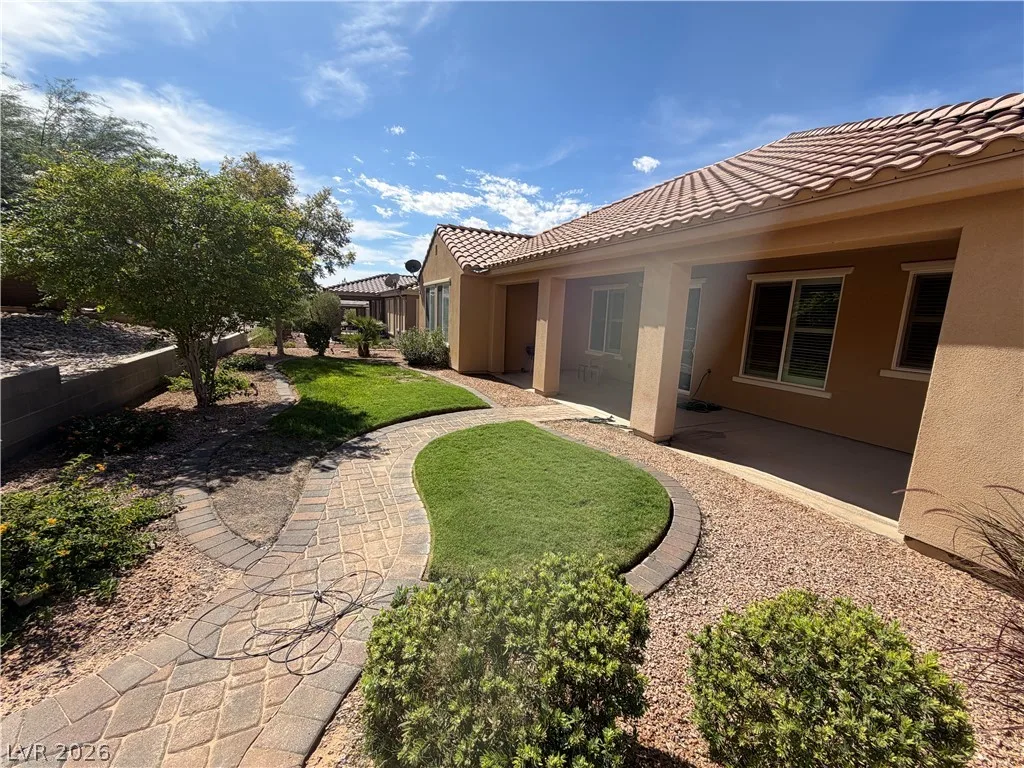
1230 Ivy Lee CrstActive
$415,0002 bd3 ba1,518 sqft$273/sqft0.34 mi0 days
$428,1003 bd3 ba1,830 sqft$234/sqft0.41 mi15 daysSold 2026-06-03
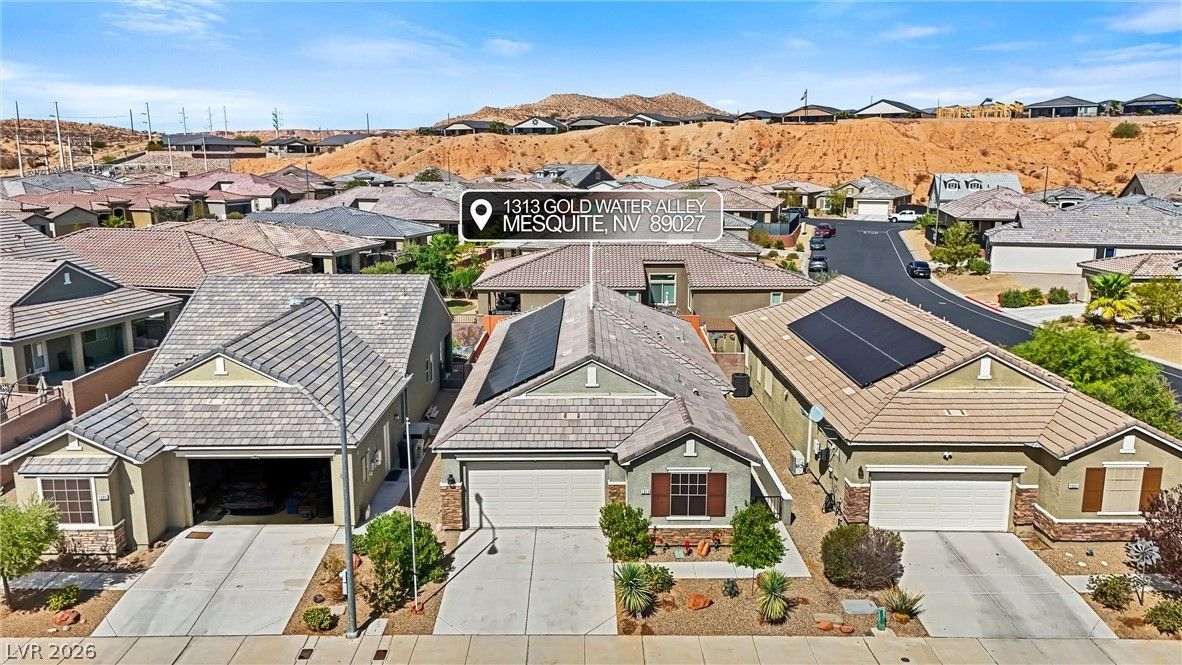
1313 Gold Water AlleyActive
$450,0003 bd2 ba1,813 sqft$248/sqft0.46 mi43 days
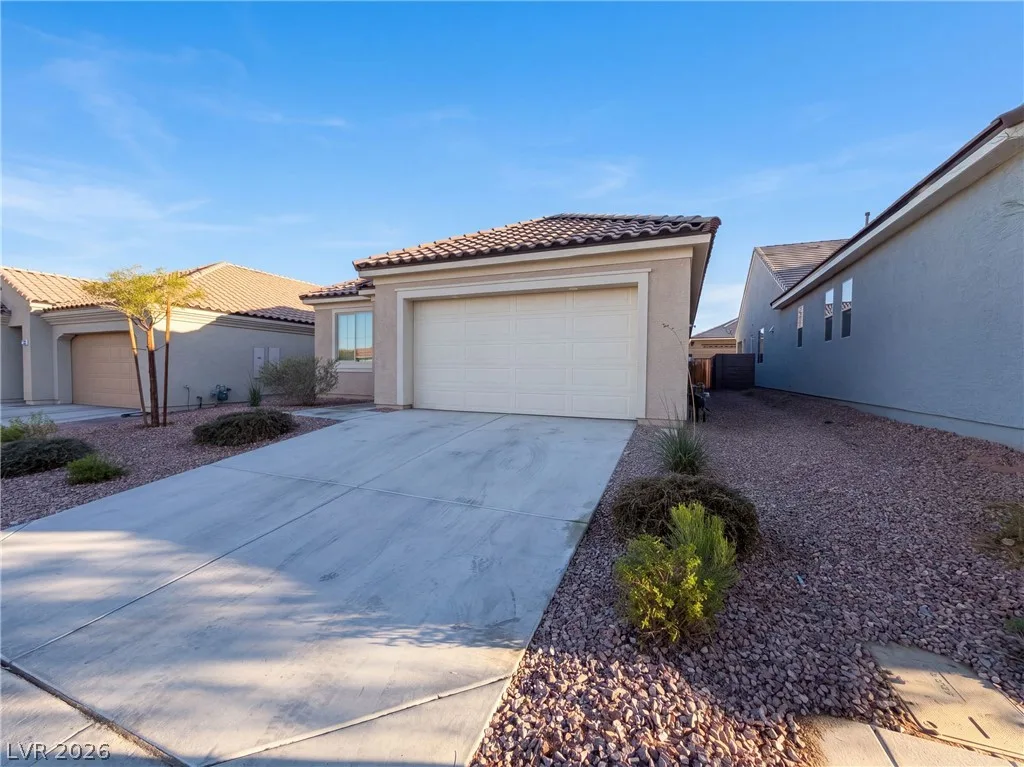
446 Royal Palms LaneActive
$383,0002 bd2 ba1,677 sqft$228/sqft0.49 mi0 days
475 Verbena LaneSold
$439,0003 bd3 ba1,833 sqft$239/sqft0.49 mi79 daysSold 2026-07-17
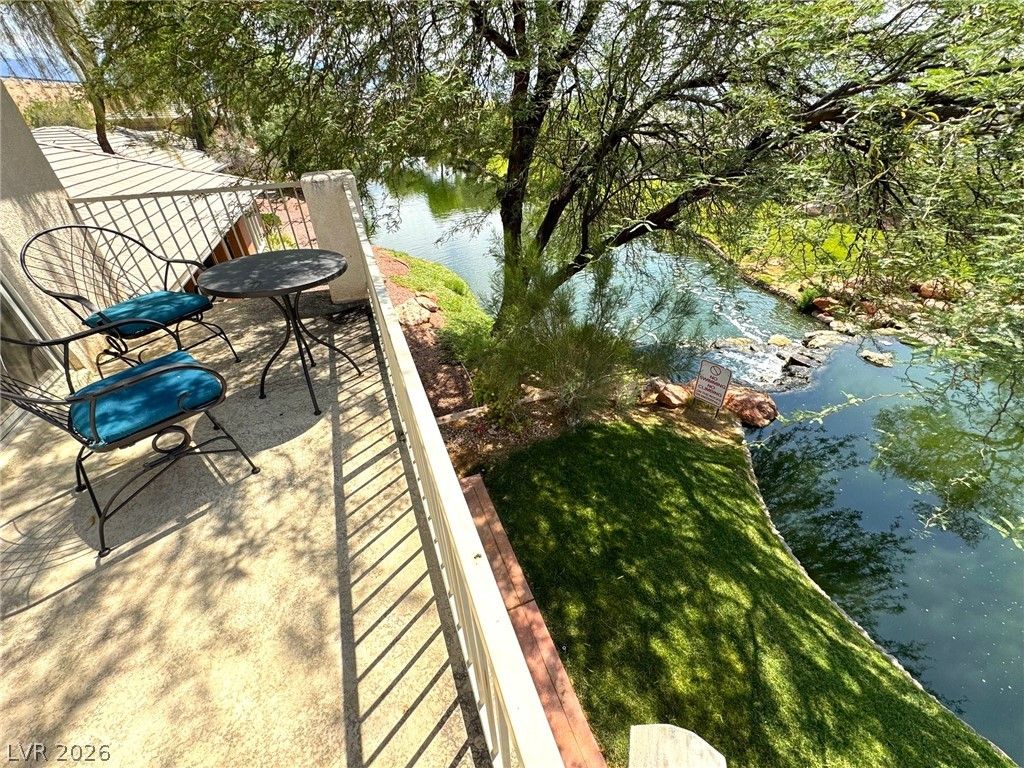
400 Paradise Parkway 105Active
$439,0003 bd3 ba1,605 sqft$274/sqft0.58 mi41 days
$311,0002 bd2 ba1,572 sqft$198/sqft0.58 mi0 daysSold 2026-05-28
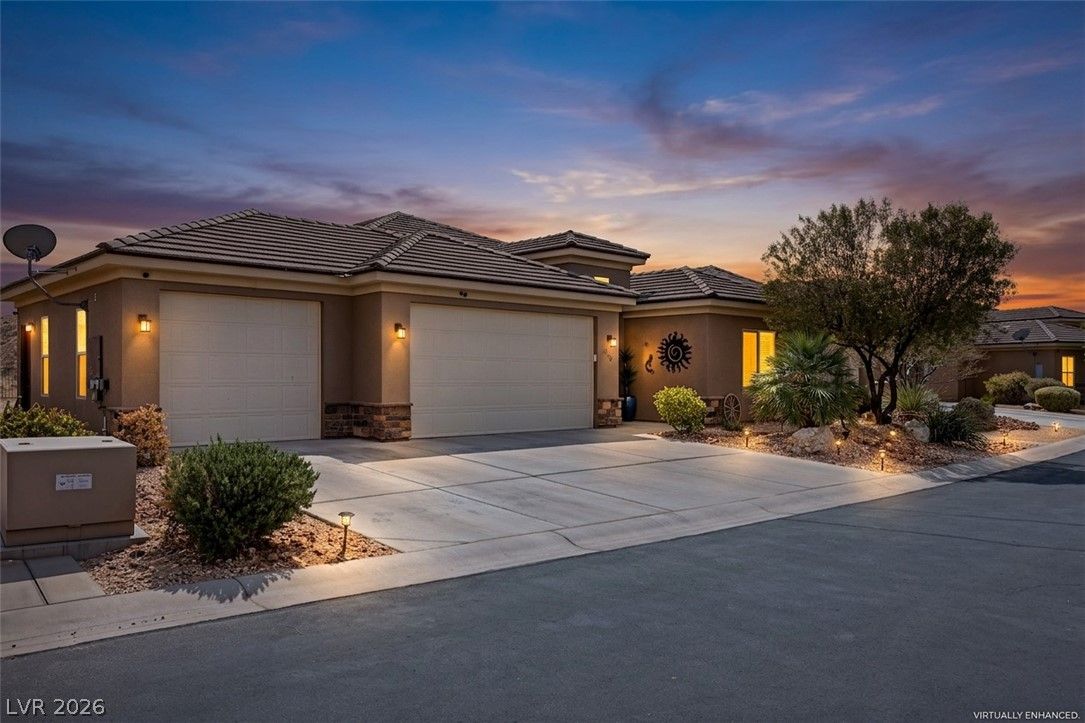
$400,0003 bd2 ba1,834 sqft$218/sqft0.78 mi0 daysSold 2026-07-28
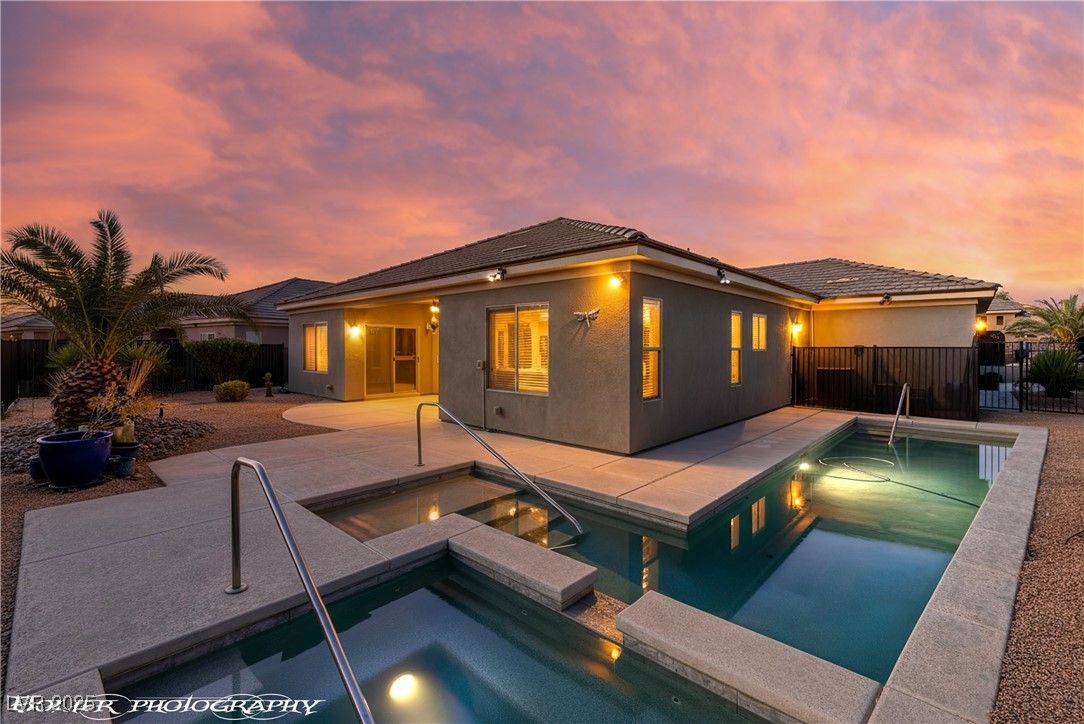
$447,5003 bd2 ba1,768 sqft$253/sqft0.78 mi189 daysSold 2026-08-07
Nearest comparable sales and listings
12 comparables · median price $424,050 · range $311,000 – $459,000 · median $/sq ft $247 · average $/sq ft $246
| Address | Status | Price | $/Sq Ft | Bd / Ba | Sq Ft | Sold / market time | Distance |
|---|---|---|---|---|---|---|---|
| 140 Admiral Benbow Way | Active | $459,000 | $246 | 3 / 3 | 1,868 | 0 days on market | 0.29 mi |
| 1230 Ivy Lee Crst | Active | $415,000 | $273 | 2 / 3 | 1,518 | 0 days on market | 0.34 mi |
| 1355 Huntington HTS Heights | Sold | $428,100 | $234 | 3 / 3 | 1,830 | Sold 2026-06-03 | 0.41 mi |
| 1313 Gold Water Alley | Active | $450,000 | $248 | 3 / 2 | 1,813 | 43 days on market | 0.46 mi |
| 446 Royal Palms Lane | Active | $383,000 | $228 | 2 / 2 | 1,677 | 0 days on market | 0.49 mi |
| 475 Verbena Lane | Sold | $439,000 | $239 | 3 / 3 | 1,833 | Sold 2026-07-17 | 0.49 mi |
| 400 Paradise Parkway 105 | Active | $439,000 | $274 | 3 / 3 | 1,605 | 41 days on market | 0.58 mi |
| 233 Pinnacle Court | Sold | $311,000 | $198 | 2 / 2 | 1,572 | Sold 2026-05-28 | 0.58 mi |
| 460 Wild Horse Lane | Sold | $400,000 | $218 | 3 / 2 | 1,834 | Sold 2026-07-28 | 0.78 mi |
| 456 Wild Horse Lane | Sold | $447,500 | $253 | 3 / 2 | 1,768 | Sold 2026-08-07 | 0.78 mi |
| 603 Coventry Lane | Active | $420,000 | $289 | 3 / 2 | 1,453 | 0 days on market | 0.86 mi |
| 547 Hamilton Drive | Sold | $395,000 | $255 | 2 / 2 | 1,551 | Sold 2026-04-30 | 0.89 mi |


