
Comparable Sales Near 2561 Pyramid Pines Drive, Henderson, NV 89052
1st Realty · Comparable sales report · 1st.estate · October 21, 2026
Read the Henderson area guide →
2561 Pyramid Pines Drive, Henderson, NV 89052
Status: Sold
$594,000 Sold Price
$302
$ / Sq Ft
1,968
Living Area
6,970 sqft
Lot Size
3
Beds
2
Baths
2002
Year Built
Search Parameters
Property Type
Status
Radius
Sold Within
Beds
Baths
Living Area (Sq Ft)
Lot Size (Sq Ft)
This comp search reflects your current search parameters — adjust the filters above as needed for a more accurate estimate.
Estimated Value
—
Average $/Sqft
—
Check one or more comps below to calculate an estimate.
Nearest 10 of 27 comparable sales and listings within 1 mile of this home. Use the filters above and press Search to refine.
$765,0004 bd3 ba2,160 sqft$354/sqft0.17 mi5 daysSold 2026-06-30
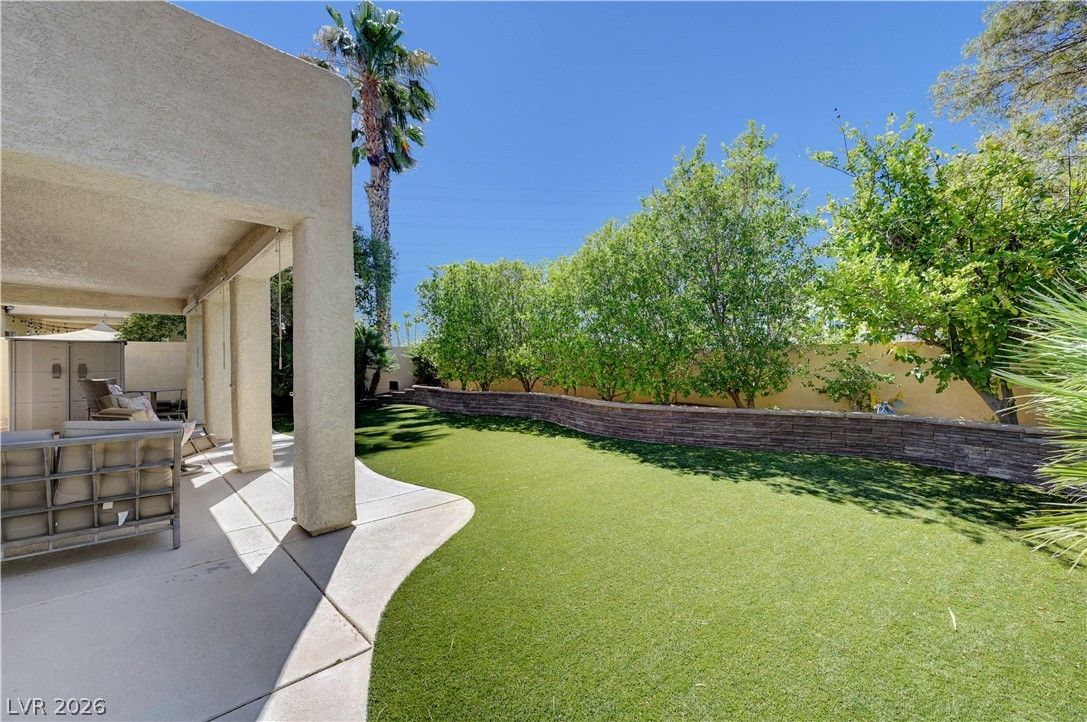
271 Fair Play StSold
$592,5003 bd2 ba1,950 sqft$304/sqft0.17 mi16 daysSold 2026-08-26
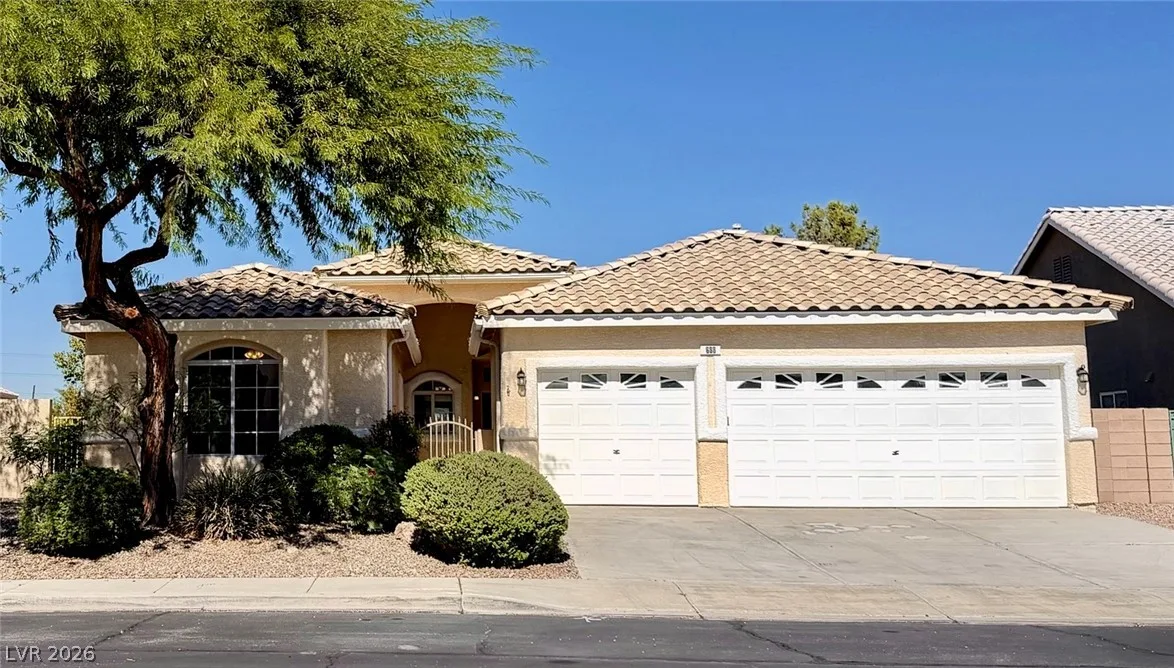
688 Vineland AvenueActive
$645,0003 bd3 ba2,433 sqft$265/sqft0.24 mi0 days
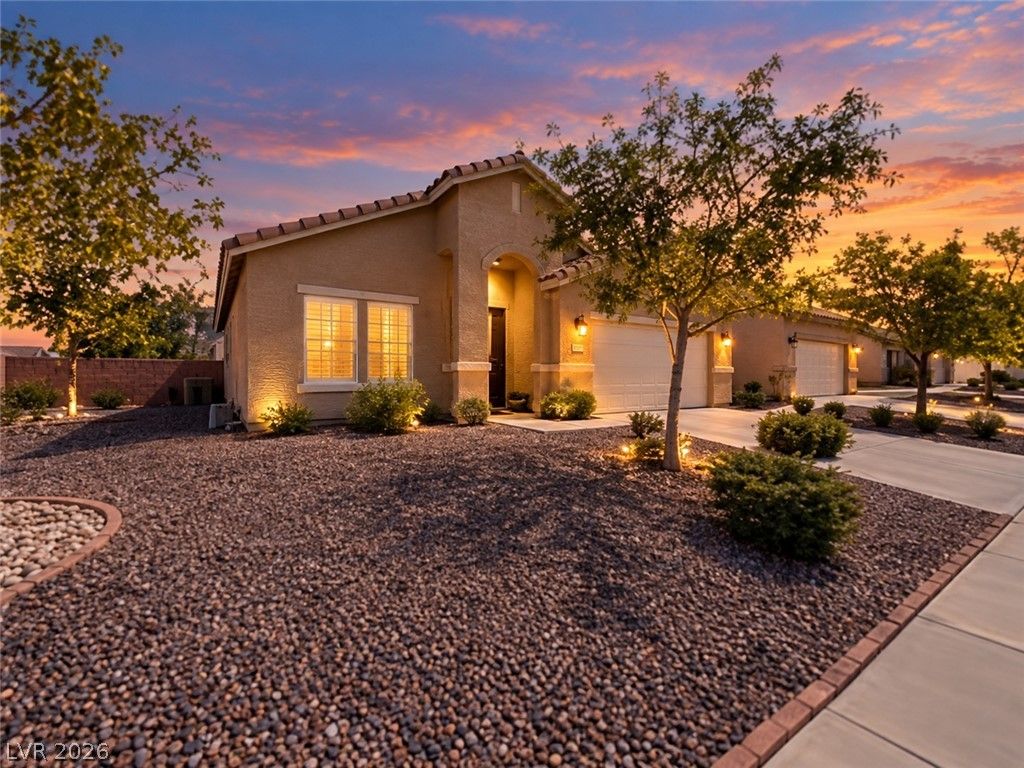
500 Red Shale CourtActive
$525,0003 bd2 ba1,672 sqft$314/sqft0.42 mi26 days
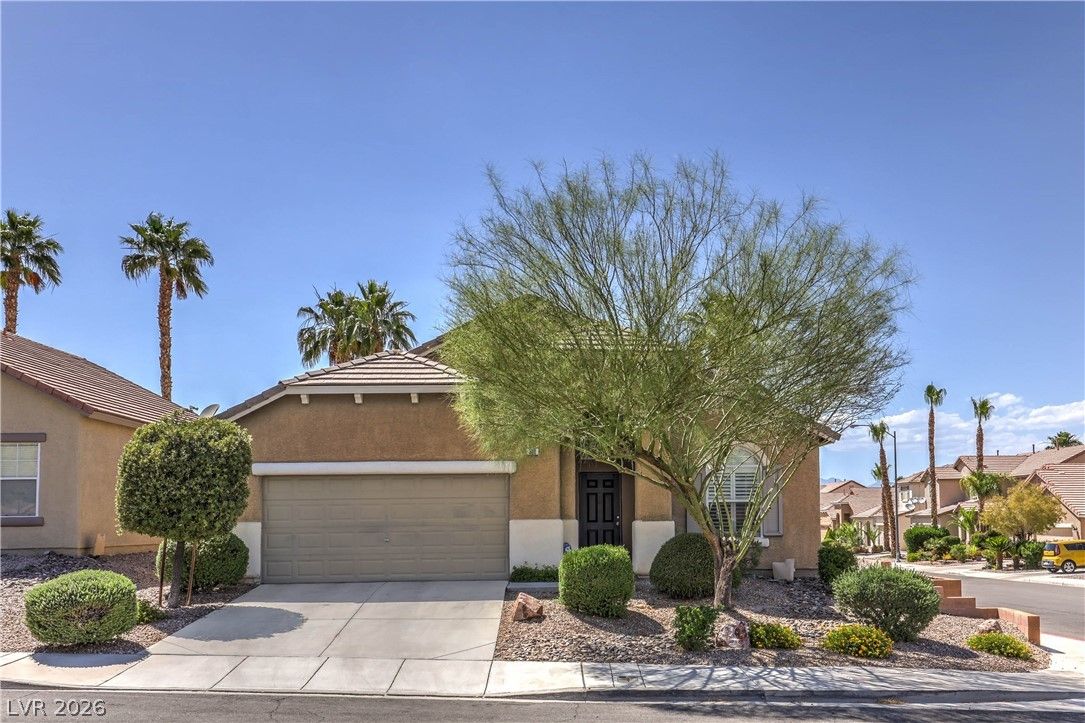
$499,5003 bd2 ba1,672 sqft$299/sqft0.44 mi49 daysSold 2026-07-24
$635,0003 bd2 ba2,084 sqft$305/sqft0.52 mi59 daysSold 2026-04-28
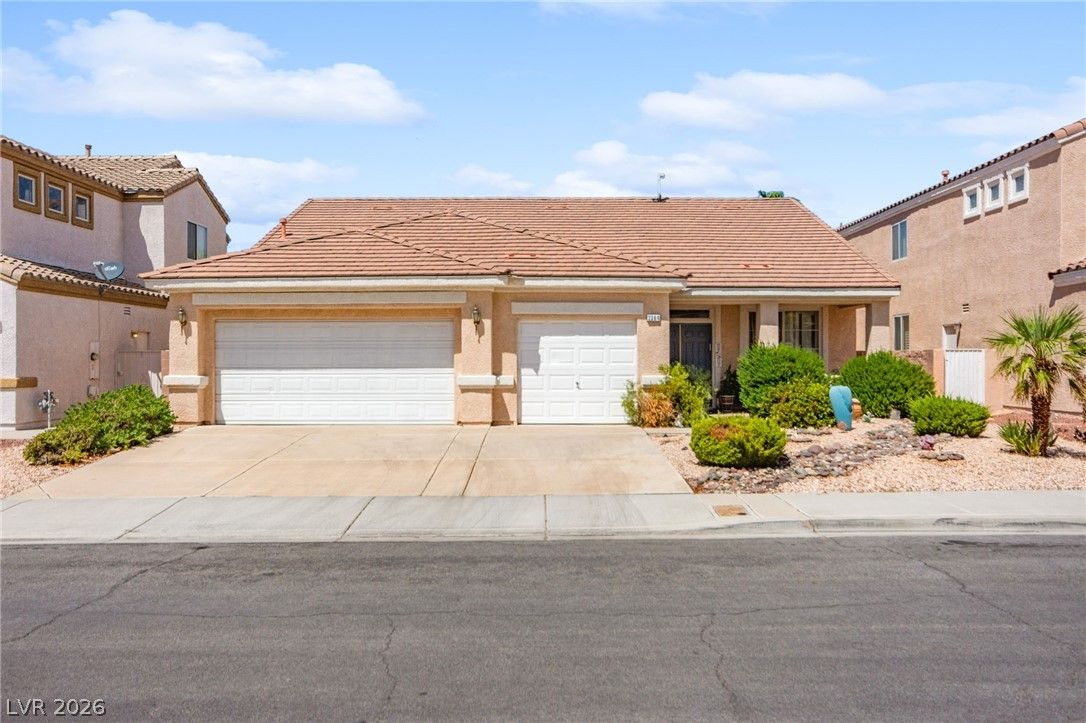
2364 Kenneth AvenueActive
$550,0004 bd2 ba2,084 sqft$264/sqft0.55 mi0 days
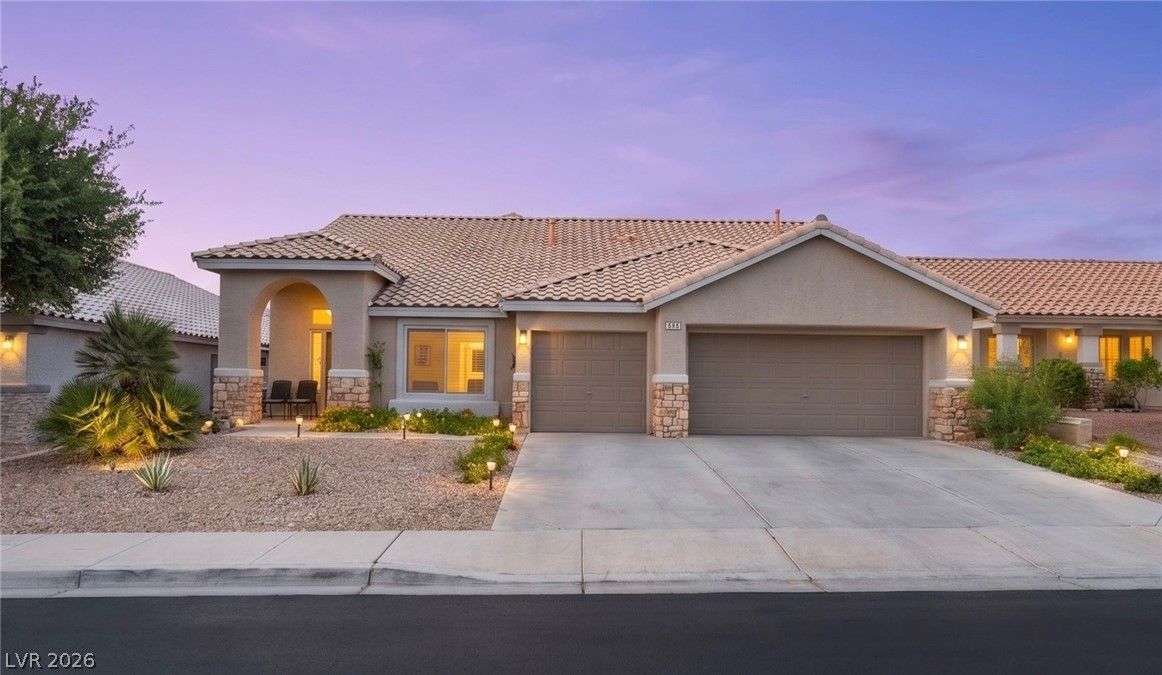
686 Pansy PlaceSold
$667,7504 bd2 ba2,101 sqft$318/sqft0.55 mi107 daysSold 2026-08-26
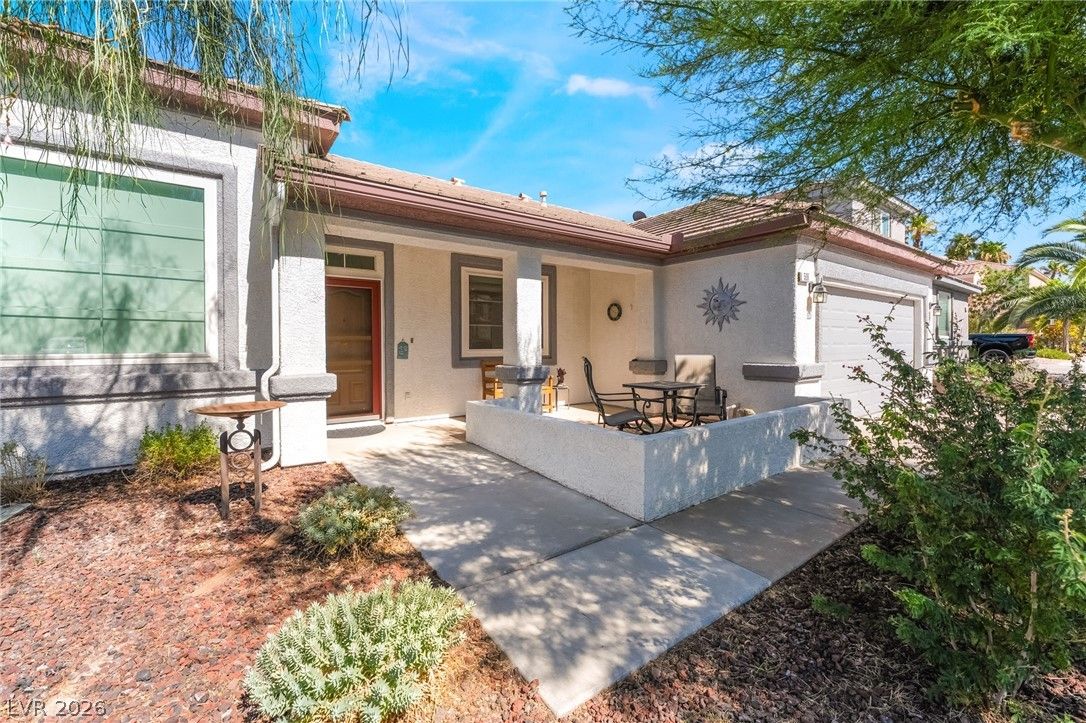
506 Short Crest CourtActive
$599,9993 bd2 ba1,810 sqft$331/sqft0.57 mi41 days
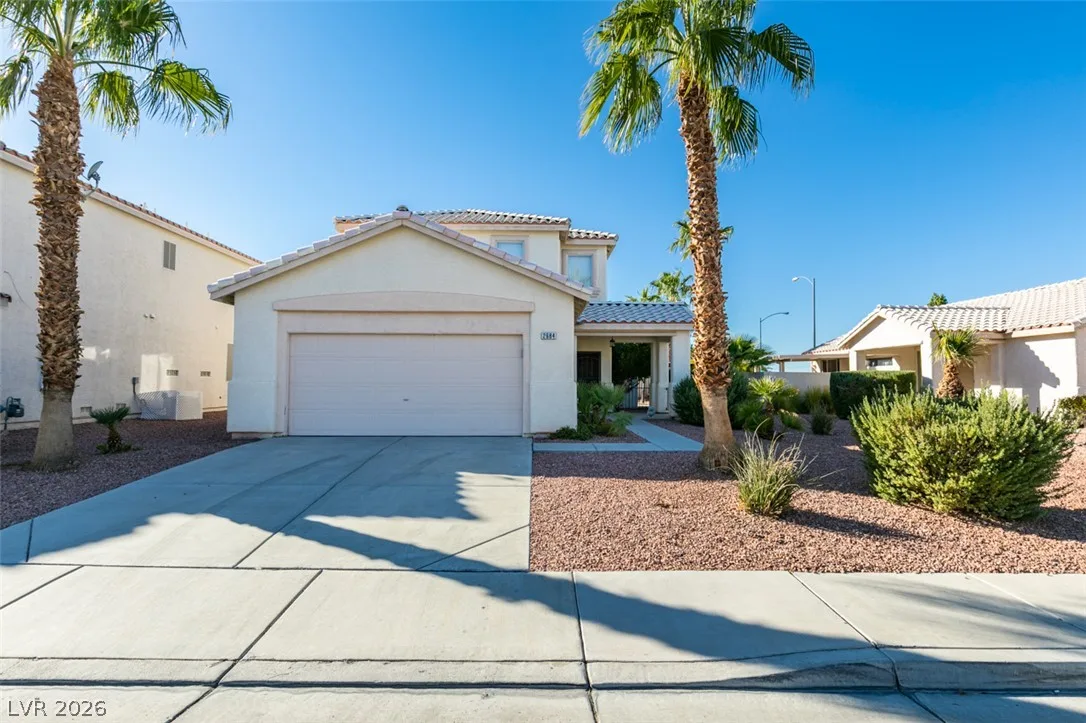
2684 Park Creek LaneActive
$499,9993 bd3 ba1,779 sqft$281/sqft0.62 mi19 days
Nearest comparable sales and listings
12 comparables · median price $596,250 · range $469,000 – $765,000 · median $/sq ft $304 · average $/sq ft $301
| Address | Status | Price | $/Sq Ft | Bd / Ba | Sq Ft | Sold / market time | Distance |
|---|---|---|---|---|---|---|---|
| 264 Fair Play Street | Sold | $765,000 | $354 | 4 / 3 | 2,160 | Sold 2026-06-30 | 0.17 mi |
| 271 Fair Play St | Sold | $592,500 | $304 | 3 / 2 | 1,950 | Sold 2026-08-26 | 0.17 mi |
| 688 Vineland Avenue | Active | $645,000 | $265 | 3 / 3 | 2,433 | 0 days on market | 0.24 mi |
| 500 Red Shale Court | Active | $525,000 | $314 | 3 / 2 | 1,672 | 26 days on market | 0.42 mi |
| 568 Broken Shale Circle | Sold | $499,500 | $299 | 3 / 2 | 1,672 | Sold 2026-07-24 | 0.44 mi |
| 2344 Teton Ranch Avenue | Sold | $635,000 | $305 | 3 / 2 | 2,084 | Sold 2026-04-28 | 0.52 mi |
| 2364 Kenneth Avenue | Active | $550,000 | $264 | 4 / 2 | 2,084 | 0 days on market | 0.55 mi |
| 686 Pansy Place | Sold | $667,750 | $318 | 4 / 2 | 2,101 | Sold 2026-08-26 | 0.55 mi |
| 506 Short Crest Court | Active | $599,999 | $331 | 3 / 2 | 1,810 | 41 days on market | 0.57 mi |
| 2684 Park Creek Lane | Active | $499,999 | $281 | 3 / 3 | 1,779 | 19 days on market | 0.62 mi |
| 2246 Alanhurst Drive | Active | $670,000 | $331 | 3 / 2 | 2,026 | 32 days on market | 0.66 mi |
| 9234 Kingston Road | Sold | $469,000 | $244 | 3 / 2 | 1,924 | Sold 2026-09-17 | 0.67 mi |


