
Comparable Sales Near 10557 Shoalhaven Drive, Las Vegas, NV 89134
1st Realty · Comparable sales report · 1st.estate · October 20, 2026
Read the Sun City Summerlin neighborhood guide →
10557 Shoalhaven Drive, Las Vegas, NV 89134
Status: Sold
$690,000 Sold Price
$454
$ / Sq Ft
1,520
Living Area
7,405 sqft
Lot Size
2
Beds
2
Baths
1998
Year Built
Search Parameters
Property Type
Status
Radius
Sold Within
Beds
Baths
Living Area (Sq Ft)
Lot Size (Sq Ft)
This comp search reflects your current search parameters — adjust the filters above as needed for a more accurate estimate.
Estimated Value
—
Average $/Sqft
—
Check one or more comps below to calculate an estimate.
Nearest 10 of 120 comparable sales and listings within 1 mile of this home. Use the filters above and press Search to refine.
$455,0002 bd2 ba1,533 sqft$297/sqft0.04 mi42 daysSold 2026-05-01
$495,0002 bd2 ba1,703 sqft$291/sqft0.07 mi137 daysSold 2026-07-07
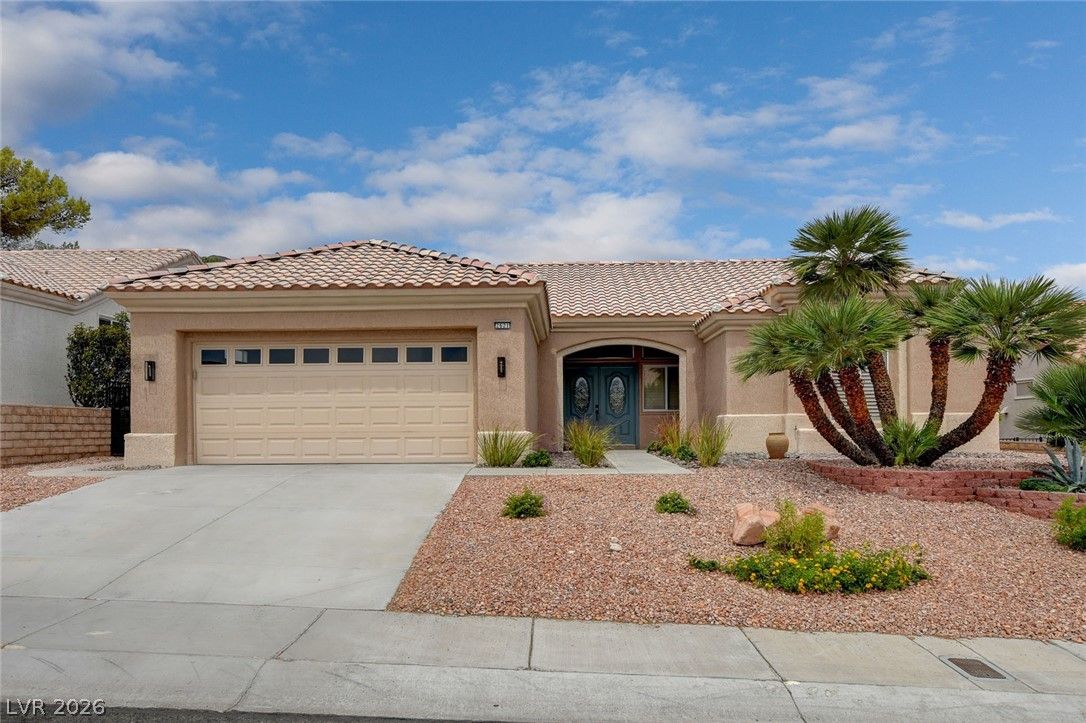
2621 Hanging Rock DrivePending
$623,9002 bd2 ba1,703 sqft$366/sqft0.11 mi55 days
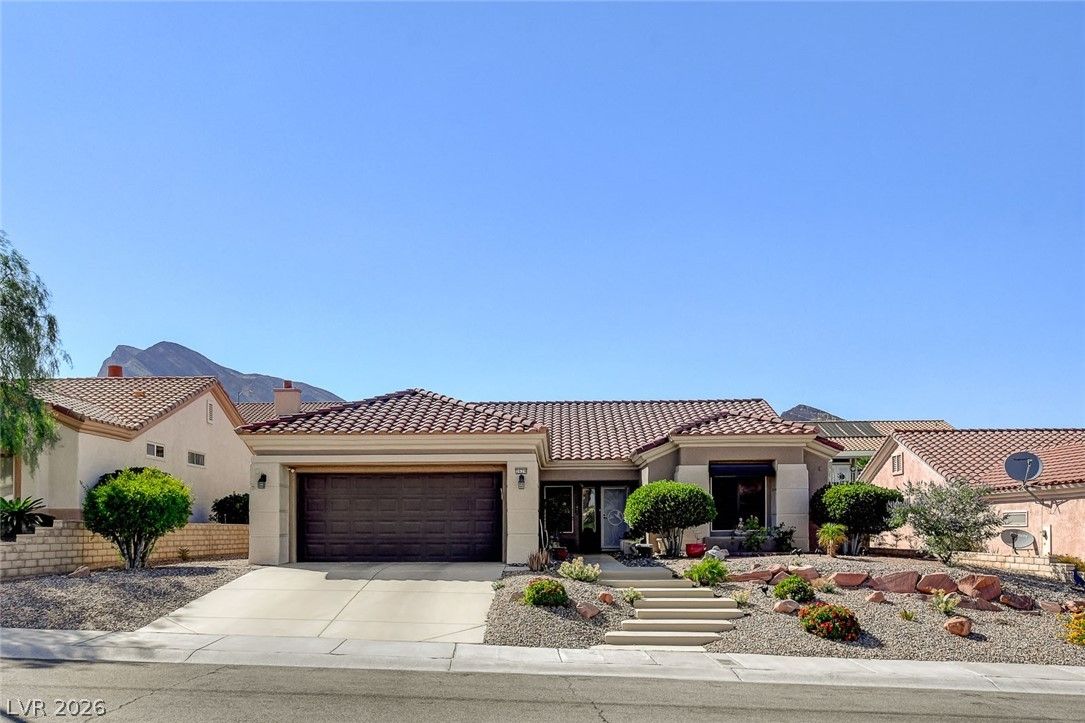
$436,5002 bd2 ba1,668 sqft$262/sqft0.13 mi32 daysSold 2026-07-30
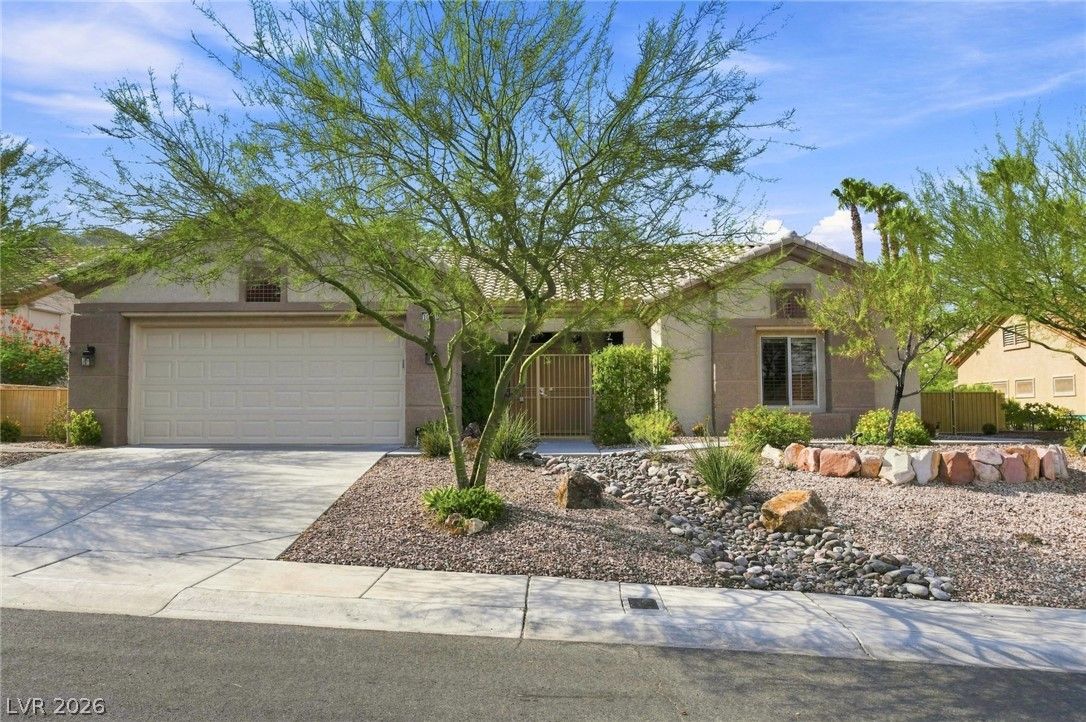
10612 Clear Meadows DrivePending
$525,0002 bd2 ba1,703 sqft$308/sqft0.16 mi40 days
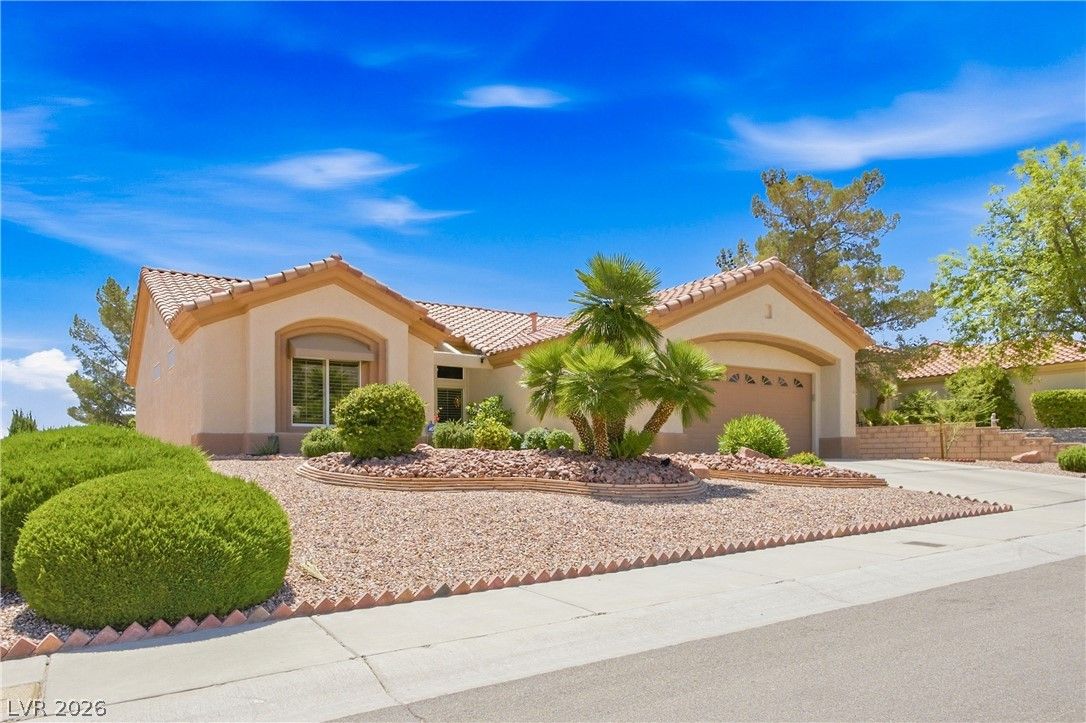
$439,0002 bd2 ba1,533 sqft$286/sqft0.19 mi41 daysSold 2026-08-21
$416,0002 bd2 ba1,388 sqft$300/sqft0.21 mi37 daysSold 2026-05-20
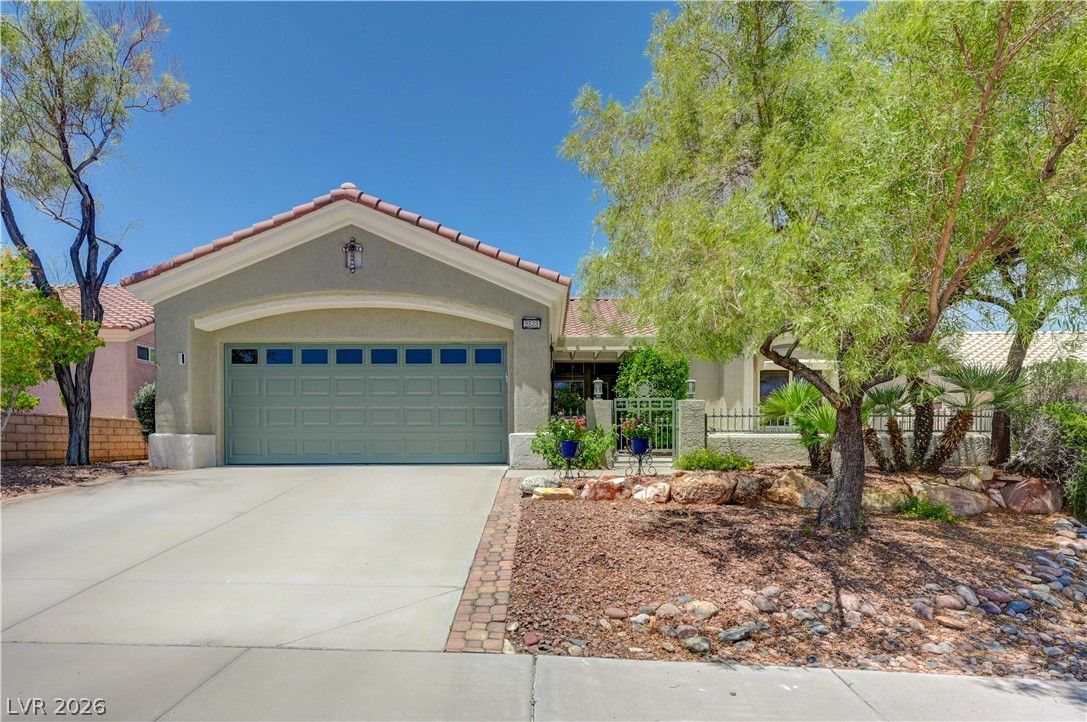
2533 Banora Point DriveUnder Contract
$499,0002 bd2 ba1,816 sqft$275/sqft0.24 mi109 days
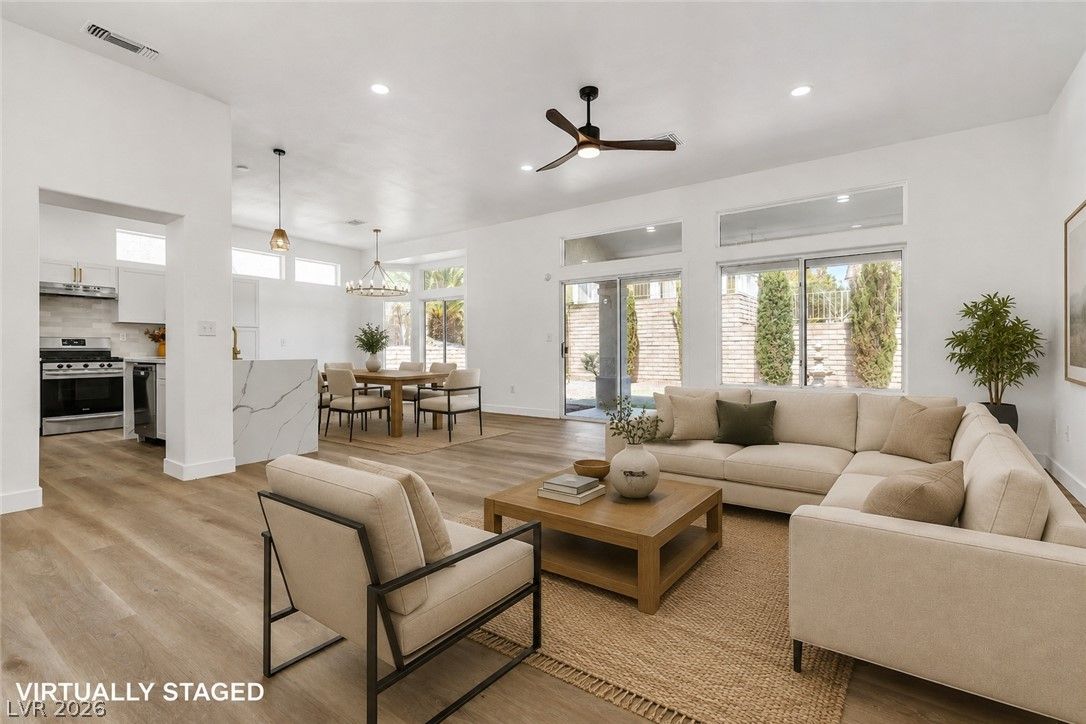
10636 Argents Hill DriveActive
$499,4002 bd2 ba1,533 sqft$326/sqft0.25 mi69 days
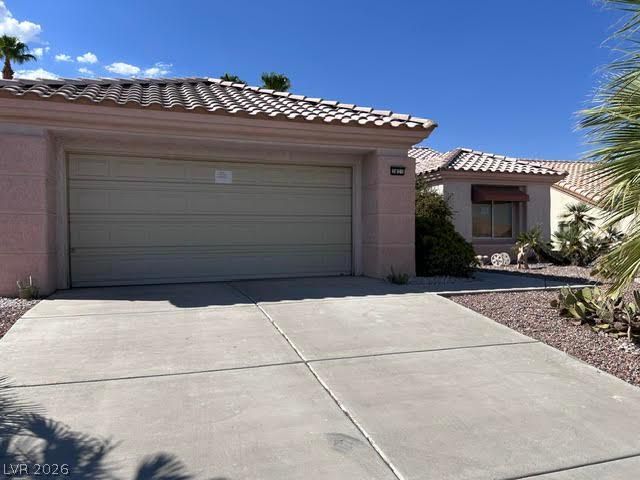
2821 Hanging Rock DriveActive
$369,9002 bd2 ba1,165 sqft$318/sqft0.25 mi53 days
Nearest comparable sales and listings
12 comparables · median price $497,000 · range $369,900 – $885,000 · median $/sq ft $304 · average $/sq ft $321
| Address | Status | Price | $/Sq Ft | Bd / Ba | Sq Ft | Sold / market time | Distance |
|---|---|---|---|---|---|---|---|
| 2601 Hope Forest Drive | Sold | $455,000 | $297 | 2 / 2 | 1,533 | Sold 2026-05-01 | 0.04 mi |
| 2613 Hope Forest Drive | Sold | $495,000 | $291 | 2 / 2 | 1,703 | Sold 2026-07-07 | 0.07 mi |
| 2621 Hanging Rock Drive | Pending | $623,900 | $366 | 2 / 2 | 1,703 | 55 days on market | 0.11 mi |
| 2629 Hanging Rock Drive | Sold | $436,500 | $262 | 2 / 2 | 1,668 | Sold 2026-07-30 | 0.13 mi |
| 10612 Clear Meadows Drive | Pending | $525,000 | $308 | 2 / 2 | 1,703 | 40 days on market | 0.16 mi |
| 2800 Hanging Rock Drive | Sold | $439,000 | $286 | 2 / 2 | 1,533 | Sold 2026-08-21 | 0.19 mi |
| 10724 Paradise Point Drive | Sold | $416,000 | $300 | 2 / 2 | 1,388 | Sold 2026-05-20 | 0.21 mi |
| 2533 Banora Point Drive | Under Contract | $499,000 | $275 | 2 / 2 | 1,816 | 109 days on market | 0.24 mi |
| 10636 Argents Hill Drive | Active | $499,400 | $326 | 2 / 2 | 1,533 | 69 days on market | 0.25 mi |
| 2821 Hanging Rock Drive | Active | $369,900 | $318 | 2 / 2 | 1,165 | 53 days on market | 0.25 mi |
| 10701 Back Plains Drive | Pending | $629,999 | $347 | 3 / 2 | 1,815 | 33 days on market | 0.25 mi |
| 10720 Back Plains Drive | Sold | $885,000 | $480 | 2 / 2 | 1,842 | Sold 2026-05-13 | 0.26 mi |


