
Comparable Sales Near 1024 Fishing Street, Henderson, NV 89011
1st Realty · Comparable sales report · 1st.estate · October 20, 2026
Read the Henderson area guide →
1024 Fishing Street, Henderson, NV 89011
Status: Sold
$422,000 Sold Price
$315
$ / Sq Ft
1,340
Living Area
5,227 sqft
Lot Size
3
Beds
2
Baths
2011
Year Built
Search Parameters
Property Type
Status
Radius
Sold Within
Beds
Baths
Living Area (Sq Ft)
Lot Size (Sq Ft)
This comp search reflects your current search parameters — adjust the filters above as needed for a more accurate estimate.
Estimated Value
—
Average $/Sqft
—
Check one or more comps below to calculate an estimate.
Nearest 10 of 15 comparable sales and listings within 1 mile of this home. Use the filters above and press Search to refine.
$395,0003 bd2 ba1,297 sqft$305/sqft0.06 mi41 daysSold 2026-05-13
$447,5003 bd2 ba1,489 sqft$301/sqft0.06 mi19 daysSold 2026-06-22
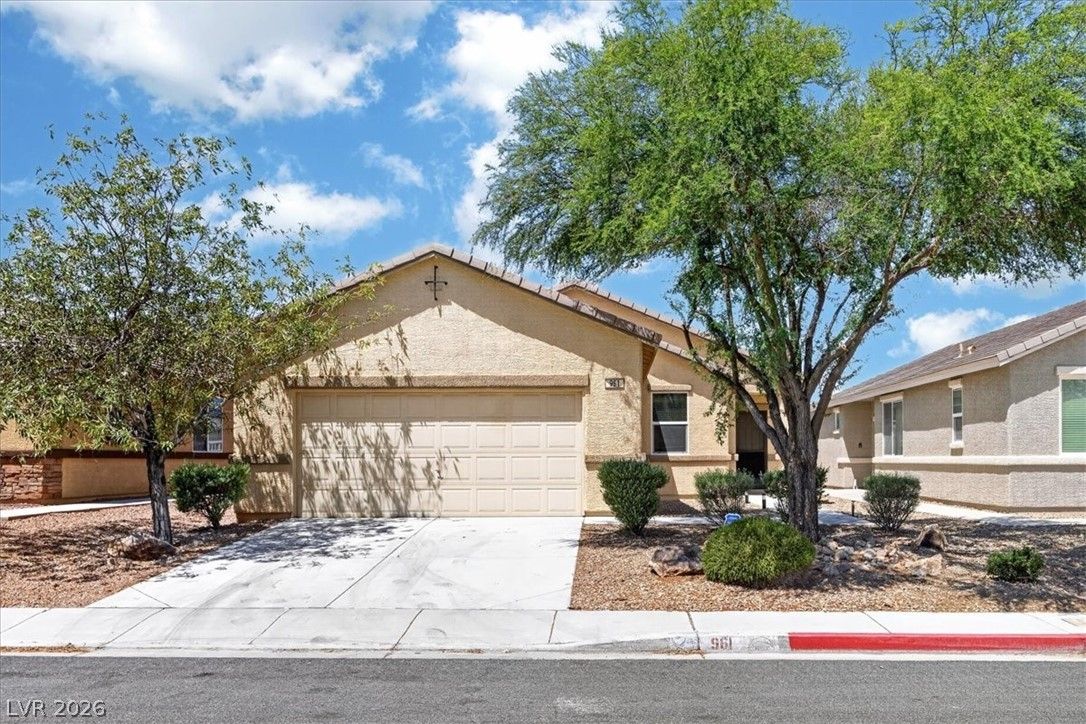
961 Aspen Cliff DriveActive
$399,9003 bd2 ba1,340 sqft$298/sqft0.09 mi133 days
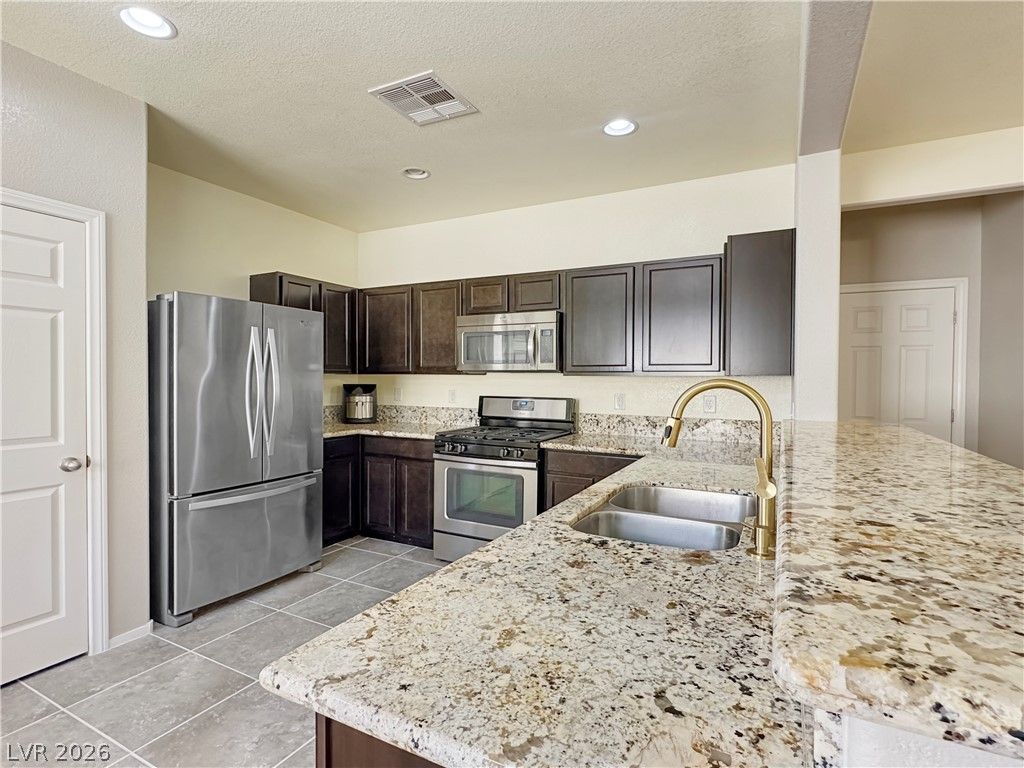
976 Aspen Cliff DriveActive
$394,9003 bd2 ba1,340 sqft$295/sqft0.09 mi171 days
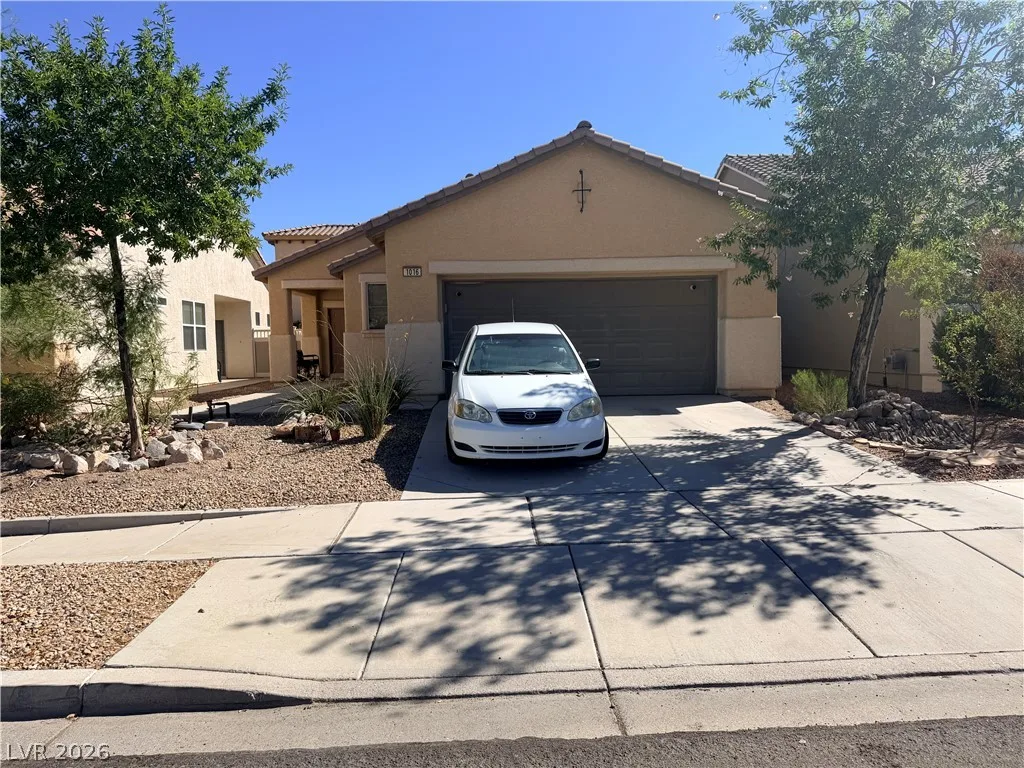
1016 Aspen Cliff DriveActive
$356,6803 bd2 ba1,297 sqft$275/sqft0.10 mi10 days
$422,0003 bd2 ba1,489 sqft$283/sqft0.11 mi26 daysSold 2026-04-29
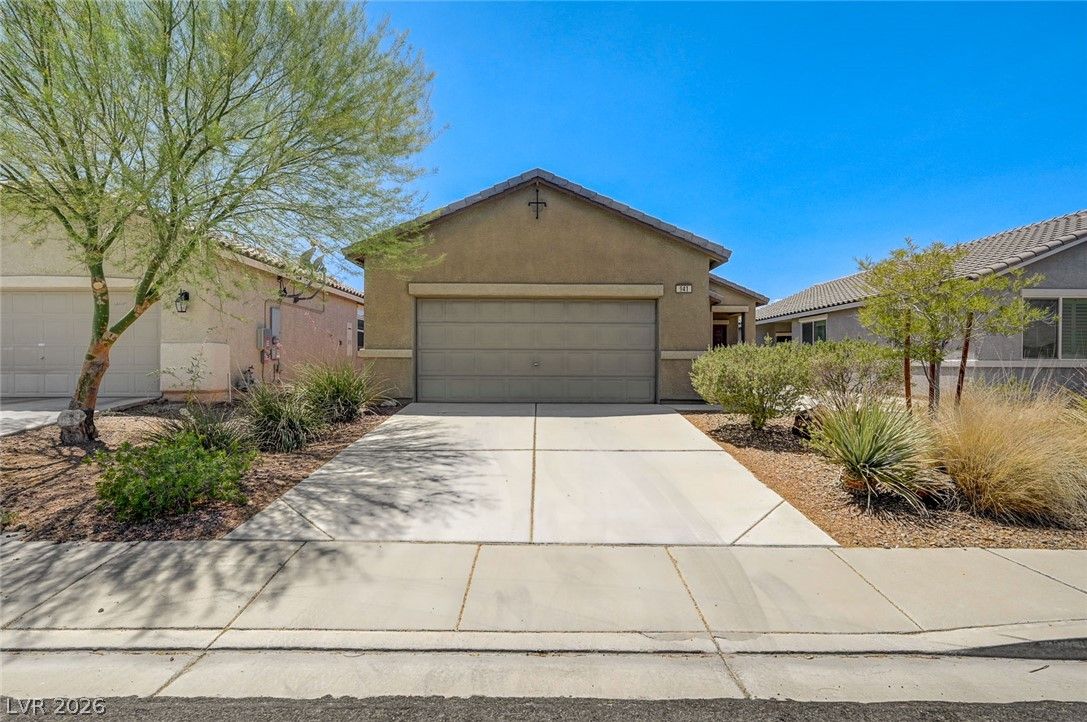
$385,0003 bd2 ba1,340 sqft$287/sqft0.12 mi17 daysSold 2026-08-07
$395,0003 bd2 ba1,340 sqft$295/sqft0.14 mi61 daysSold 2026-06-23
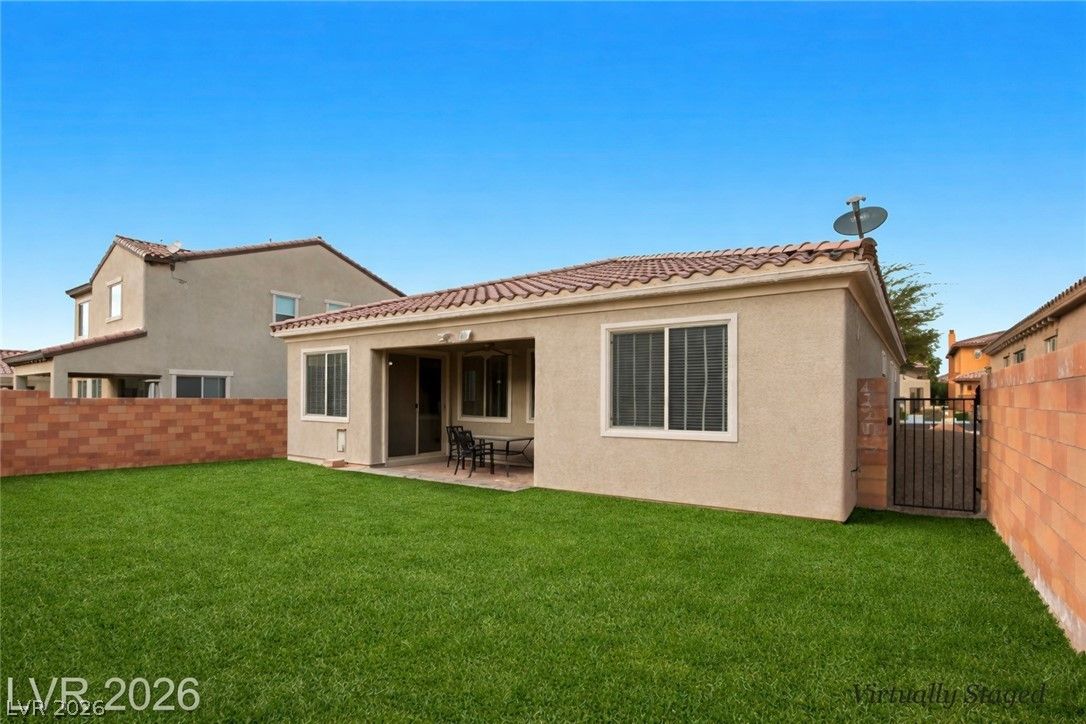
1273 Olivia ParkwayActive
$515,0003 bd2 ba1,674 sqft$308/sqft0.69 mi156 days
$475,0003 bd2 ba1,609 sqft$295/sqft0.72 mi9 daysSold 2026-05-04
Nearest comparable sales and listings
12 comparables · median price $410,950 · range $356,680 – $520,000 · median $/sq ft $297 · average $/sq ft $298
| Address | Status | Price | $/Sq Ft | Bd / Ba | Sq Ft | Sold / market time | Distance |
|---|---|---|---|---|---|---|---|
| 1053 Fishing Street | Sold | $395,000 | $305 | 3 / 2 | 1,297 | Sold 2026-05-13 | 0.06 mi |
| 169 Canyon Blue Avenue | Sold | $447,500 | $301 | 3 / 2 | 1,489 | Sold 2026-06-22 | 0.06 mi |
| 961 Aspen Cliff Drive | Active | $399,900 | $298 | 3 / 2 | 1,340 | 133 days on market | 0.09 mi |
| 976 Aspen Cliff Drive | Active | $394,900 | $295 | 3 / 2 | 1,340 | 171 days on market | 0.09 mi |
| 1016 Aspen Cliff Drive | Active | $356,680 | $275 | 3 / 2 | 1,297 | 10 days on market | 0.10 mi |
| 1076 Crescent Falls Street | Sold | $422,000 | $283 | 3 / 2 | 1,489 | Sold 2026-04-29 | 0.11 mi |
| 941 Aspen Cliff Drive | Sold | $385,000 | $287 | 3 / 2 | 1,340 | Sold 2026-08-07 | 0.12 mi |
| 940 Aspen Cliff Drive | Sold | $395,000 | $295 | 3 / 2 | 1,340 | Sold 2026-06-23 | 0.14 mi |
| 1273 Olivia Parkway | Active | $515,000 | $308 | 3 / 2 | 1,674 | 156 days on market | 0.69 mi |
| 1040 Via Camelia Street | Sold | $475,000 | $295 | 3 / 2 | 1,609 | Sold 2026-05-04 | 0.72 mi |
| 689 Monteverdi Peak Street | Active | $520,000 | $313 | 3 / 2 | 1,662 | 13 days on market | 0.87 mi |
| 985 Via Canale Drive | Sold | $440,000 | $322 | 2 / 2 | 1,368 | Sold 2026-05-06 | 0.94 mi |


