
Comparable Sales Near 2119 DEL AQUA Avenue, Henderson, NV 89002
1st Realty · Comparable sales report · 1st.estate · October 20, 2026
Read the Henderson area guide →
2119 DEL AQUA Avenue, Henderson, NV 89002
Status: Sold
$2,325 Sold Price
$1
$ / Sq Ft
2,040
Living Area
4,792 sqft
Lot Size
4
Beds
3
Baths
2018
Year Built
Search Parameters
Property Type
Status
Radius
Sold Within
Beds
Baths
Living Area (Sq Ft)
Lot Size (Sq Ft)
This comp search reflects your current search parameters — adjust the filters above as needed for a more accurate estimate.
Estimated Value
—
Average $/Sqft
—
Check one or more comps below to calculate an estimate.
Nearest 10 of 14 comparable sales and listings within 1 mile of this home. Use the filters above and press Search to refine.
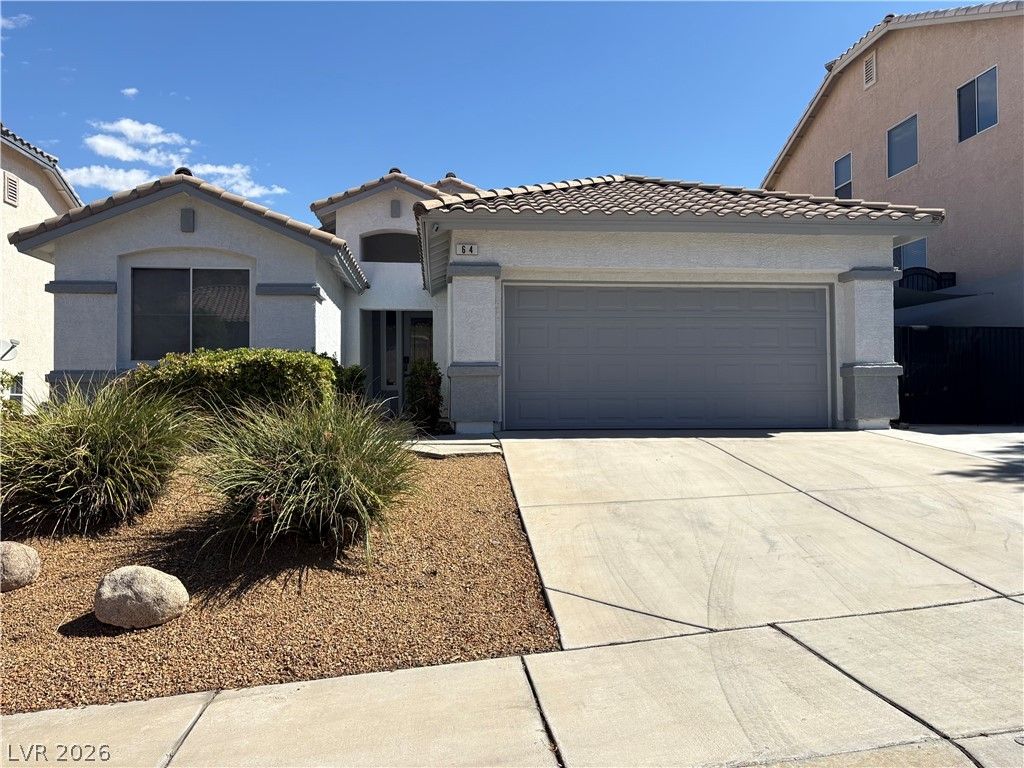
64 Blaven DriveActive
$535,0003 bd2 ba1,767 sqft$303/sqft0.70 mi5 days
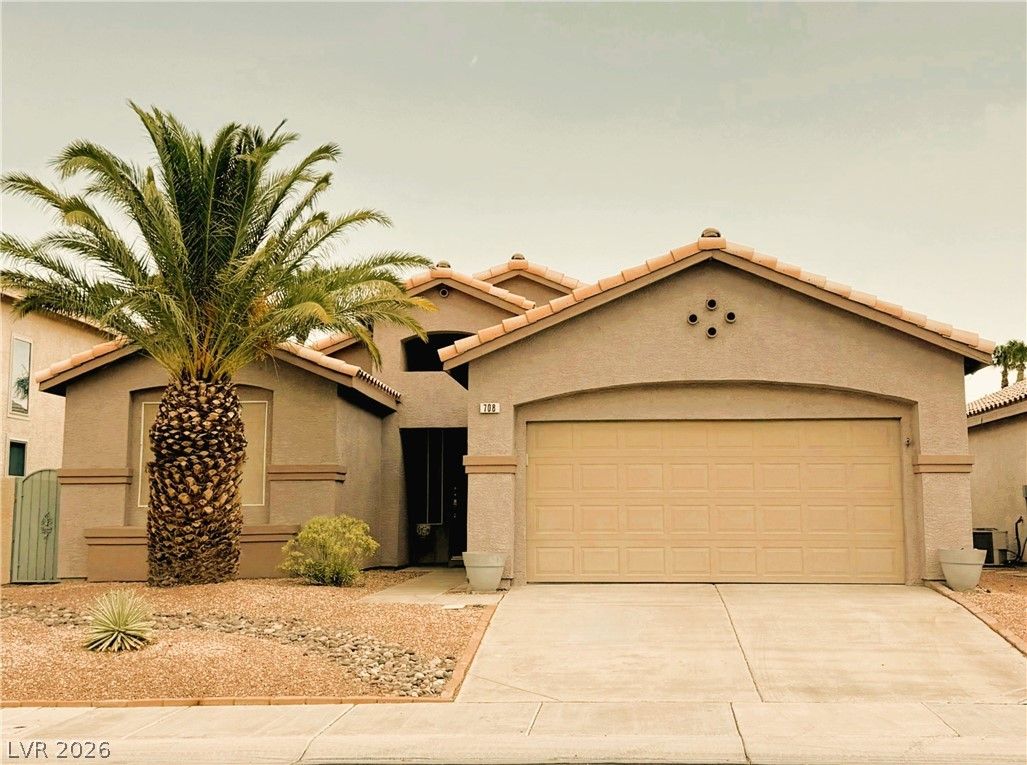
$518,5003 bd2 ba1,673 sqft$310/sqft0.73 mi66 daysSold 2026-09-17
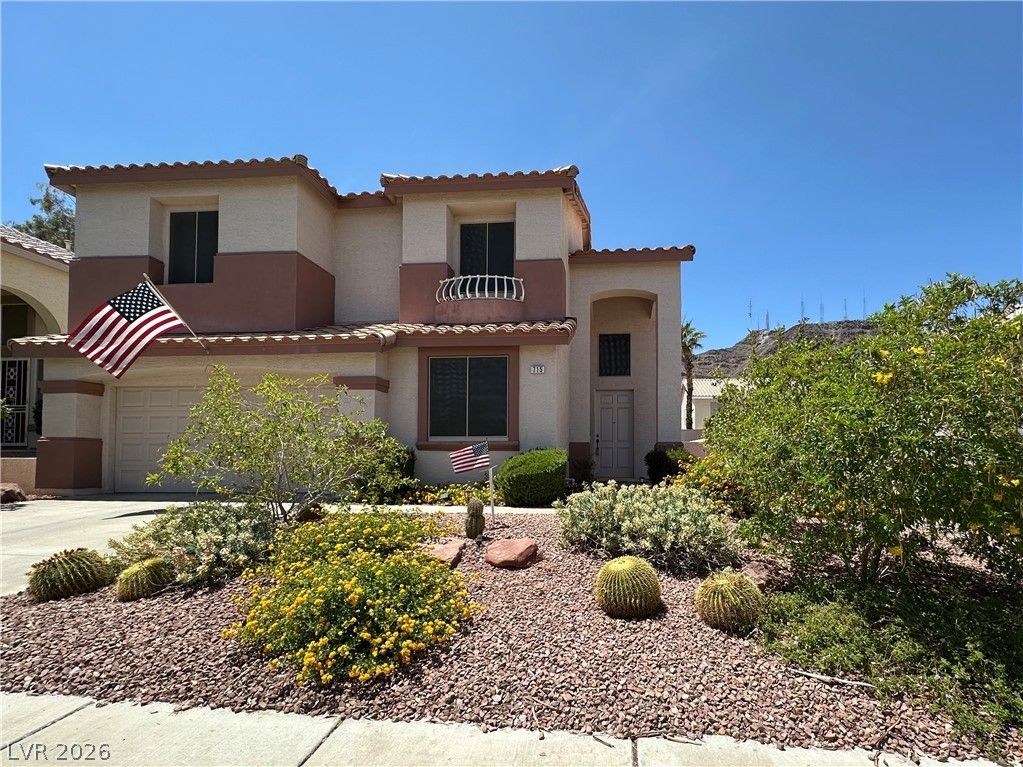
$630,0004 bd3 ba2,479 sqft$254/sqft0.75 mi63 daysSold 2026-08-19
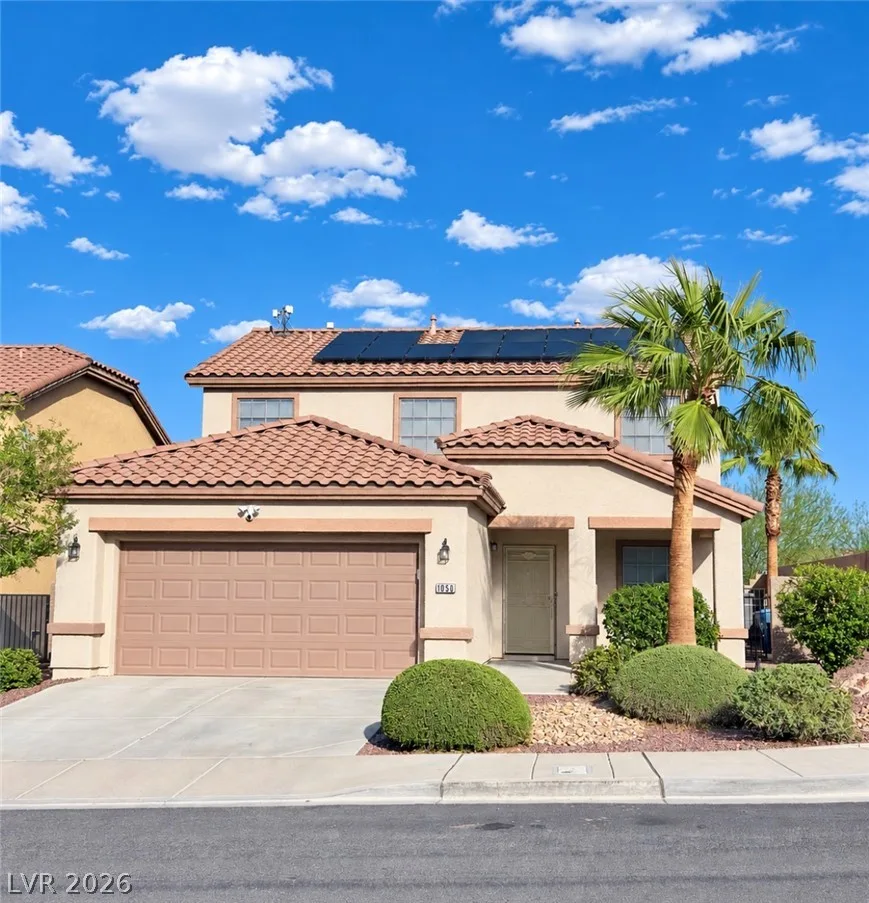
1050 Copper Palm CourtActive
$540,0004 bd3 ba2,142 sqft$252/sqft0.77 mi8 days
$495,0004 bd3 ba2,464 sqft$201/sqft0.79 mi6 daysSold 2026-07-15
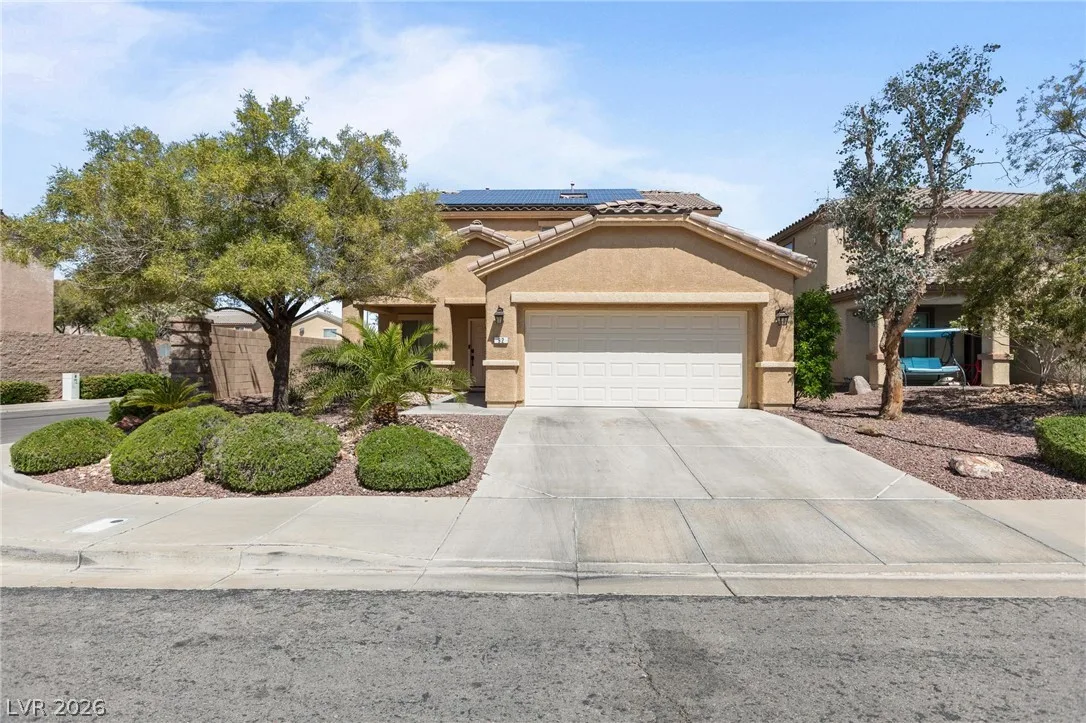
92 Newmiller StreetActive
$495,0004 bd3 ba2,142 sqft$231/sqft0.83 mi0 days
$523,0003 bd2 ba1,673 sqft$313/sqft0.83 mi6 daysSold 2026-07-10

112 Newmiller StreetActive
$498,9004 bd3 ba2,142 sqft$233/sqft0.86 mi35 days
$530,0004 bd3 ba2,142 sqft$247/sqft0.86 mi6 daysSold 2026-05-04
$499,9004 bd3 ba1,807 sqft$277/sqft0.89 mi14 daysSold 2026-06-03
Nearest comparable sales and listings
12 comparables · median price $509,200 · range $450,000 – $630,000 · median $/sq ft $265 · average $/sq ft $266
| Address | Status | Price | $/Sq Ft | Bd / Ba | Sq Ft | Sold / market time | Distance |
|---|---|---|---|---|---|---|---|
| 64 Blaven Drive | Active | $535,000 | $303 | 3 / 2 | 1,767 | 5 days on market | 0.70 mi |
| 708 Leicester Street | Sold | $518,500 | $310 | 3 / 2 | 1,673 | Sold 2026-09-17 | 0.73 mi |
| 715 Leicester Street | Sold | $630,000 | $254 | 4 / 3 | 2,479 | Sold 2026-08-19 | 0.75 mi |
| 1050 Copper Palm Court | Active | $540,000 | $252 | 4 / 3 | 2,142 | 8 days on market | 0.77 mi |
| 1046 White Willow Court | Sold | $495,000 | $201 | 4 / 3 | 2,464 | Sold 2026-07-15 | 0.79 mi |
| 92 Newmiller Street | Active | $495,000 | $231 | 4 / 3 | 2,142 | 0 days on market | 0.83 mi |
| 81 Saint Johns Wood Avenue | Sold | $523,000 | $313 | 3 / 2 | 1,673 | Sold 2026-07-10 | 0.83 mi |
| 112 Newmiller Street | Active | $498,900 | $233 | 4 / 3 | 2,142 | 35 days on market | 0.86 mi |
| 113 Lovage Street | Sold | $530,000 | $247 | 4 / 3 | 2,142 | Sold 2026-05-04 | 0.86 mi |
| 1053 Carson Run Street | Sold | $499,900 | $277 | 4 / 3 | 1,807 | Sold 2026-06-03 | 0.89 mi |
| 707 Jane Eyre Place | Pending | $489,999 | $293 | 3 / 2 | 1,673 | 81 days on market | 0.90 mi |
| 695 Jane Eyre Place | Active | $450,000 | $283 | 3 / 2 | 1,589 | 89 days on market | 0.92 mi |


