
Comparable Sales Near 1183 Winnipeg Court, Henderson, NV 89002
1st Realty · Comparable sales report · 1st.estate · October 21, 2026
Read the Henderson area guide →
1183 Winnipeg Court, Henderson, NV 89002
Status: Sold
$523,000 Sold Price
$313
$ / Sq Ft
1,671
Living Area
6,098 sqft
Lot Size
3
Beds
2
Baths
1994
Year Built
Search Parameters
Property Type
Status
Radius
Sold Within
Beds
Baths
Living Area (Sq Ft)
Lot Size (Sq Ft)
This comp search reflects your current search parameters — adjust the filters above as needed for a more accurate estimate.
Estimated Value
—
Average $/Sqft
—
Check one or more comps below to calculate an estimate.
Nearest 10 of 53 comparable sales and listings within 1 mile of this home. Use the filters above and press Search to refine.
$465,0004 bd2 ba2,023 sqft$230/sqft0.14 mi96 daysSold 2026-04-29
$445,0003 bd2 ba1,431 sqft$311/sqft0.21 mi9 daysSold 2026-05-22
$419,0003 bd2 ba1,587 sqft$264/sqft0.24 mi18 daysSold 2026-07-15
$461,0003 bd2 ba1,431 sqft$322/sqft0.26 mi8 daysSold 2026-04-27
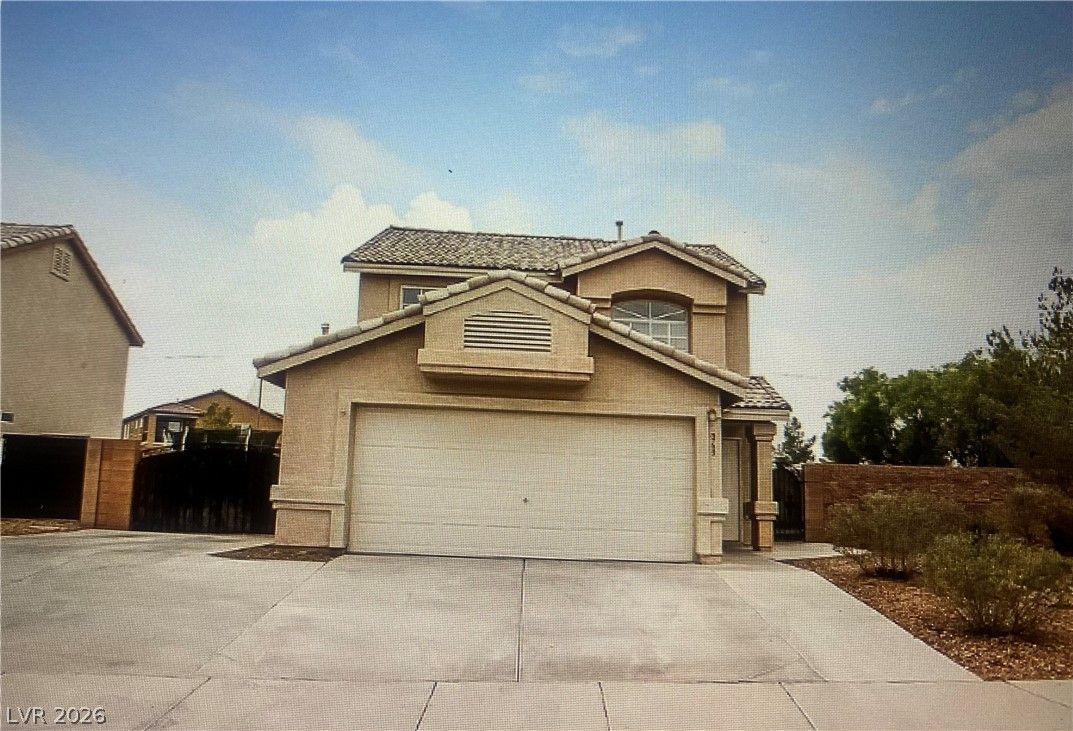
$316,9903 bd2 ba1,431 sqft$222/sqft0.29 mi0 daysSold 2026-09-01
$425,0003 bd2 ba1,408 sqft$302/sqft0.34 mi3 daysSold 2026-06-22

1816 Longmeadow StreetActive
$400,0003 bd2 ba1,406 sqft$284/sqft0.39 mi45 days
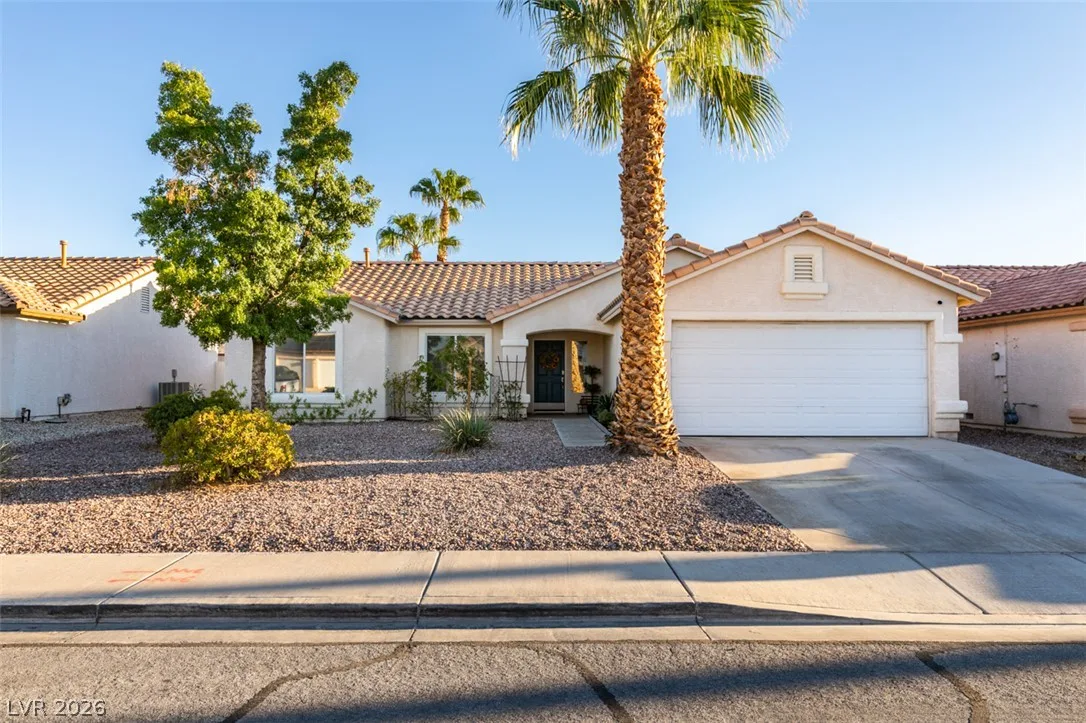
1070 Kennebunk CircleActive
$420,0003 bd2 ba1,431 sqft$294/sqft0.44 mi2 days
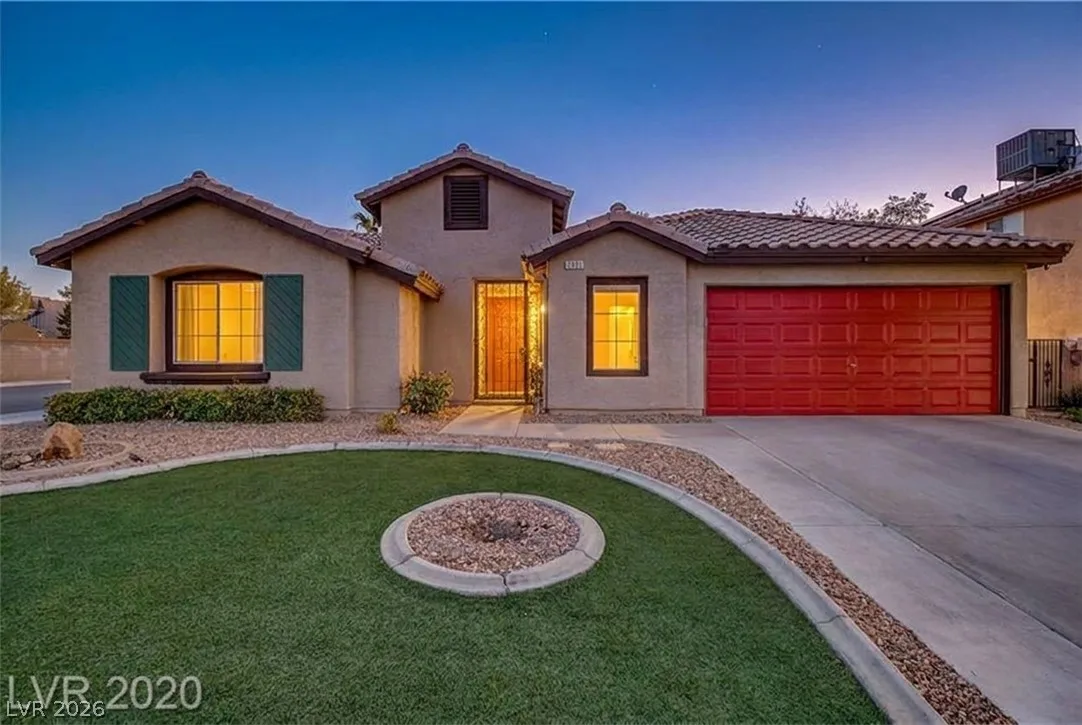
1381 Garden Gate PlaceActive
$625,0003 bd2 ba1,913 sqft$327/sqft0.49 mi7 days
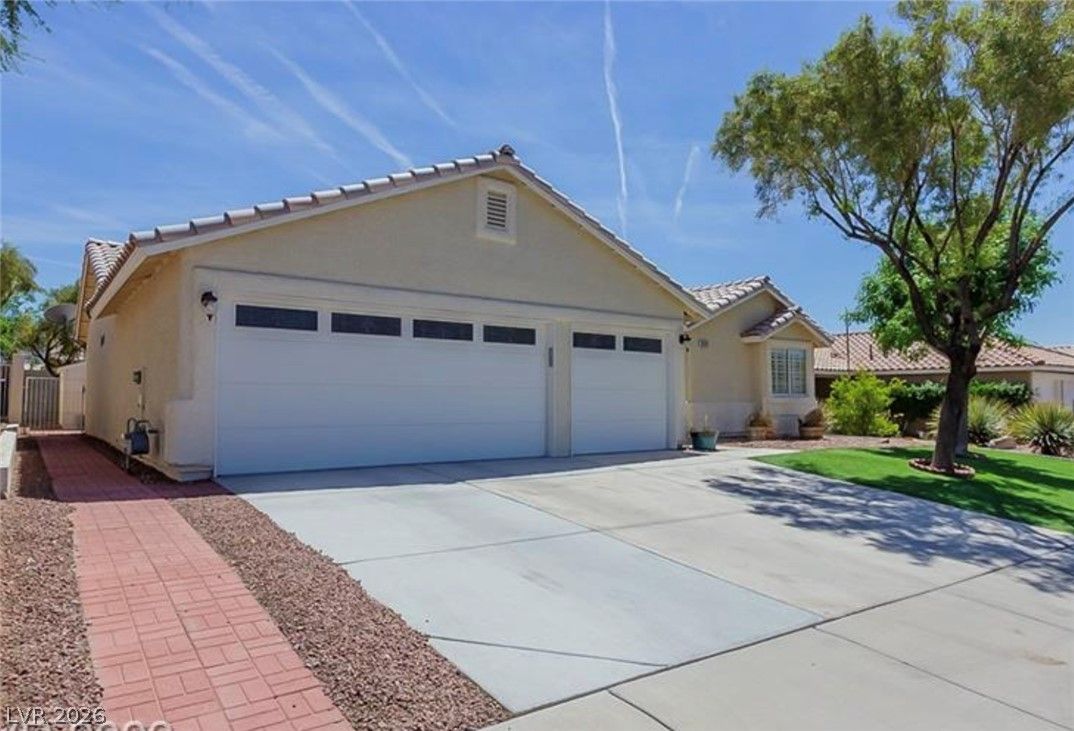
1073 Featherwood AvenueActive
$405,0003 bd2 ba1,592 sqft$254/sqft0.50 mi18 days
Nearest comparable sales and listings
12 comparables · median price $435,000 · range $316,990 – $625,000 · median $/sq ft $283 · average $/sq ft $276
| Address | Status | Price | $/Sq Ft | Bd / Ba | Sq Ft | Sold / market time | Distance |
|---|---|---|---|---|---|---|---|
| 727 Triple Crown Street | Sold | $465,000 | $230 | 4 / 2 | 2,023 | Sold 2026-04-29 | 0.14 mi |
| 1100 Indiana Court | Sold | $445,000 | $311 | 3 / 2 | 1,431 | Sold 2026-05-22 | 0.21 mi |
| 1931 Spring Lake Drive | Sold | $419,000 | $264 | 3 / 2 | 1,587 | Sold 2026-07-15 | 0.24 mi |
| 1113 Sport Of Kings Avenue | Sold | $461,000 | $322 | 3 / 2 | 1,431 | Sold 2026-04-27 | 0.26 mi |
| 1069 Eagle Owl Avenue | Sold | $316,990 | $222 | 3 / 2 | 1,431 | Sold 2026-09-01 | 0.29 mi |
| 1068 Harpy Eagle Avenue | Sold | $425,000 | $302 | 3 / 2 | 1,408 | Sold 2026-06-22 | 0.34 mi |
| 1816 Longmeadow Street | Active | $400,000 | $284 | 3 / 2 | 1,406 | 45 days on market | 0.39 mi |
| 1070 Kennebunk Circle | Active | $420,000 | $294 | 3 / 2 | 1,431 | 2 days on market | 0.44 mi |
| 1381 Garden Gate Place | Active | $625,000 | $327 | 3 / 2 | 1,913 | 7 days on market | 0.49 mi |
| 1073 Featherwood Avenue | Active | $405,000 | $254 | 3 / 2 | 1,592 | 18 days on market | 0.50 mi |
| 2031 Buckeye Reef Street | Sold | $560,000 | $282 | 4 / 3 | 1,983 | Sold 2026-05-01 | 0.57 mi |
| 2000 Fallsburg Way | Sold | $450,000 | $226 | 4 / 3 | 1,995 | Sold 2026-08-06 | 0.60 mi |


