
Comparable Sales Near 1145 Sparkling Crystal Avenue, Henderson, NV 89015
1st Realty · Comparable sales report · 1st.estate · October 20, 2026
Read the Henderson area guide →
1145 Sparkling Crystal Avenue, Henderson, NV 89015
Status: Sold
$2,675 Sold Price
$1
$ / Sq Ft
2,945
Living Area
6,098 sqft
Lot Size
5
Beds
3
Baths
2006
Year Built
Search Parameters
Property Type
Status
Radius
Sold Within
Beds
Baths
Living Area (Sq Ft)
Lot Size (Sq Ft)
This comp search reflects your current search parameters — adjust the filters above as needed for a more accurate estimate.
Estimated Value
—
Average $/Sqft
—
Check one or more comps below to calculate an estimate.
Nearest 10 of 20 comparable sales and listings within 1 mile of this home. Use the filters above and press Search to refine.
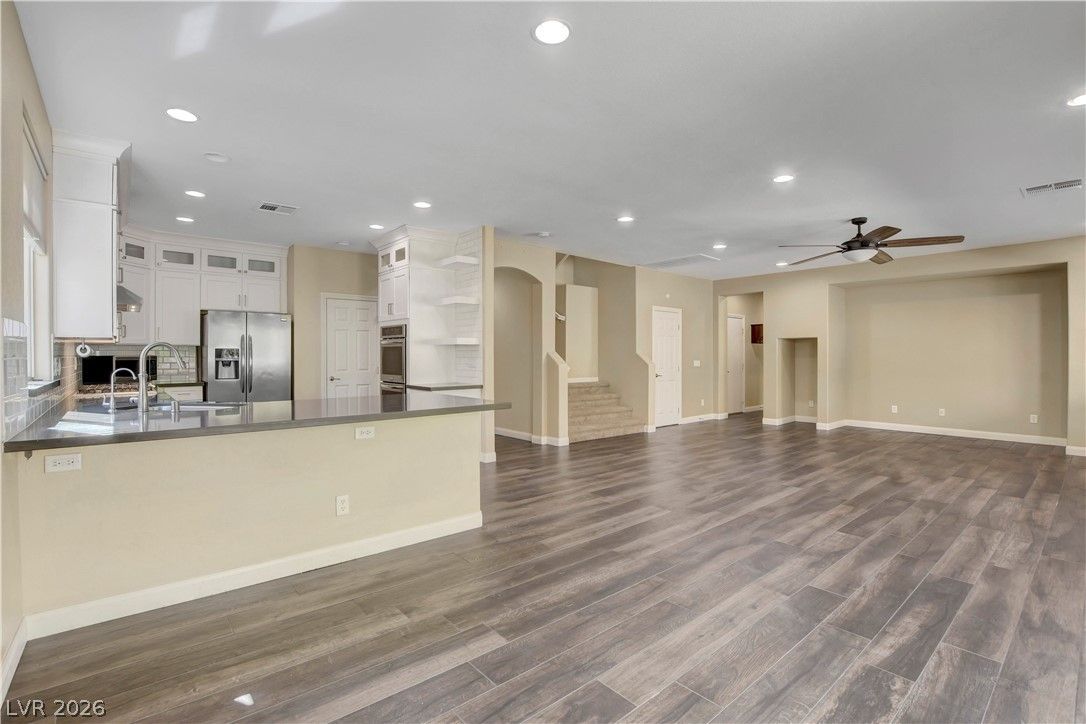
$549,9005 bd3 ba2,945 sqft$187/sqft0.06 mi107 daysSold 2026-09-04
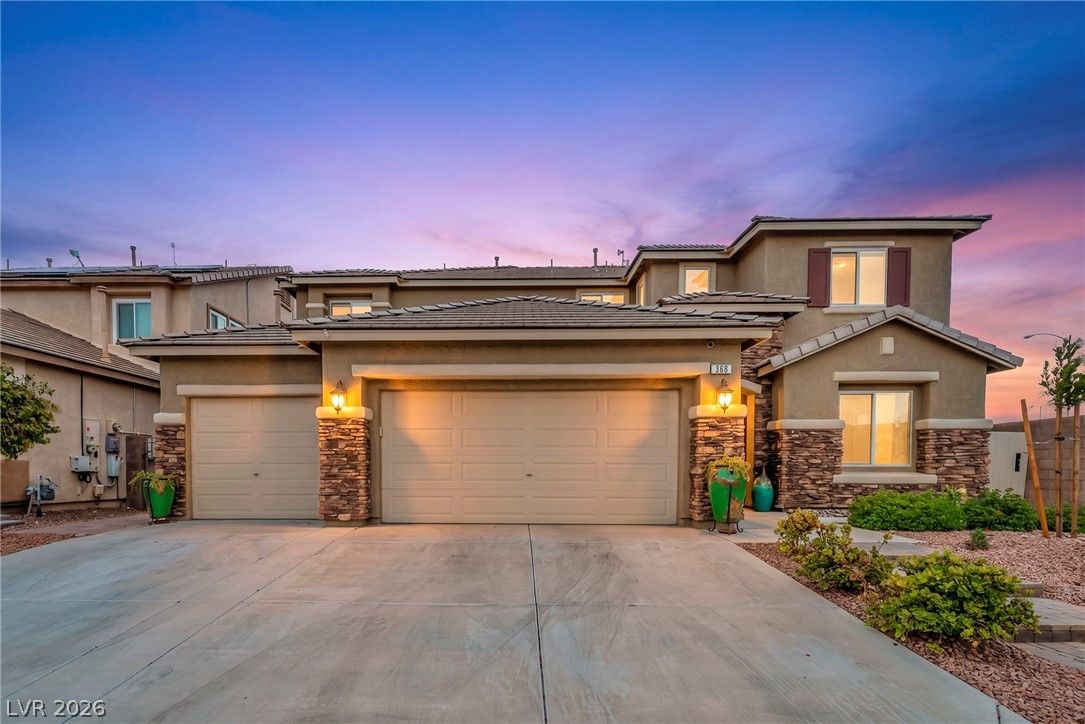
$640,0004 bd4 ba3,668 sqft$174/sqft0.10 mi0 days
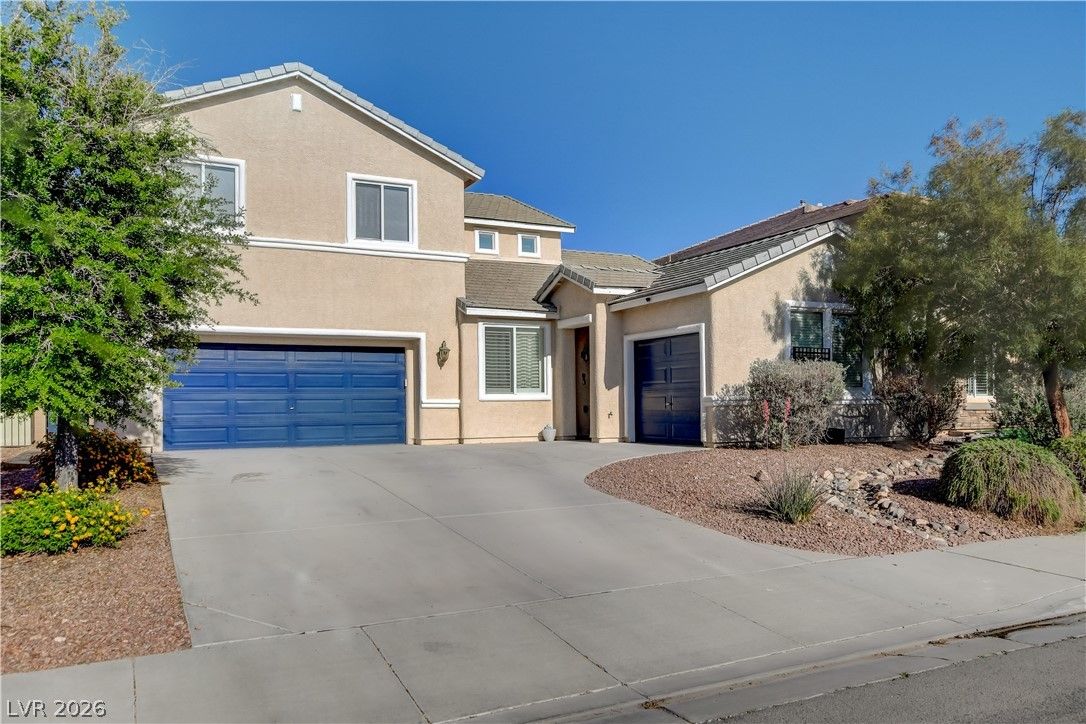
$505,4005 bd3 ba2,945 sqft$172/sqft0.12 mi87 daysSold 2026-08-31
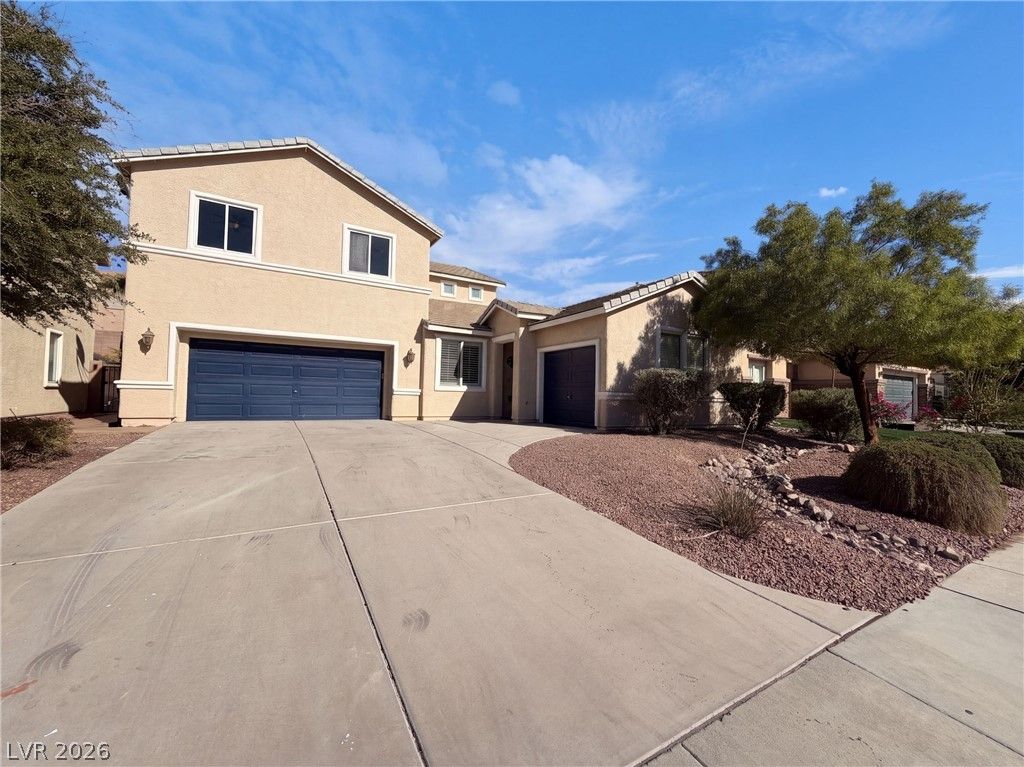
$510,0005 bd3 ba2,945 sqft$173/sqft0.12 mi6 daysSold 2026-10-13
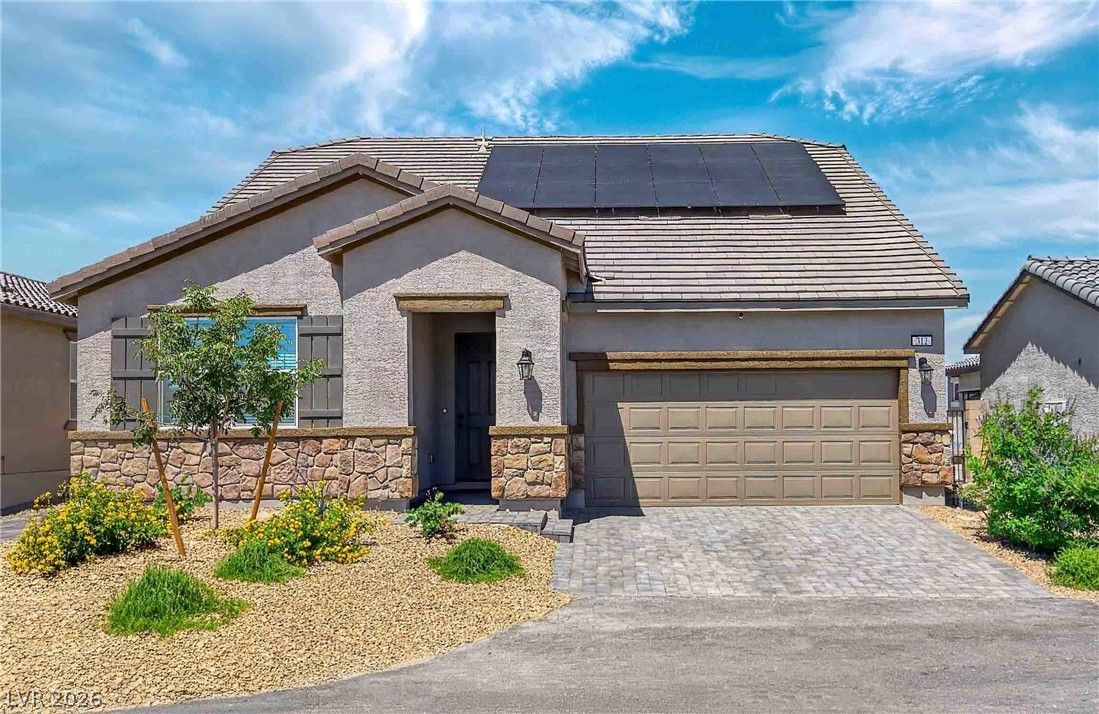
312 South Parawan StreetActive
$780,0004 bd3 ba2,733 sqft$285/sqft0.22 mi67 days
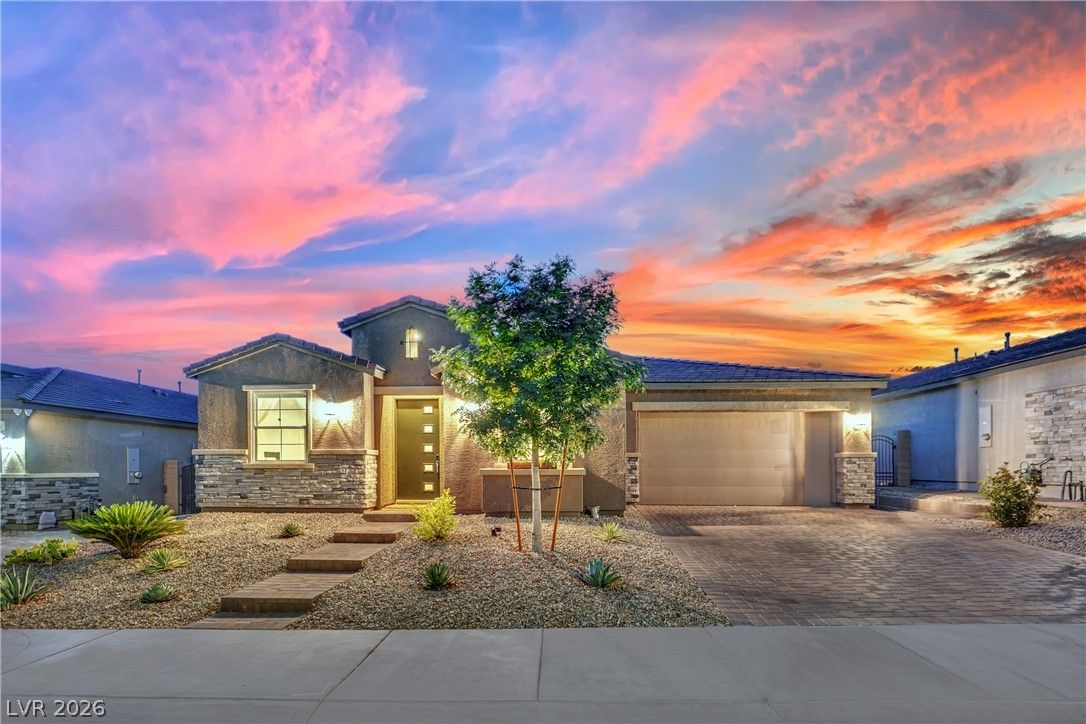
1012 Zurich AvenueActive
$699,9004 bd3 ba2,560 sqft$273/sqft0.35 mi0 days
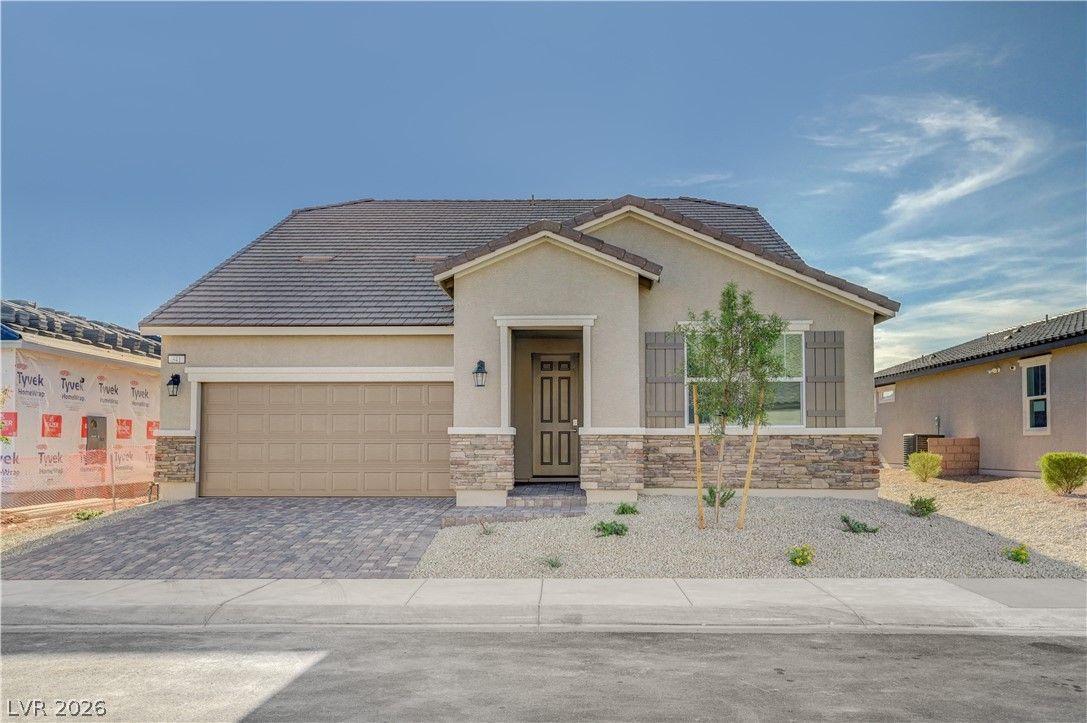
$599,9904 bd3 ba2,733 sqft$220/sqft0.35 mi170 daysSold 2026-08-21
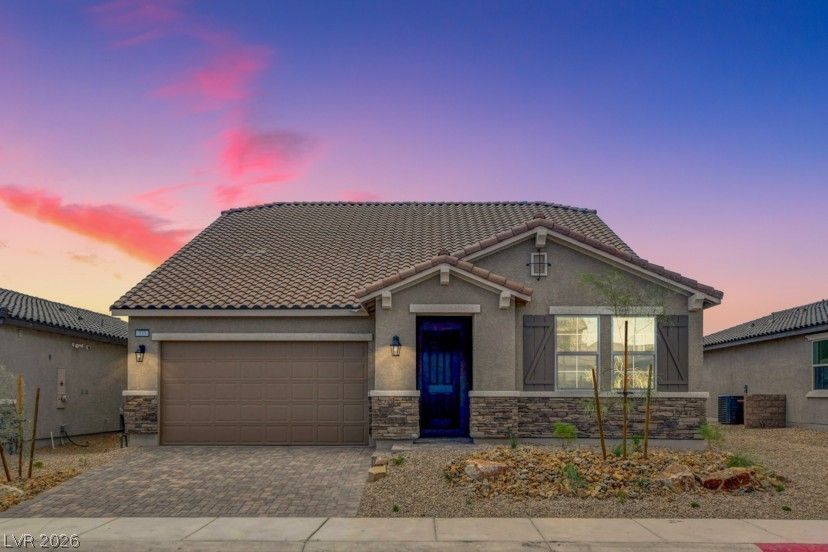
$630,0004 bd3 ba2,733 sqft$231/sqft0.35 mi162 daysSold 2026-09-16
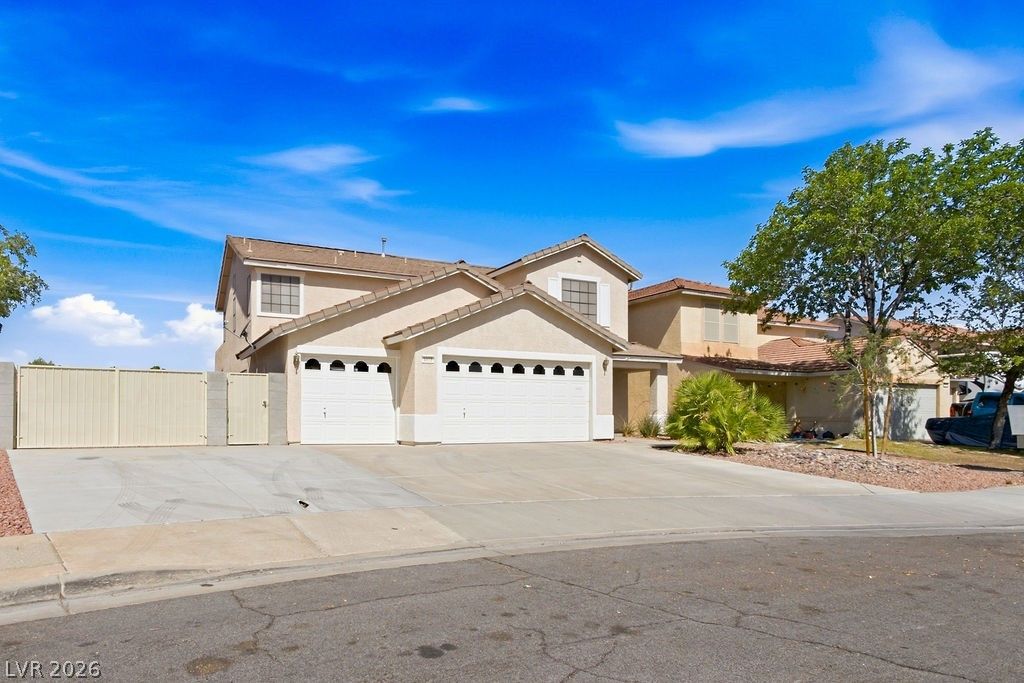
$545,5005 bd3 ba2,436 sqft$224/sqft0.39 mi38 daysSold 2026-08-24
$569,0004 bd3 ba2,436 sqft$234/sqft0.44 mi25 daysSold 2026-05-08
Nearest comparable sales and listings
12 comparables · median price $559,450 · range $447,500 – $780,000 · median $/sq ft $222 · average $/sq ft $218
| Address | Status | Price | $/Sq Ft | Bd / Ba | Sq Ft | Sold / market time | Distance |
|---|---|---|---|---|---|---|---|
| 338 Shimmering Moon Street | Sold | $549,900 | $187 | 5 / 3 | 2,945 | Sold 2026-09-04 | 0.06 mi |
| 368 Misty Moonlight Street | Active | $640,000 | $174 | 4 / 4 | 3,668 | 0 days on market | 0.10 mi |
| 360 South Milan Street | Sold | $505,400 | $172 | 5 / 3 | 2,945 | Sold 2026-08-31 | 0.12 mi |
| 360 South Milan Street | Sold | $510,000 | $173 | 5 / 3 | 2,945 | Sold 2026-10-13 | 0.12 mi |
| 312 South Parawan Street | Active | $780,000 | $285 | 4 / 3 | 2,733 | 67 days on market | 0.22 mi |
| 1012 Zurich Avenue | Active | $699,900 | $273 | 4 / 3 | 2,560 | 0 days on market | 0.35 mi |
| 341 Talladega Court | Sold | $599,990 | $220 | 4 / 3 | 2,733 | Sold 2026-08-21 | 0.35 mi |
| 333 Talladega Court | Sold | $630,000 | $231 | 4 / 3 | 2,733 | Sold 2026-09-16 | 0.35 mi |
| 1073 Gallant Fox Avenue | Sold | $545,500 | $224 | 5 / 3 | 2,436 | Sold 2026-08-24 | 0.39 mi |
| 1109 Pincay Drive | Sold | $569,000 | $234 | 4 / 3 | 2,436 | Sold 2026-05-08 | 0.44 mi |
| 551 Duran Street | Sold | $447,500 | $197 | 4 / 3 | 2,266 | Sold 2026-05-22 | 0.48 mi |
| 994 River Walk Court | Active | $549,900 | $245 | 4 / 3 | 2,246 | 1 days on market | 0.72 mi |


