
Comparable Sales Near 413 Pumpkin Way, Henderson, NV 89015
1st Realty · Comparable sales report · 1st.estate · October 20, 2026
Read the Henderson area guide →
413 Pumpkin Way, Henderson, NV 89015
Status: Sold
$385,000 Sold Price
$356
$ / Sq Ft
1,081
Living Area
9,148 sqft
Lot Size
3
Beds
2
Baths
1981
Year Built
Search Parameters
Property Type
Status
Radius
Sold Within
Beds
Baths
Living Area (Sq Ft)
Lot Size (Sq Ft)
This comp search reflects your current search parameters — adjust the filters above as needed for a more accurate estimate.
Estimated Value
—
Average $/Sqft
—
Check one or more comps below to calculate an estimate.
Nearest 10 of 17 comparable sales and listings within 1 mile of this home. Use the filters above and press Search to refine.
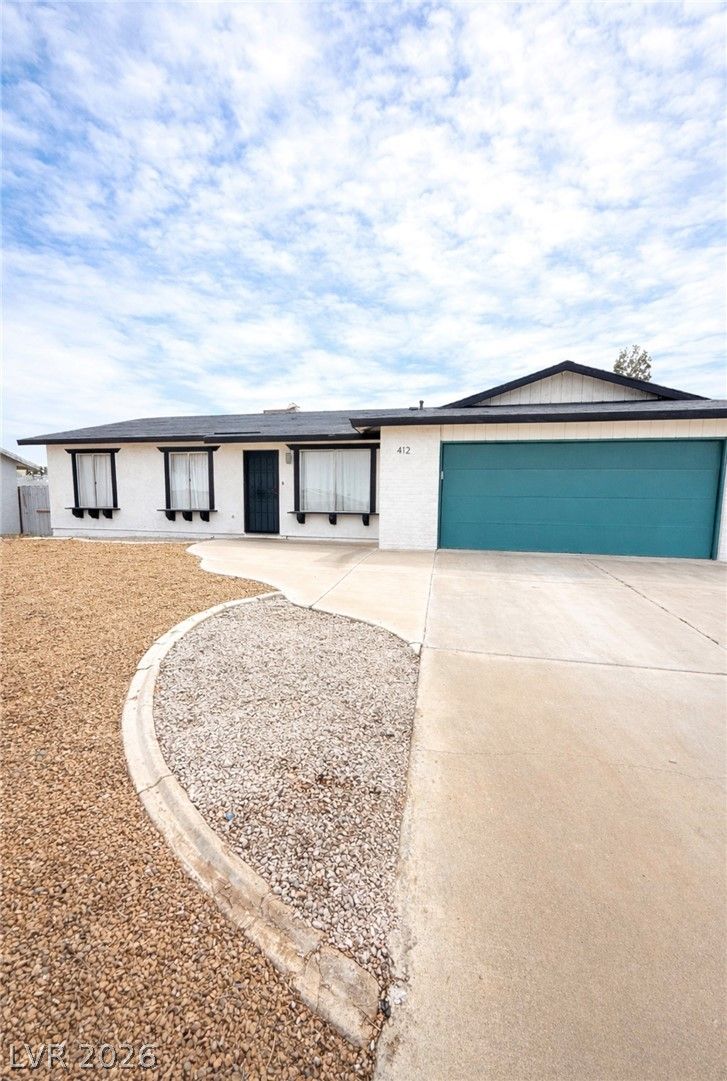
412 Cindy PlaceSold
$320,0003 bd1 ba1,192 sqft$268/sqft0.07 mi211 daysSold 2026-09-22
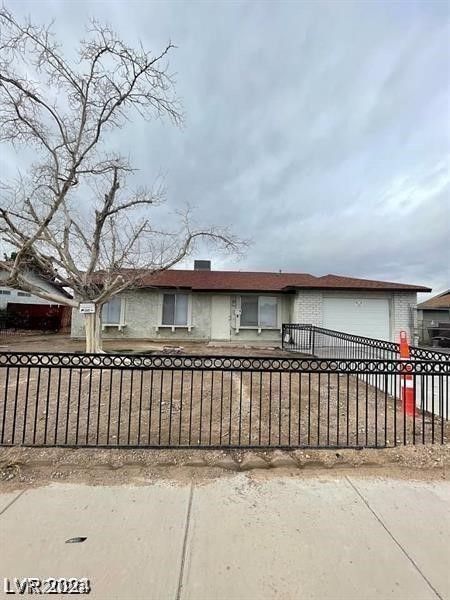
915 MAJOR AvenueActive
$429,9003 bd2 ba1,081 sqft$398/sqft0.19 mi18 days
436 Ash StreetSold
$388,0003 bd2 ba1,241 sqft$313/sqft0.24 mi15 daysSold 2026-05-11
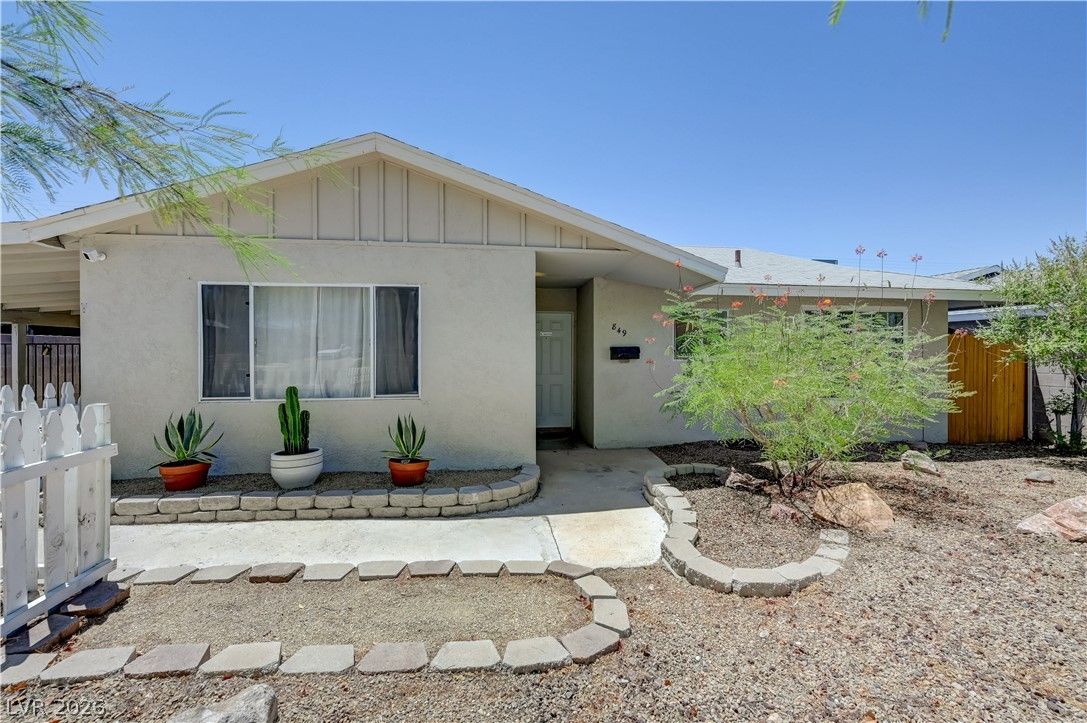
$360,0003 bd2 ba1,264 sqft$285/sqft0.33 mi8 daysSold 2026-07-29
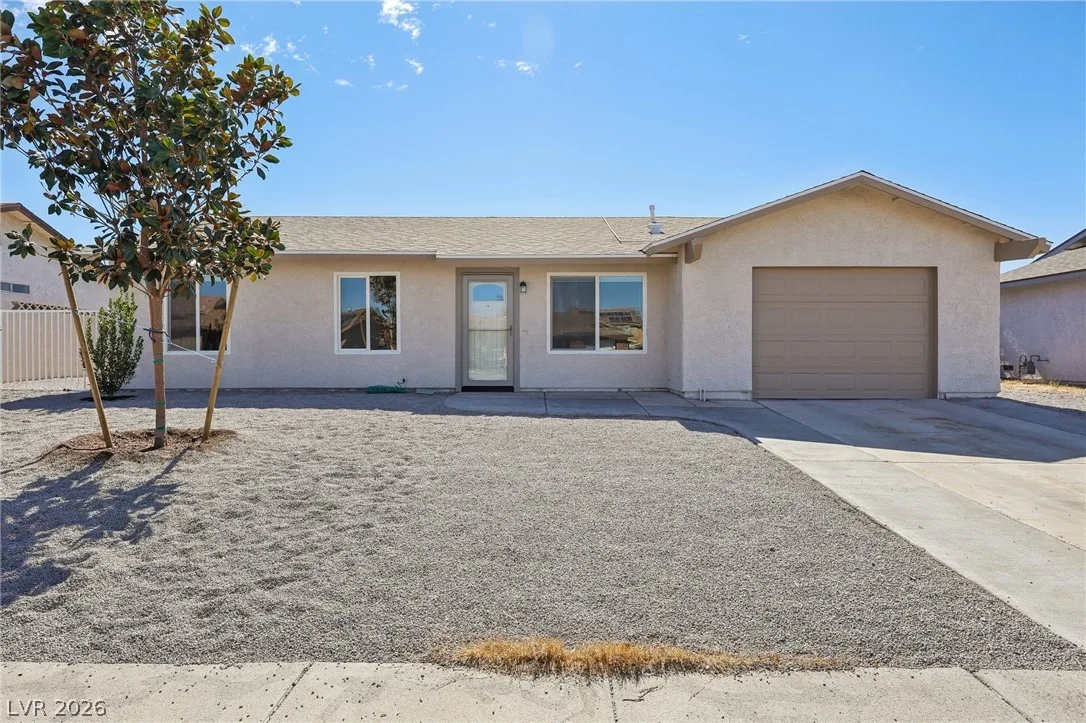
402 Ash StreetActive
$375,0003 bd2 ba1,081 sqft$347/sqft0.34 mi1 days
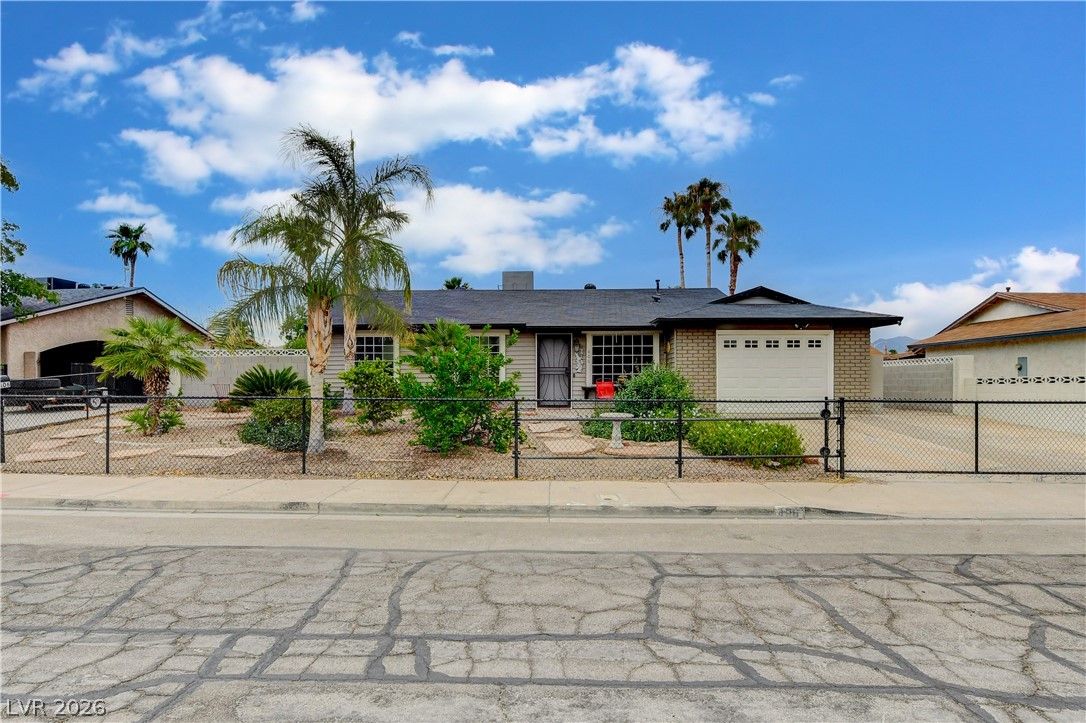
406 Ash StreetSold
$350,0003 bd2 ba1,081 sqft$324/sqft0.34 mi11 daysSold 2026-09-17
$330,0003 bd2 ba988 sqft$334/sqft0.35 mi42 daysSold 2026-07-01
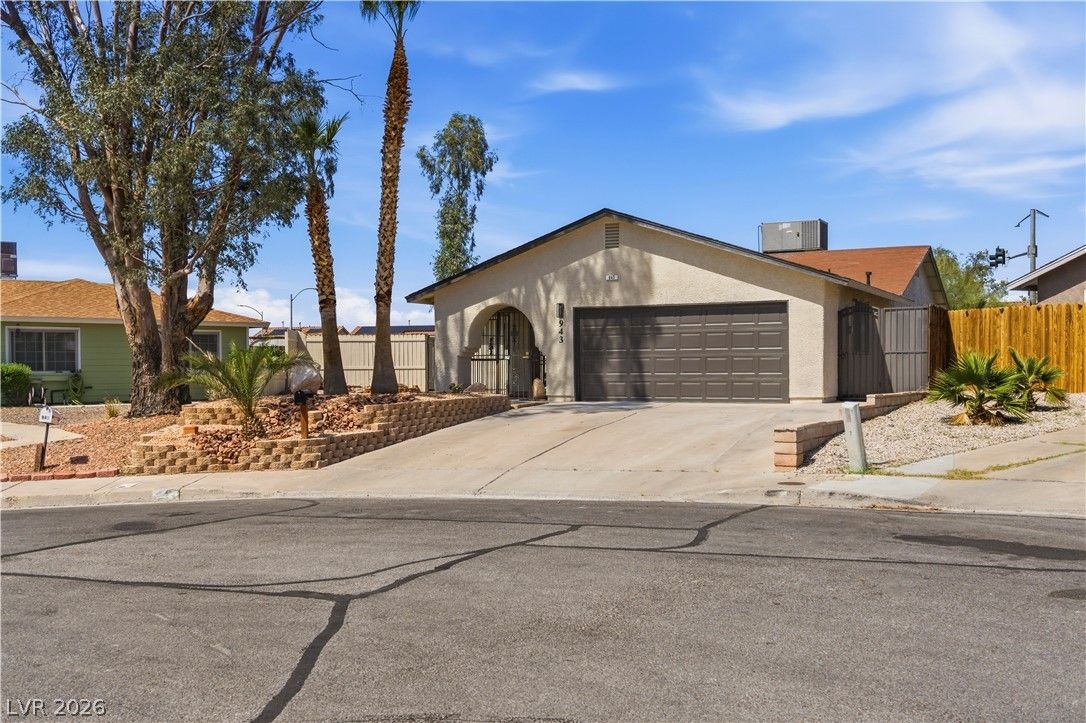
943 Tami CircleSold
$409,5003 bd2 ba1,332 sqft$307/sqft0.38 mi63 daysSold 2026-07-29
$355,0003 bd2 ba1,070 sqft$332/sqft0.40 mi80 daysSold 2026-05-05
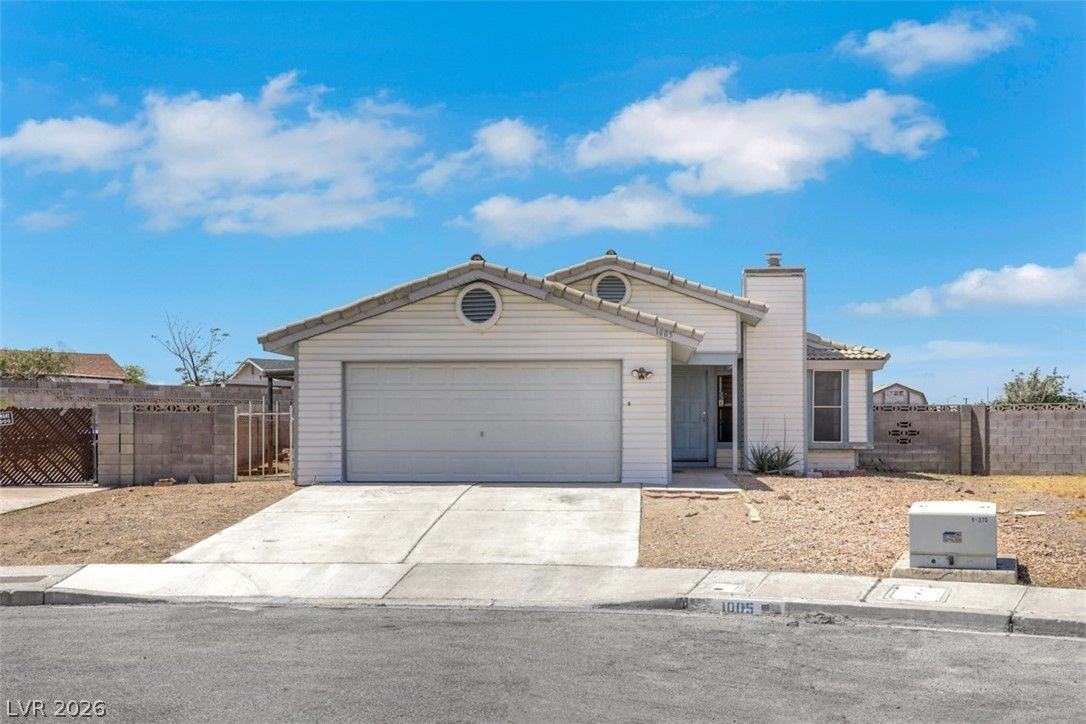
1005 Brookside CourtActive
$340,0003 bd2 ba1,070 sqft$318/sqft0.44 mi48 days
Nearest comparable sales and listings
12 comparables · median price $357,500 · range $320,000 – $429,900 · median $/sq ft $321 · average $/sq ft $322
| Address | Status | Price | $/Sq Ft | Bd / Ba | Sq Ft | Sold / market time | Distance |
|---|---|---|---|---|---|---|---|
| 412 Cindy Place | Sold | $320,000 | $268 | 3 / 1 | 1,192 | Sold 2026-09-22 | 0.07 mi |
| 915 MAJOR Avenue | Active | $429,900 | $398 | 3 / 2 | 1,081 | 18 days on market | 0.19 mi |
| 436 Ash Street | Sold | $388,000 | $313 | 3 / 2 | 1,241 | Sold 2026-05-11 | 0.24 mi |
| 849 Center Street | Sold | $360,000 | $285 | 3 / 2 | 1,264 | Sold 2026-07-29 | 0.33 mi |
| 402 Ash Street | Active | $375,000 | $347 | 3 / 2 | 1,081 | 1 days on market | 0.34 mi |
| 406 Ash Street | Sold | $350,000 | $324 | 3 / 2 | 1,081 | Sold 2026-09-17 | 0.34 mi |
| 936 Greenville Street | Sold | $330,000 | $334 | 3 / 2 | 988 | Sold 2026-07-01 | 0.35 mi |
| 943 Tami Circle | Sold | $409,500 | $307 | 3 / 2 | 1,332 | Sold 2026-07-29 | 0.38 mi |
| 1003 Palo Verde Drive | Sold | $355,000 | $332 | 3 / 2 | 1,070 | Sold 2026-05-05 | 0.40 mi |
| 1005 Brookside Court | Active | $340,000 | $318 | 3 / 2 | 1,070 | 48 days on market | 0.44 mi |
| 120 Linden Street | Under Contract | $364,900 | $309 | 3 / 2 | 1,181 | 19 days on market | 0.48 mi |
| 118 Maple Street | Active | $329,999 | $334 | 4 / 2 | 988 | 5 days on market | 0.49 mi |


