
Comparable Sales Near 1110 Broken Hills Drive, Henderson, NV 89011
1st Realty · Comparable sales report · 1st.estate · October 20, 2026
Read the Henderson area guide →
1110 Broken Hills Drive, Henderson, NV 89011
Status: Sold
$515,000 Sold Price
$300
$ / Sq Ft
1,714
Living Area
6,970 sqft
Lot Size
3
Beds
2
Baths
1990
Year Built
Search Parameters
Property Type
Status
Radius
Sold Within
Beds
Baths
Living Area (Sq Ft)
Lot Size (Sq Ft)
This comp search reflects your current search parameters — adjust the filters above as needed for a more accurate estimate.
Estimated Value
—
Average $/Sqft
—
Check one or more comps below to calculate an estimate.
Nearest 10 of 17 comparable sales and listings within 1 mile of this home. Use the filters above and press Search to refine.
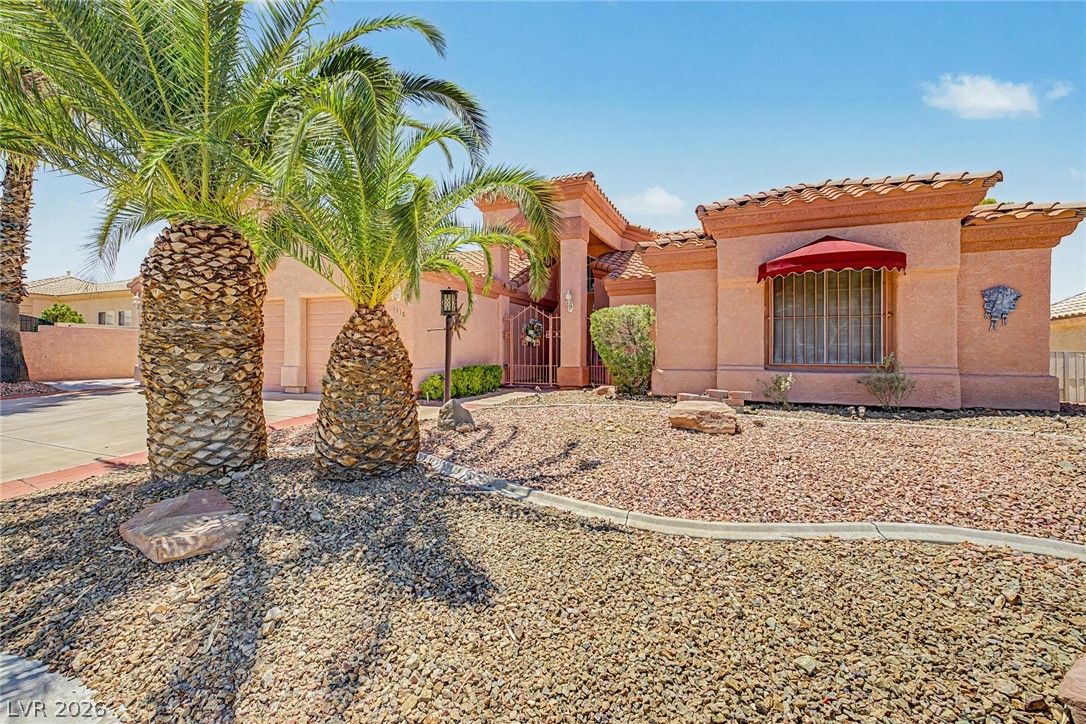
1118 Shady Run TerraceActive
$449,0004 bd3 ba1,734 sqft$259/sqft0.04 mi59 days

1117 Shady Run TerraceActive
$519,9004 bd2 ba1,784 sqft$291/sqft0.07 mi48 days

908 Rhyolite TerraceActive
$719,9004 bd3 ba2,004 sqft$359/sqft0.14 mi2 days
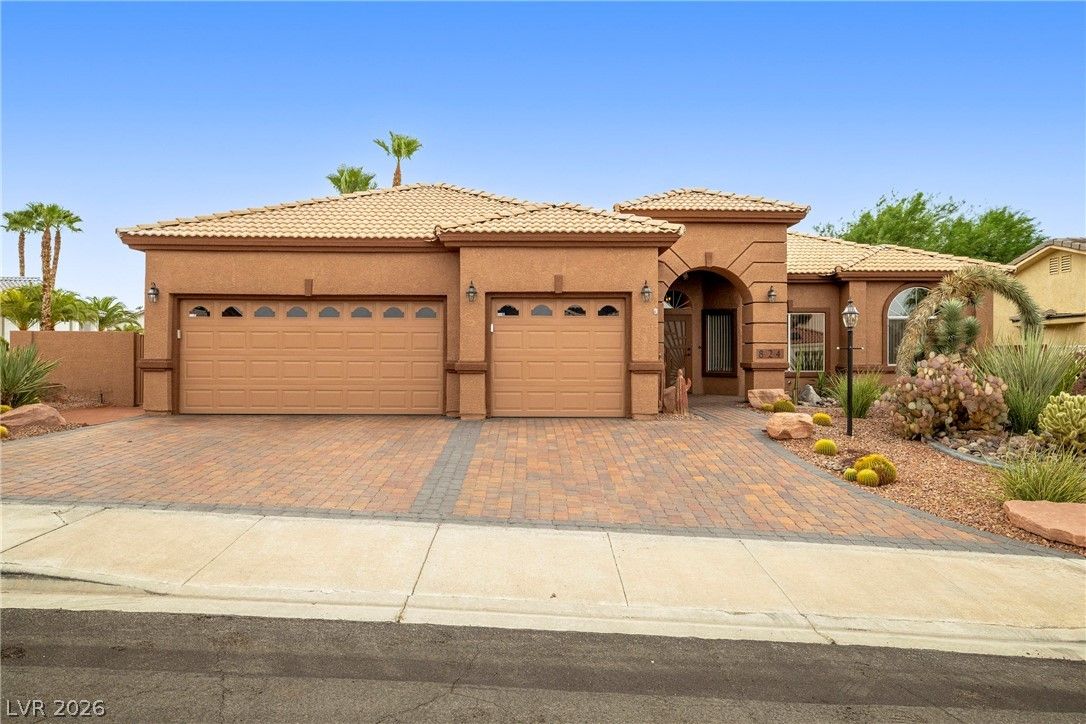
824 Sandsprings StreetActive
$595,0003 bd2 ba2,088 sqft$285/sqft0.24 mi45 days
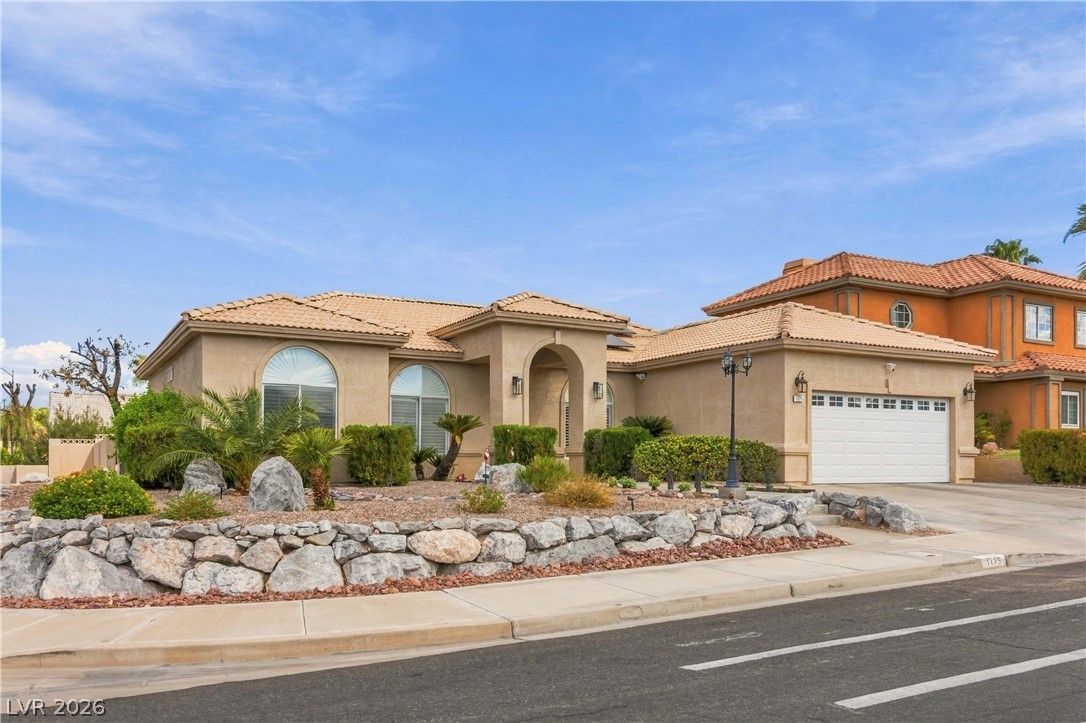
1175 Calico Ridge DriveActive
$499,0003 bd2 ba1,790 sqft$279/sqft0.27 mi14 days
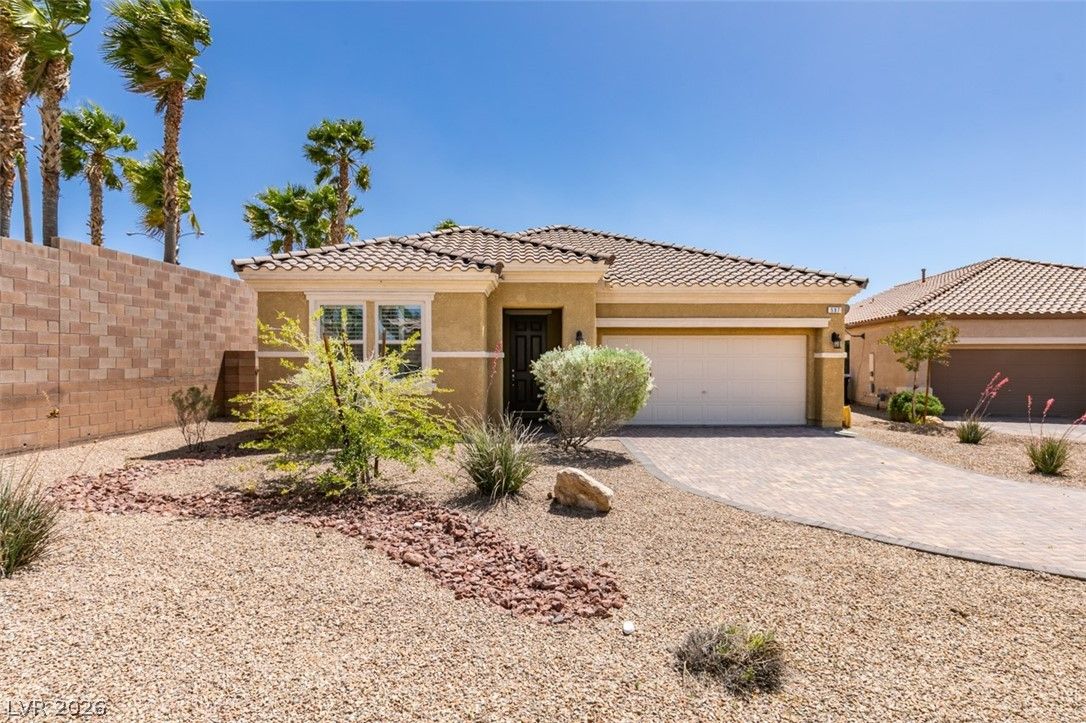
597 Via PaladiniPending
$439,9002 bd2 ba1,802 sqft$244/sqft0.27 mi175 days
$420,0003 bd2 ba1,802 sqft$233/sqft0.31 mi35 daysSold 2026-05-01
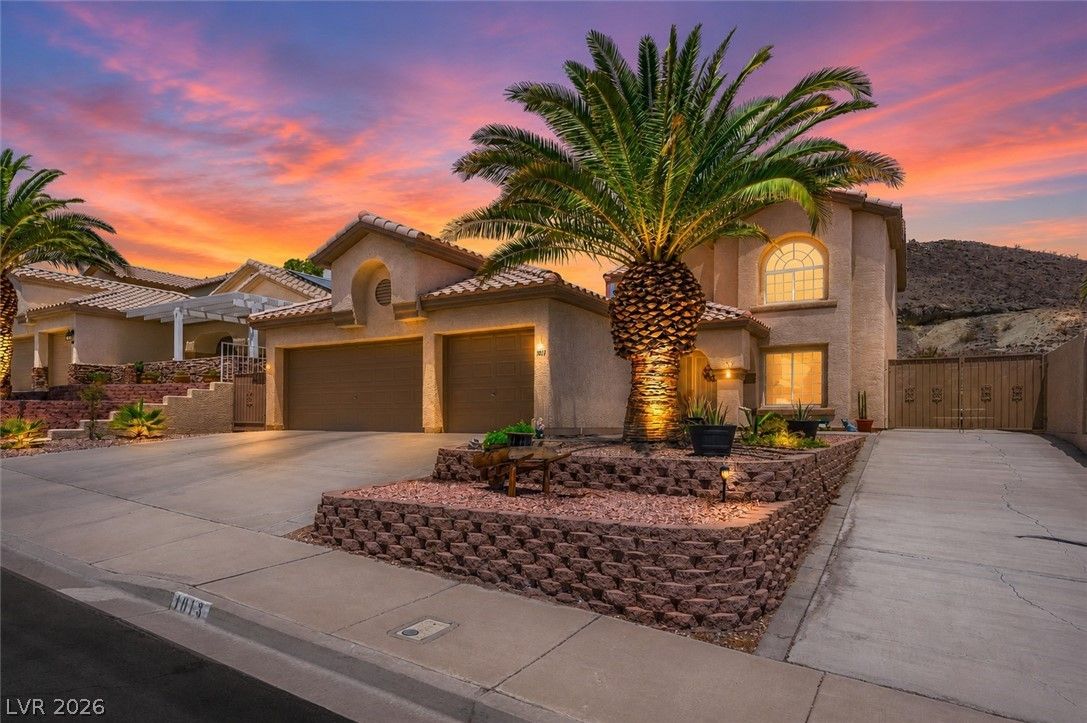
$575,0004 bd3 ba2,006 sqft$287/sqft0.54 mi30 daysSold 2026-09-15
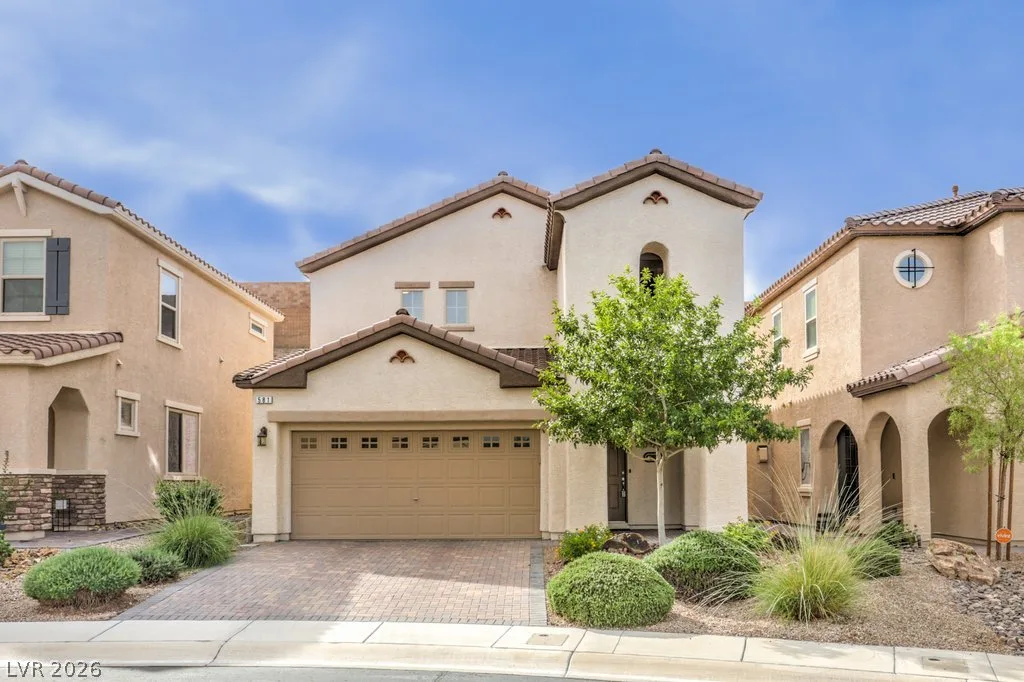
581 Via MediciActive
$475,0003 bd3 ba1,745 sqft$272/sqft0.55 mi0 days
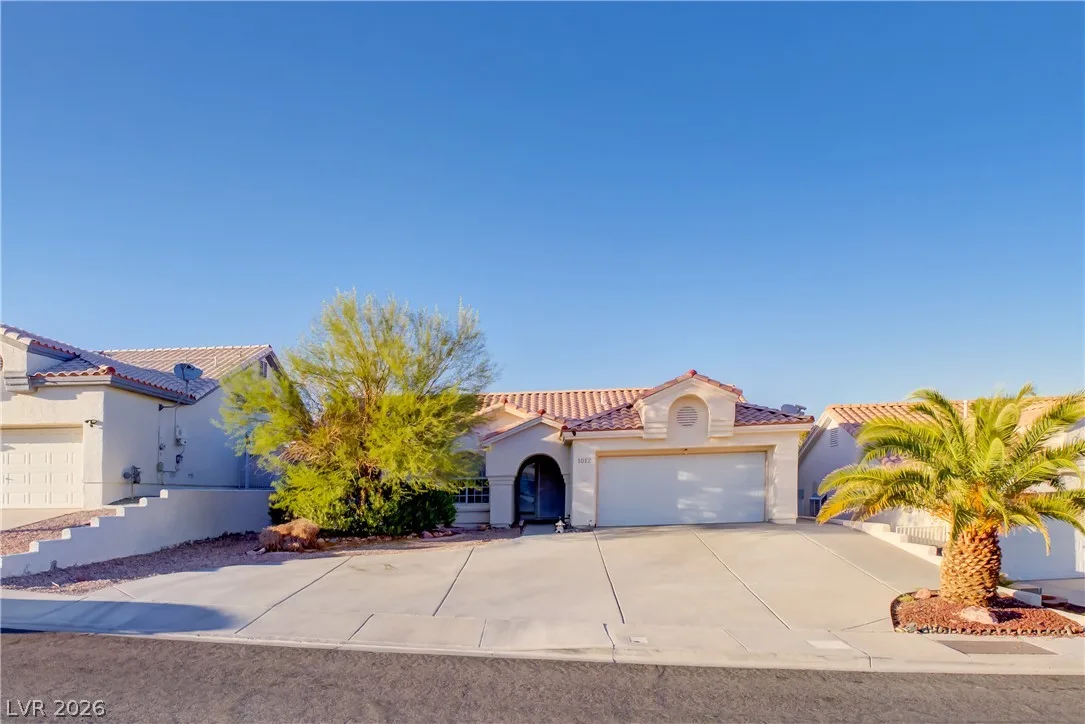
1012 Weatherboard StreetActive
$395,0002 bd2 ba1,448 sqft$273/sqft0.56 mi1 days
Nearest comparable sales and listings
12 comparables · median price $487,000 · range $395,000 – $719,900 · median $/sq ft $282 · average $/sq ft $282
| Address | Status | Price | $/Sq Ft | Bd / Ba | Sq Ft | Sold / market time | Distance |
|---|---|---|---|---|---|---|---|
| 1118 Shady Run Terrace | Active | $449,000 | $259 | 4 / 3 | 1,734 | 59 days on market | 0.04 mi |
| 1117 Shady Run Terrace | Active | $519,900 | $291 | 4 / 2 | 1,784 | 48 days on market | 0.07 mi |
| 908 Rhyolite Terrace | Active | $719,900 | $359 | 4 / 3 | 2,004 | 2 days on market | 0.14 mi |
| 824 Sandsprings Street | Active | $595,000 | $285 | 3 / 2 | 2,088 | 45 days on market | 0.24 mi |
| 1175 Calico Ridge Drive | Active | $499,000 | $279 | 3 / 2 | 1,790 | 14 days on market | 0.27 mi |
| 597 Via Paladini | Pending | $439,900 | $244 | 2 / 2 | 1,802 | 175 days on market | 0.27 mi |
| 587 Via Malloconni | Sold | $420,000 | $233 | 3 / 2 | 1,802 | Sold 2026-05-01 | 0.31 mi |
| 1013 Armillaria Street | Sold | $575,000 | $287 | 4 / 3 | 2,006 | Sold 2026-09-15 | 0.54 mi |
| 581 Via Medici | Active | $475,000 | $272 | 3 / 3 | 1,745 | 0 days on market | 0.55 mi |
| 1012 Weatherboard Street | Active | $395,000 | $273 | 2 / 2 | 1,448 | 1 days on market | 0.56 mi |
| 1273 Olivia Parkway | Active | $515,000 | $308 | 3 / 2 | 1,674 | 156 days on market | 0.67 mi |
| 1022 Majesty Court | Pending | $425,000 | $294 | 3 / 2 | 1,448 | 87 days on market | 0.69 mi |


