
Comparable Sales Near 359 Saint Andrew Street, Pahrump, NV 89048
1st Realty · Comparable sales report · 1st.estate · October 20, 2026
359 Saint Andrew Street, Pahrump, NV 89048
Status: Sold
$140,000 Sold Price
$141
$ / Sq Ft
995
Living Area
2,614 sqft
Lot Size
2
Beds
2
Baths
2019
Year Built
Search Parameters
Property Type
Status
Radius
Sold Within
Beds
Baths
Living Area (Sq Ft)
Lot Size (Sq Ft)
This comp search reflects your current search parameters — adjust the filters above as needed for a more accurate estimate.
Estimated Value
—
Average $/Sqft
—
Check one or more comps below to calculate an estimate.
Nearest 10 of 12 comparable sales and listings within 1 mile of this home. Use the filters above and press Search to refine.
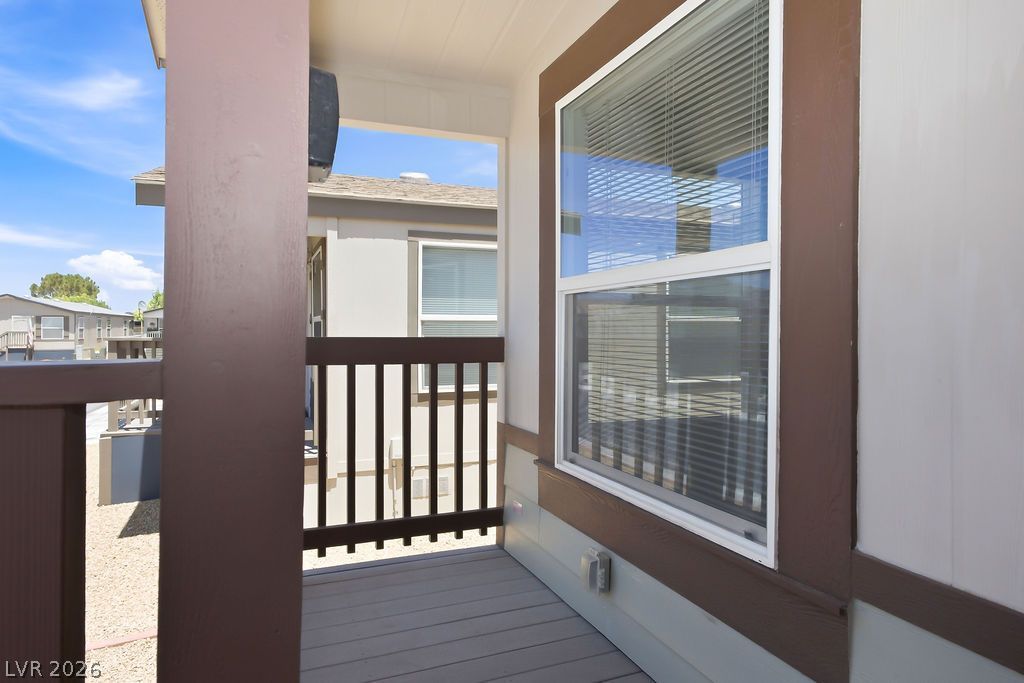
367 Myrtle Beach StreetActive
$199,9002 bd2 ba1,171 sqft$171/sqft0.03 mi8 days
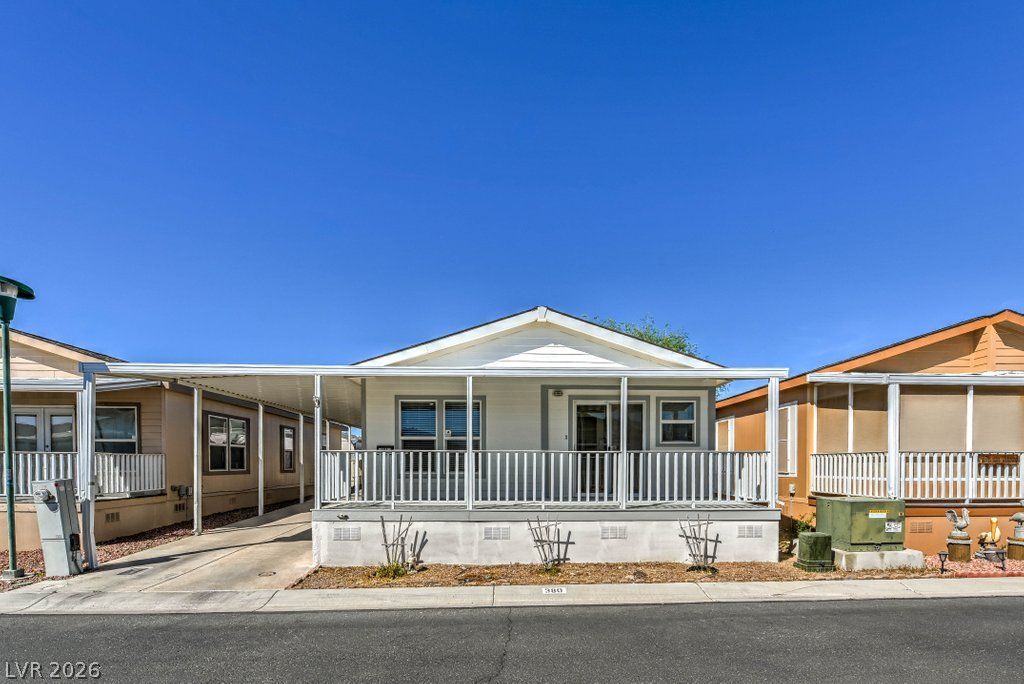
$197,5002 bd2 ba1,224 sqft$161/sqft0.05 mi7 daysSold 2026-08-07
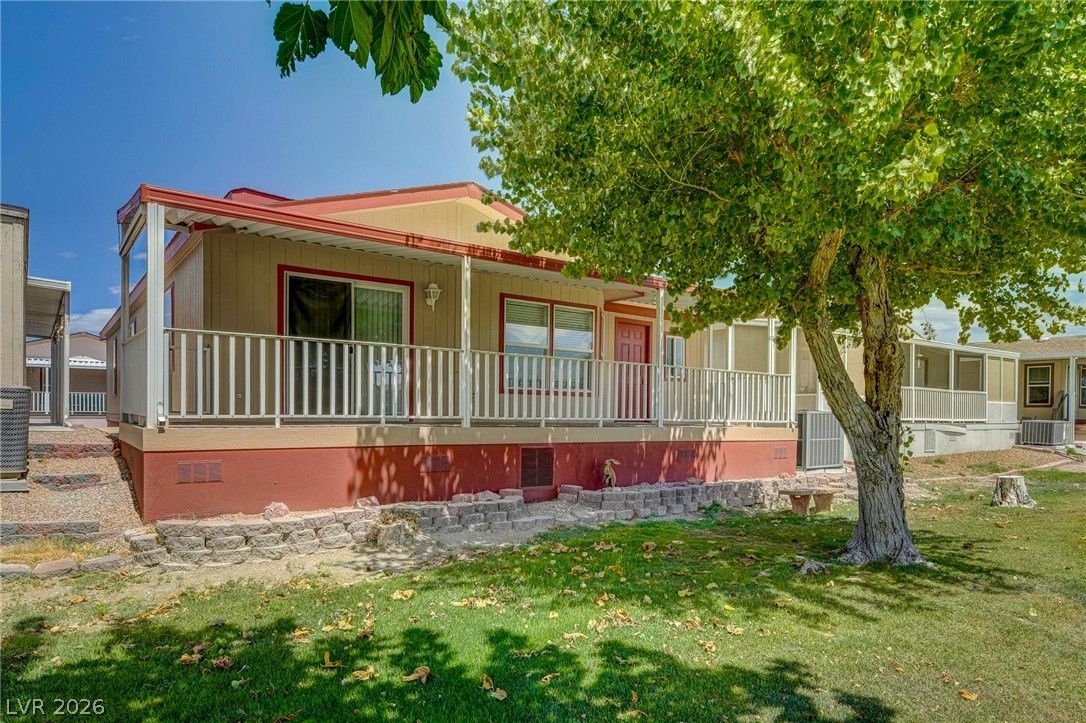
840 Montecito DriveActive
$234,0002 bd2 ba1,179 sqft$198/sqft0.06 mi49 days
$218,0002 bd2 ba1,053 sqft$207/sqft0.06 mi181 daysSold 2026-06-05
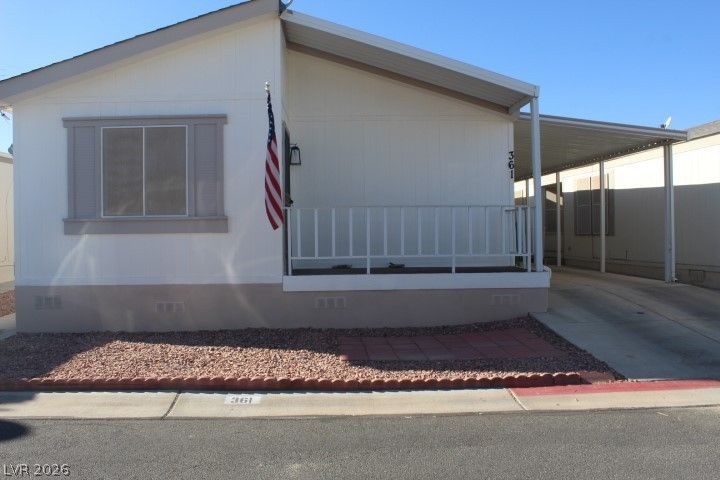
$225,0002 bd2 ba1,179 sqft$191/sqft0.10 mi15 days
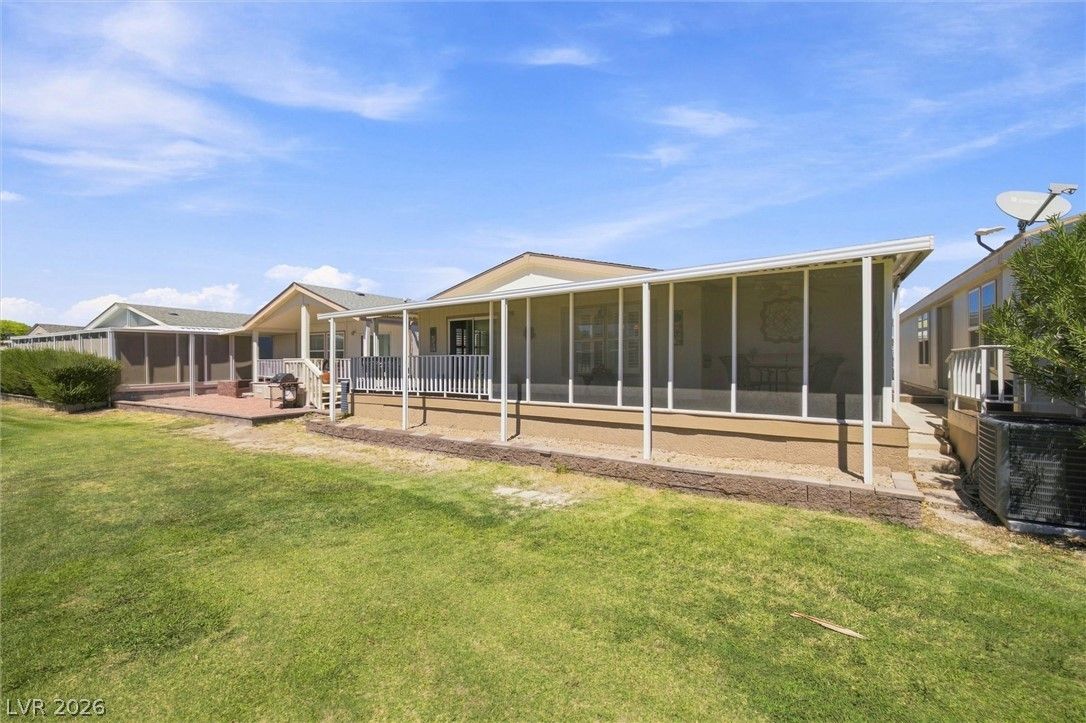
391 Inverness AvenueActive
$237,0002 bd2 ba1,201 sqft$197/sqft0.10 mi1 days
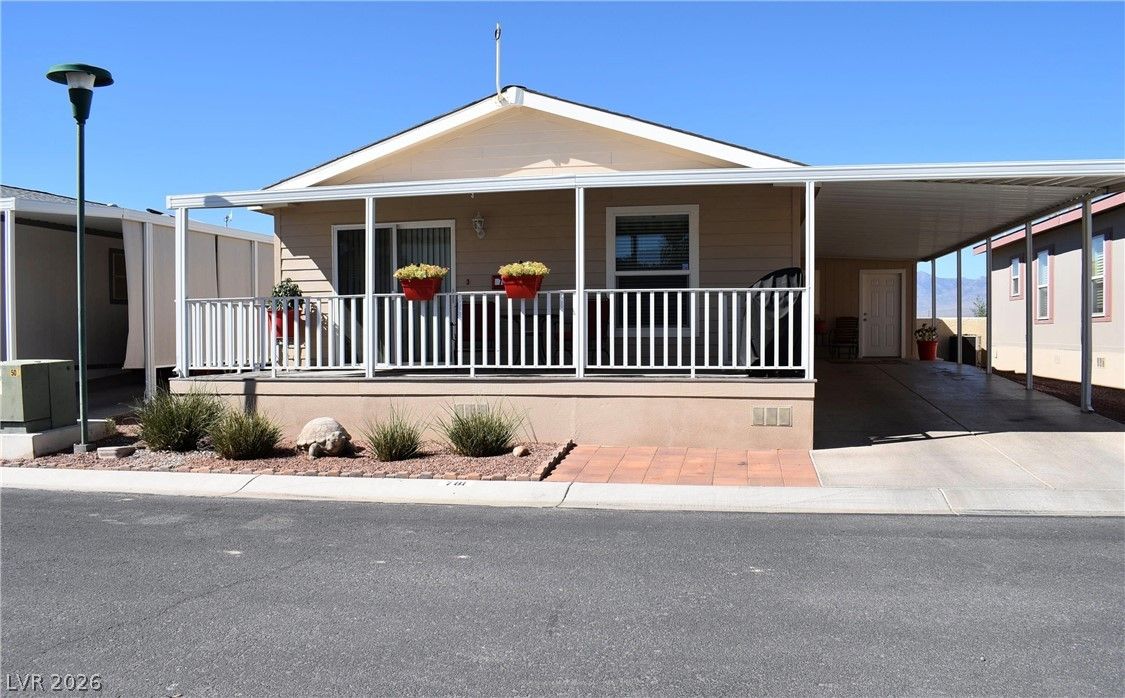
781 Montecito DriveActive
$222,0002 bd2 ba1,128 sqft$197/sqft0.11 mi3 days
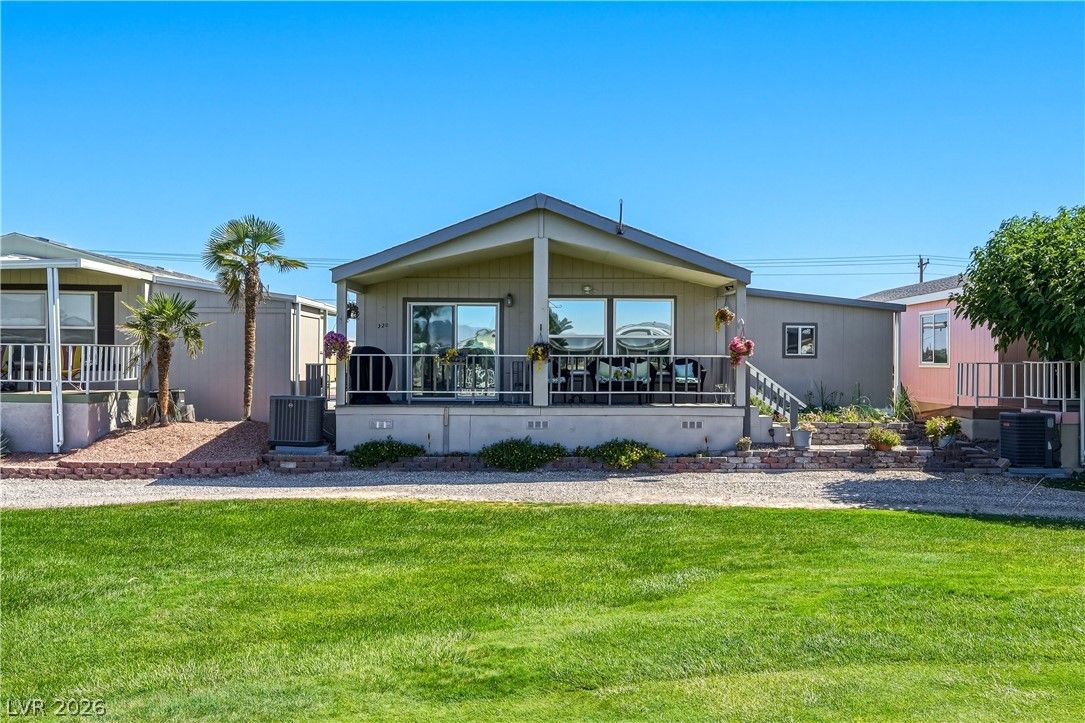
$212,0002 bd2 ba972 sqft$218/sqft0.14 mi99 daysSold 2026-09-22
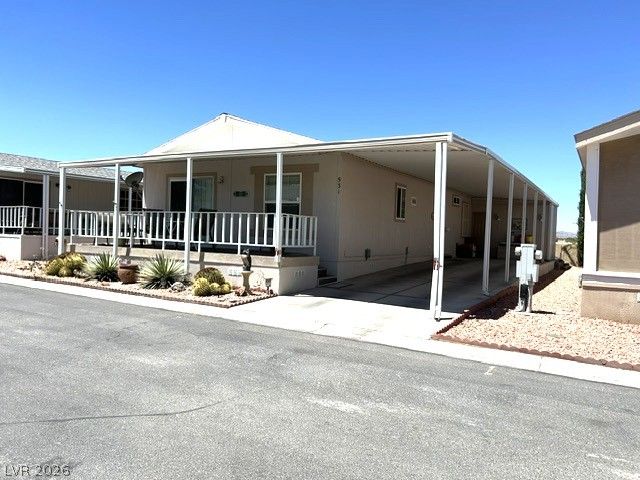
531 Montecito DriveActive
$209,0002 bd2 ba1,199 sqft$174/sqft0.16 mi76 days
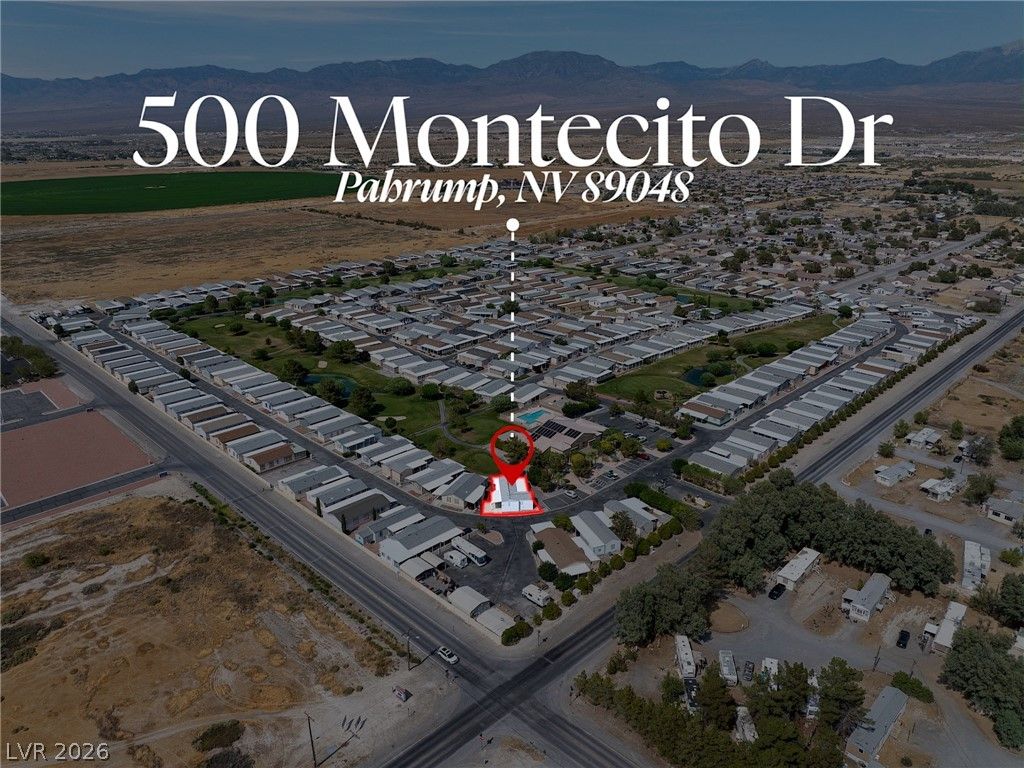
$170,0001 bd2 ba1,063 sqft$160/sqft0.16 mi2 daysSold 2026-08-20
Nearest comparable sales and listings
12 comparables · median price $212,000 · range $165,000 – $237,000 · median $/sq ft $194 · average $/sq ft $189
| Address | Status | Price | $/Sq Ft | Bd / Ba | Sq Ft | Sold / market time | Distance |
|---|---|---|---|---|---|---|---|
| 367 Myrtle Beach Street | Active | $199,900 | $171 | 2 / 2 | 1,171 | 8 days on market | 0.03 mi |
| 380 Bel Air Avenue | Sold | $197,500 | $161 | 2 / 2 | 1,224 | Sold 2026-08-07 | 0.05 mi |
| 840 Montecito Drive | Active | $234,000 | $198 | 2 / 2 | 1,179 | 49 days on market | 0.06 mi |
| 410 Bel Air Avenue | Sold | $218,000 | $207 | 2 / 2 | 1,053 | Sold 2026-06-05 | 0.06 mi |
| 361 West INVERNESS Avenue | Active | $225,000 | $191 | 2 / 2 | 1,179 | 15 days on market | 0.10 mi |
| 391 Inverness Avenue | Active | $237,000 | $197 | 2 / 2 | 1,201 | 1 days on market | 0.10 mi |
| 781 Montecito Drive | Active | $222,000 | $197 | 2 / 2 | 1,128 | 3 days on market | 0.11 mi |
| 320 Montecito Drive | Sold | $212,000 | $218 | 2 / 2 | 972 | Sold 2026-09-22 | 0.14 mi |
| 531 Montecito Drive | Active | $209,000 | $174 | 2 / 2 | 1,199 | 76 days on market | 0.16 mi |
| 500 Montecito Drive 115 | Sold | $170,000 | $160 | 1 / 2 | 1,063 | Sold 2026-08-20 | 0.16 mi |
| 211 Montecito Drive | Sold | $165,000 | $172 | 2 / 2 | 960 | Sold 2026-04-27 | 0.16 mi |
| 221 Montecito Drive | Active | $212,000 | $221 | 2 / 2 | 960 | 62 days on market | 0.17 mi |


