
Comparable Sales Near 148 Macoby Run Street, Las Vegas, NV 89148
1st Realty · Comparable sales report · 1st.estate · October 20, 2026
Read the Rhodes Ranch neighborhood guide →
148 Macoby Run Street, Las Vegas, NV 89148
Status: Sold
$2,995 Sold Price
$1
$ / Sq Ft
3,027
Living Area
4,792 sqft
Lot Size
5
Beds
3
Baths
2003
Year Built
Search Parameters
Property Type
Status
Radius
Sold Within
Beds
Baths
Living Area (Sq Ft)
Lot Size (Sq Ft)
This comp search reflects your current search parameters — adjust the filters above as needed for a more accurate estimate.
Estimated Value
—
Average $/Sqft
—
Check one or more comps below to calculate an estimate.
Nearest 10 of 21 comparable sales and listings within 1 mile of this home. Use the filters above and press Search to refine.
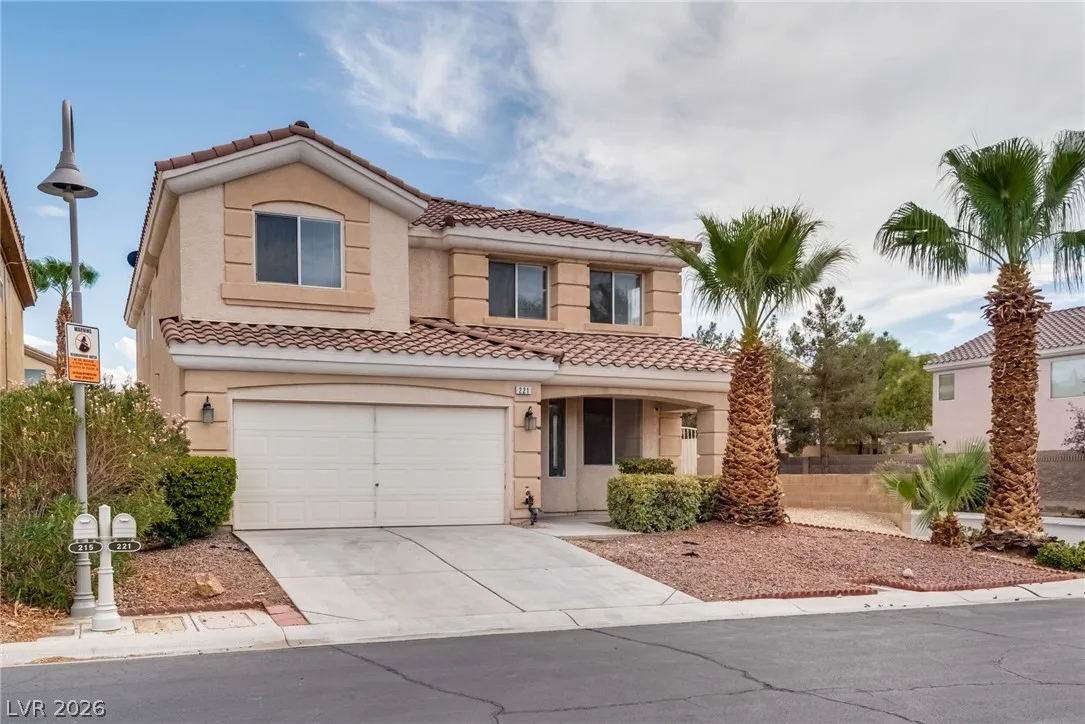
$539,0005 bd3 ba2,886 sqft$187/sqft0.12 mi0 days
$522,5004 bd3 ba2,886 sqft$181/sqft0.12 mi84 daysSold 2026-06-18
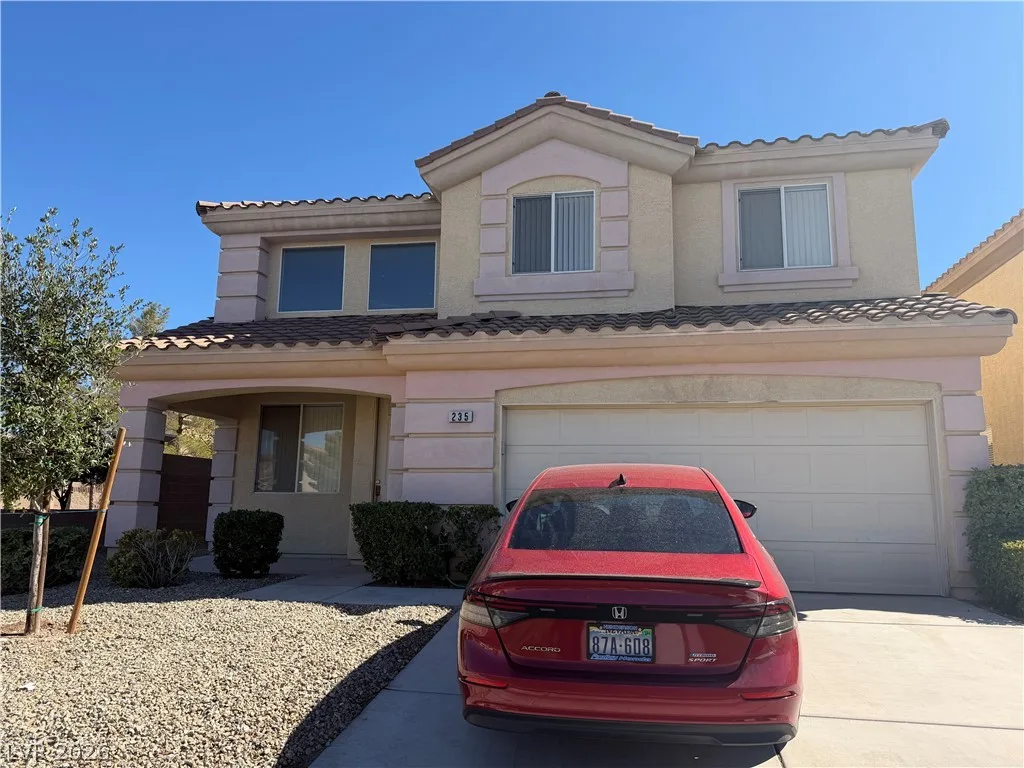
$514,9004 bd4 ba2,780 sqft$185/sqft0.17 mi18 days
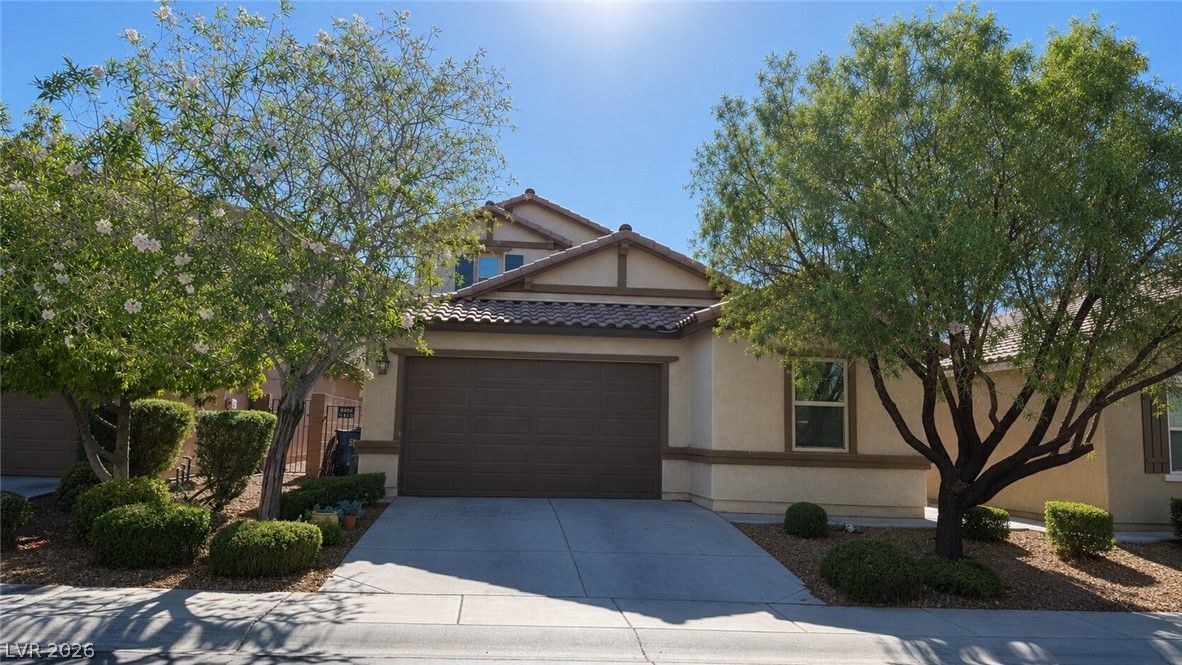
7455 Rainford StreetPending
$500,0004 bd3 ba2,275 sqft$220/sqft0.23 mi75 days
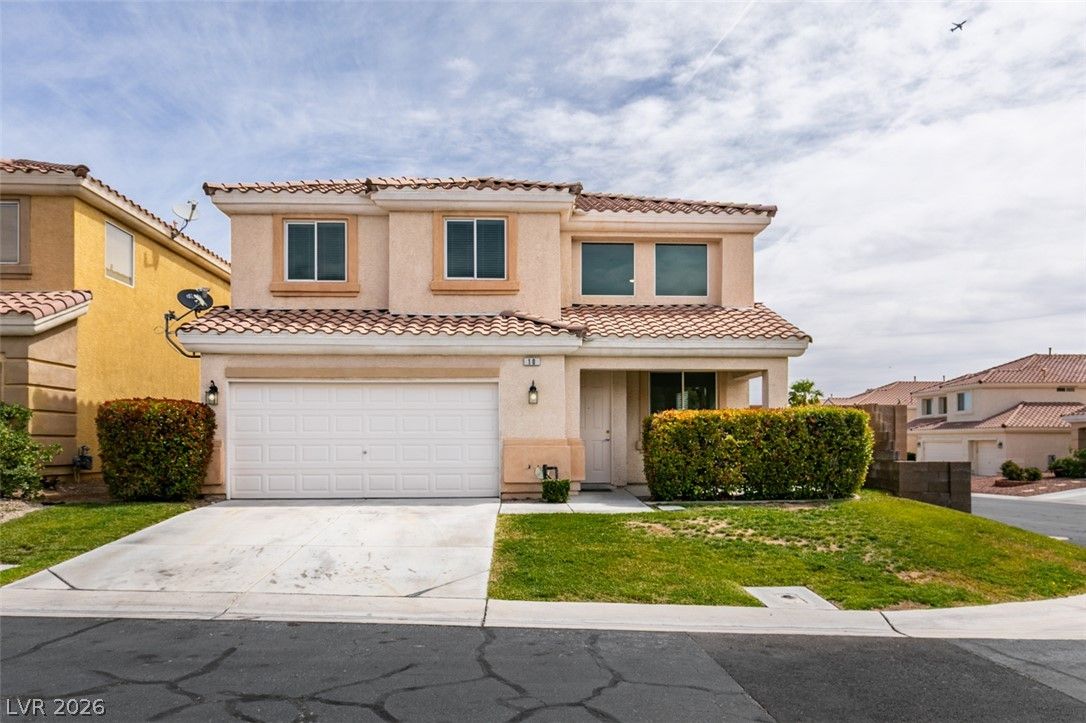
10 Indian Run WayActive
$549,0006 bd4 ba2,780 sqft$197/sqft0.30 mi108 days
$565,0004 bd4 ba2,780 sqft$203/sqft0.30 mi66 daysSold 2026-07-03
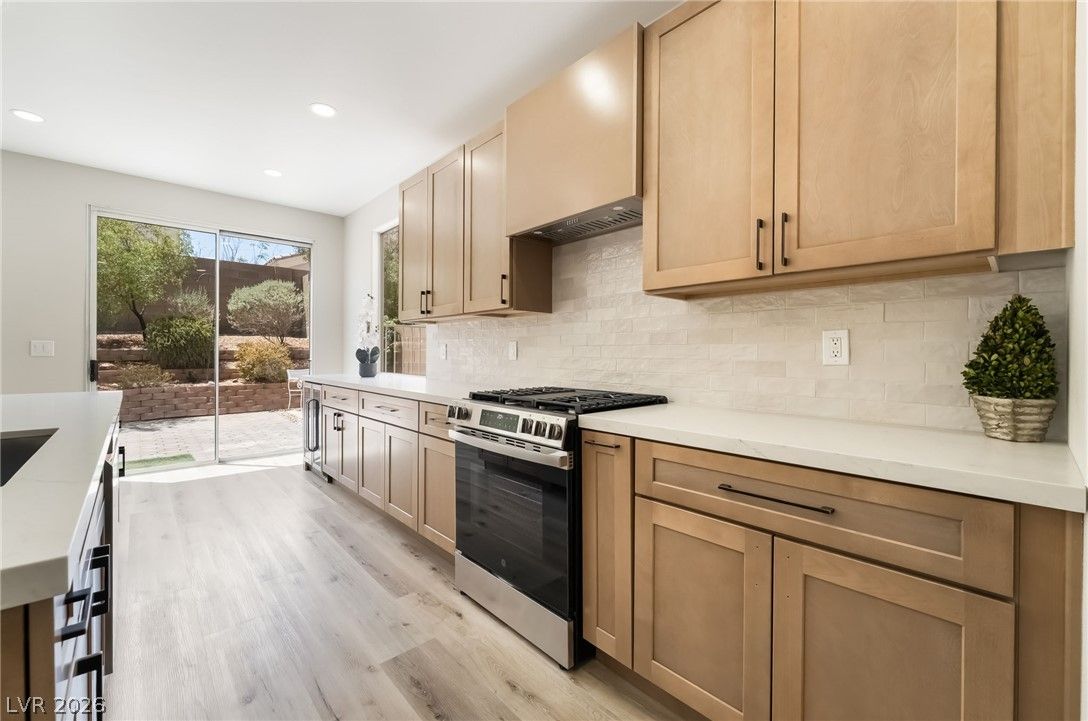
$635,0004 bd4 ba2,780 sqft$228/sqft0.30 mi19 daysSold 2026-09-15
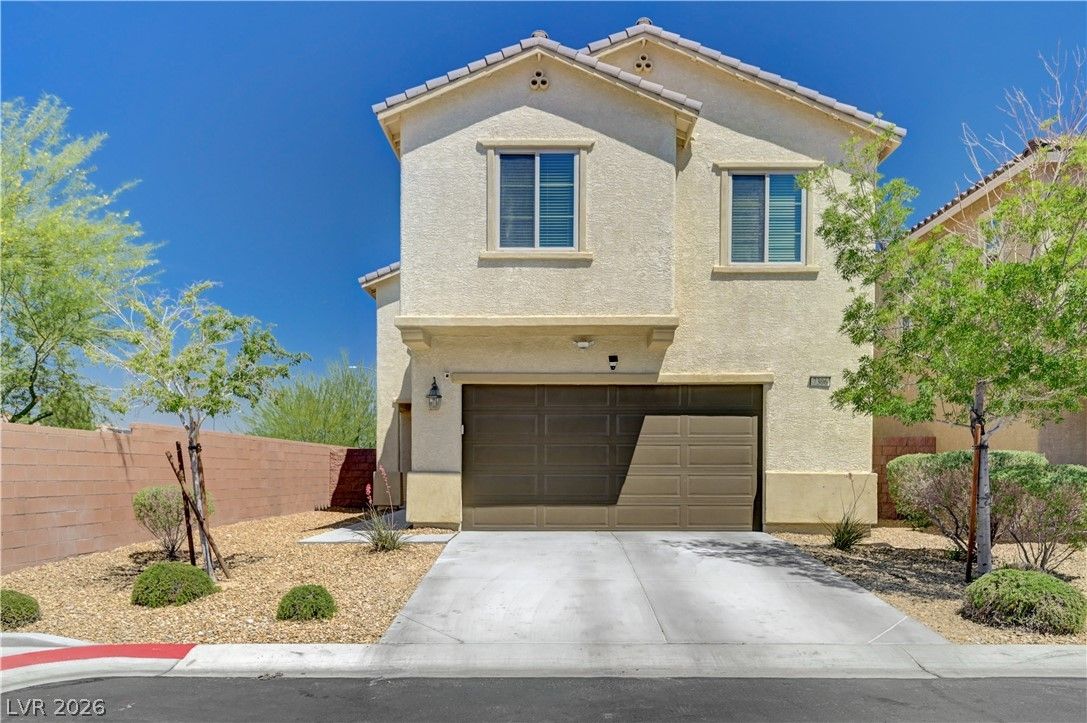
7306 Rainford StreetActive
$568,9004 bd4 ba2,634 sqft$216/sqft0.31 mi40 days
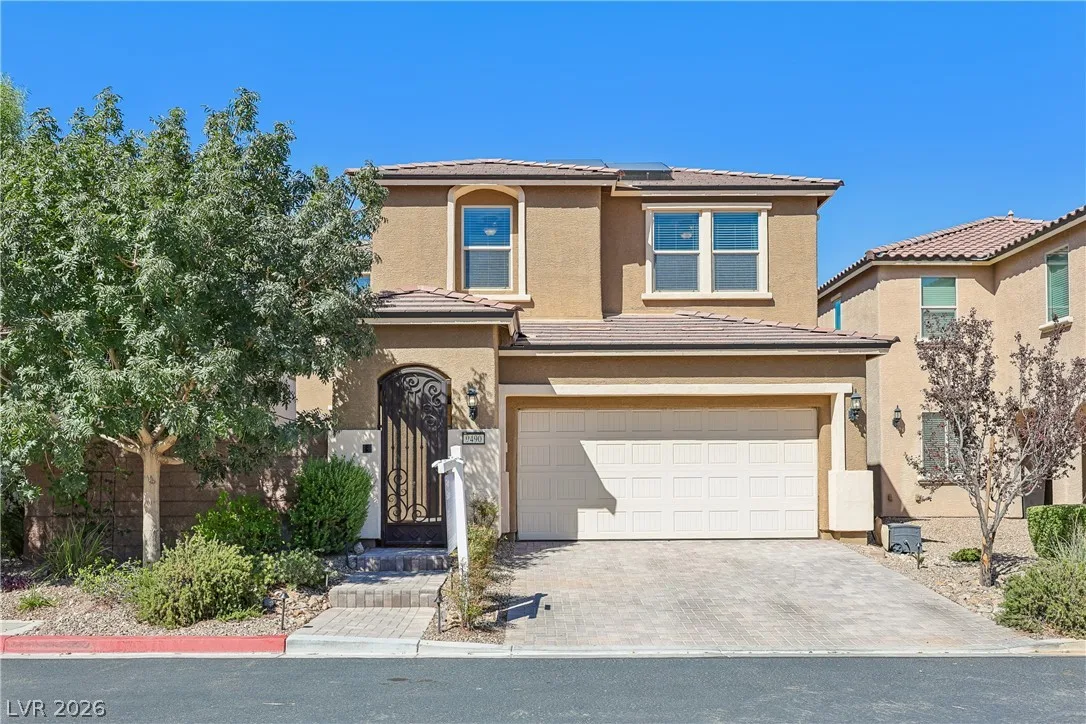
9490 Wild Valley AvenueActive
$749,9905 bd4 ba3,212 sqft$233/sqft0.49 mi23 days
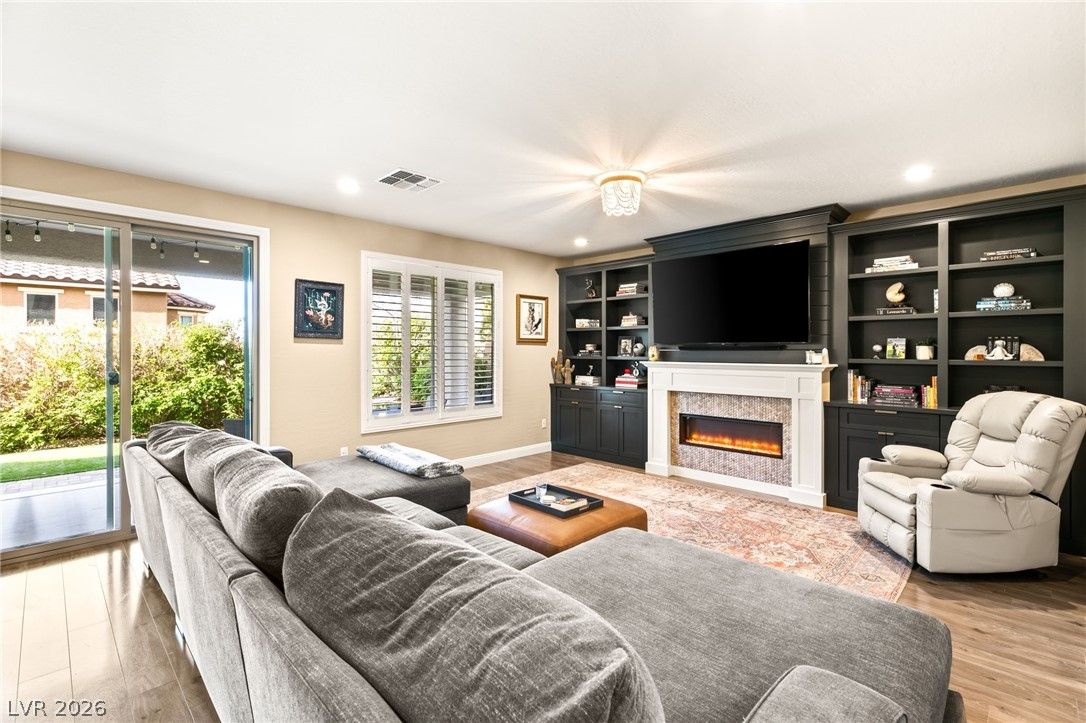
9514 Wild Valley AvenueActive
$745,0004 bd4 ba3,386 sqft$220/sqft0.52 mi91 days
Nearest comparable sales and listings
12 comparables · median price $566,950 · range $500,000 – $749,990 · median $/sq ft $218 · average $/sq ft $214
| Address | Status | Price | $/Sq Ft | Bd / Ba | Sq Ft | Sold / market time | Distance |
|---|---|---|---|---|---|---|---|
| 221 Lenape Heights Avenue | Active | $539,000 | $187 | 5 / 3 | 2,886 | 0 days on market | 0.12 mi |
| 178 Flying Hills Avenue | Sold | $522,500 | $181 | 4 / 3 | 2,886 | Sold 2026-06-18 | 0.12 mi |
| 235 Hickory Heights Avenue | Active | $514,900 | $185 | 4 / 4 | 2,780 | 18 days on market | 0.17 mi |
| 7455 Rainford Street | Pending | $500,000 | $220 | 4 / 3 | 2,275 | 75 days on market | 0.23 mi |
| 10 Indian Run Way | Active | $549,000 | $197 | 6 / 4 | 2,780 | 108 days on market | 0.30 mi |
| 31 Indian Run Way | Sold | $565,000 | $203 | 4 / 4 | 2,780 | Sold 2026-07-03 | 0.30 mi |
| 251 Crooked Tree Drive | Sold | $635,000 | $228 | 4 / 4 | 2,780 | Sold 2026-09-15 | 0.30 mi |
| 7306 Rainford Street | Active | $568,900 | $216 | 4 / 4 | 2,634 | 40 days on market | 0.31 mi |
| 9490 Wild Valley Avenue | Active | $749,990 | $233 | 5 / 4 | 3,212 | 23 days on market | 0.49 mi |
| 9514 Wild Valley Avenue | Active | $745,000 | $220 | 4 / 4 | 3,386 | 91 days on market | 0.52 mi |
| 225 Fox Lake Avenue | Sold | $635,000 | $273 | 4 / 3 | 2,322 | Sold 2026-05-29 | 0.57 mi |
| 236 Fox Lake Avenue | Active | $665,000 | $224 | 4 / 3 | 2,964 | 3 days on market | 0.58 mi |


