
Comparable Sales Near 9740 Northern Dancer Drive, Las Vegas, NV 89117
1st Realty · Comparable sales report · 1st.estate · October 20, 2026
Read the Spring Valley neighborhood guide →
9740 Northern Dancer Drive, Las Vegas, NV 89117
Status: Sold
$2,500 Sold Price
$1
$ / Sq Ft
2,234
Living Area
5,227 sqft
Lot Size
4
Beds
3
Baths
1997
Year Built
Search Parameters
Property Type
Status
Radius
Sold Within
Beds
Baths
Living Area (Sq Ft)
Lot Size (Sq Ft)
This comp search reflects your current search parameters — adjust the filters above as needed for a more accurate estimate.
Estimated Value
—
Average $/Sqft
—
Check one or more comps below to calculate an estimate.
Nearest 10 of 72 comparable sales and listings within 1 mile of this home. Use the filters above and press Search to refine.
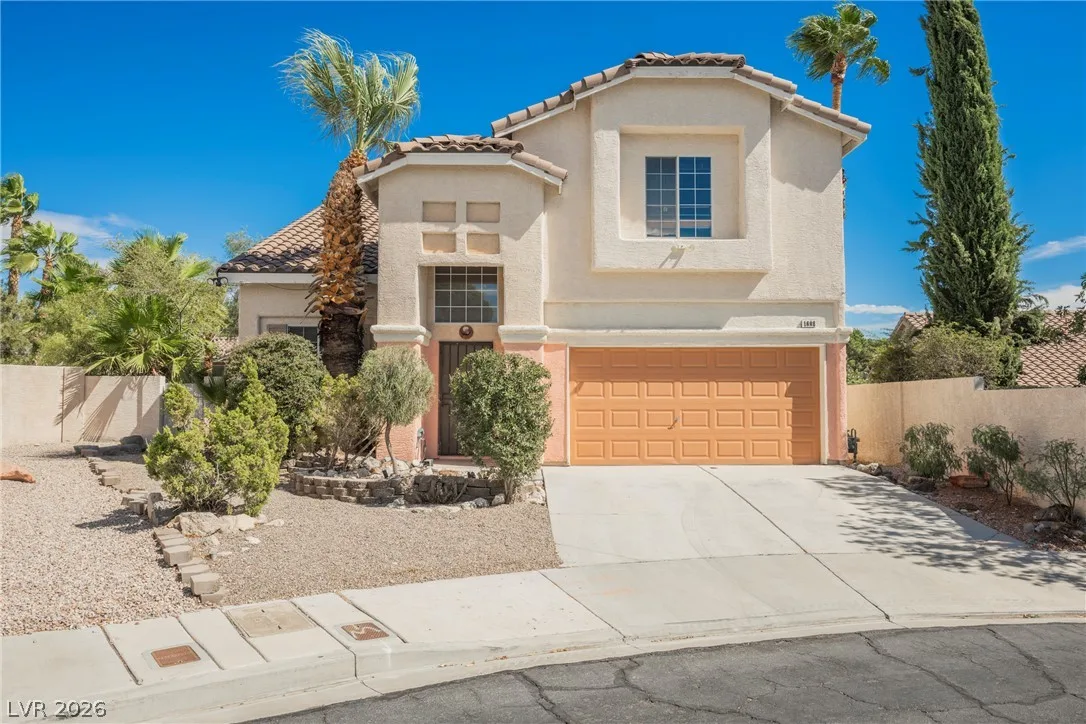
1608 Saddle Rock CircleActive
$495,0004 bd4 ba2,235 sqft$221/sqft0.02 mi18 days
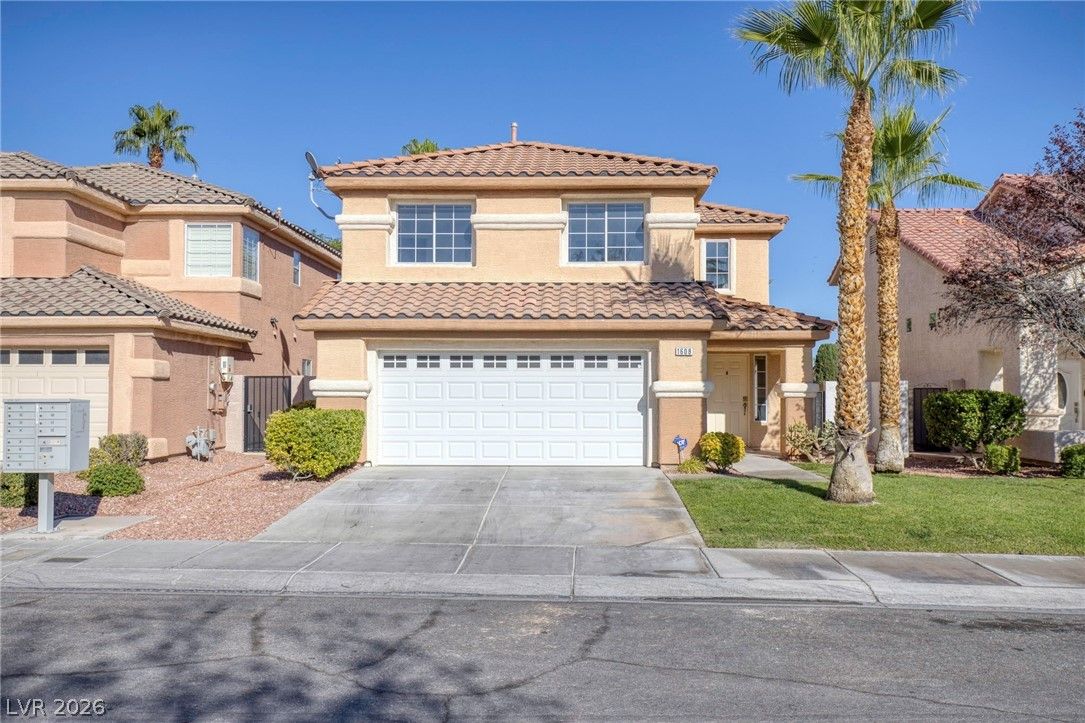
$555,0003 bd3 ba2,254 sqft$246/sqft0.09 mi31 daysSold 2026-07-31
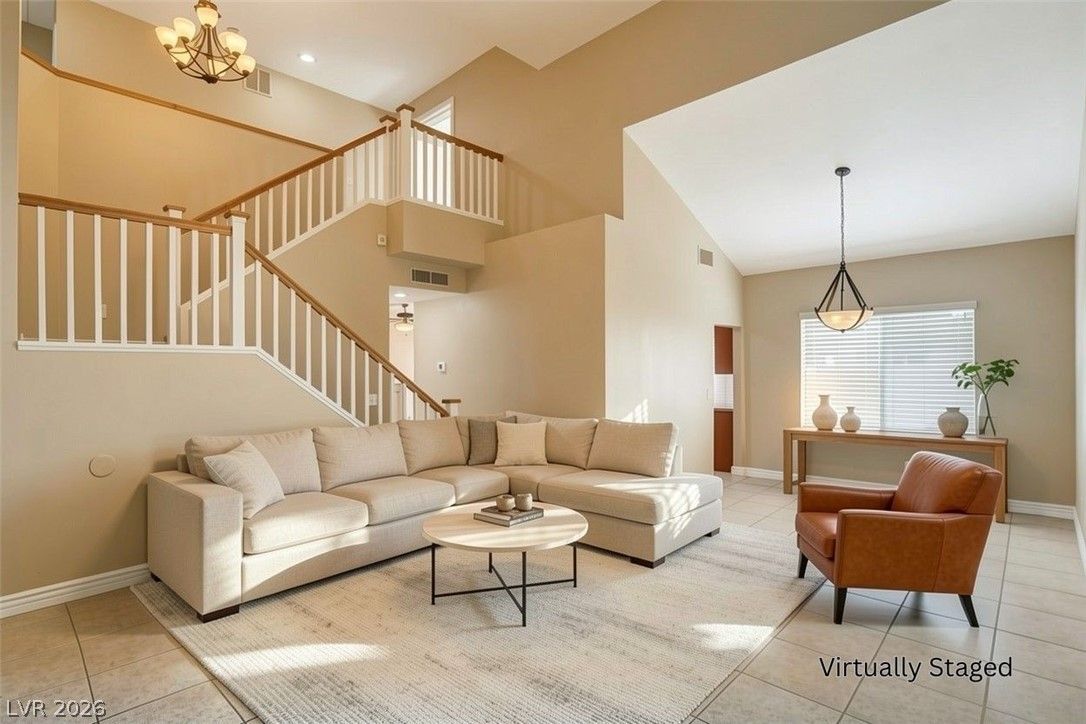
$455,0003 bd3 ba1,755 sqft$259/sqft0.10 mi59 days
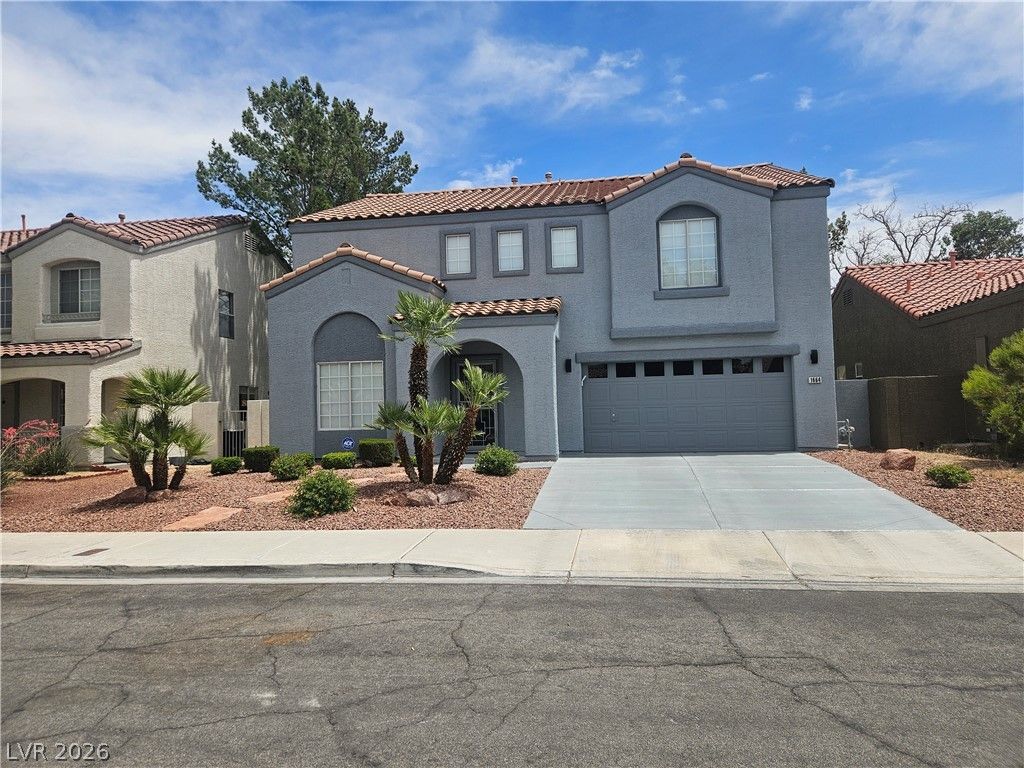
$450,0004 bd3 ba2,404 sqft$187/sqft0.10 mi59 daysSold 2026-08-21
$482,0003 bd3 ba2,016 sqft$239/sqft0.11 mi31 daysSold 2026-06-05
$468,0003 bd2 ba1,693 sqft$276/sqft0.12 mi45 daysSold 2026-07-10
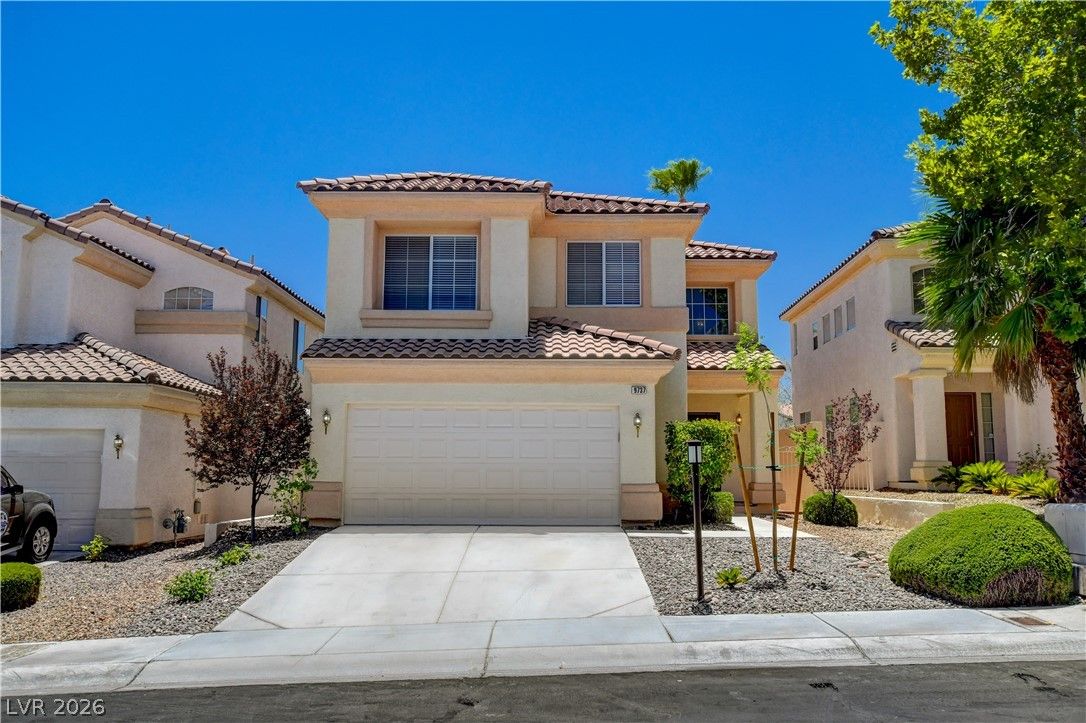
$466,0003 bd3 ba1,950 sqft$239/sqft0.13 mi48 daysSold 2026-09-23
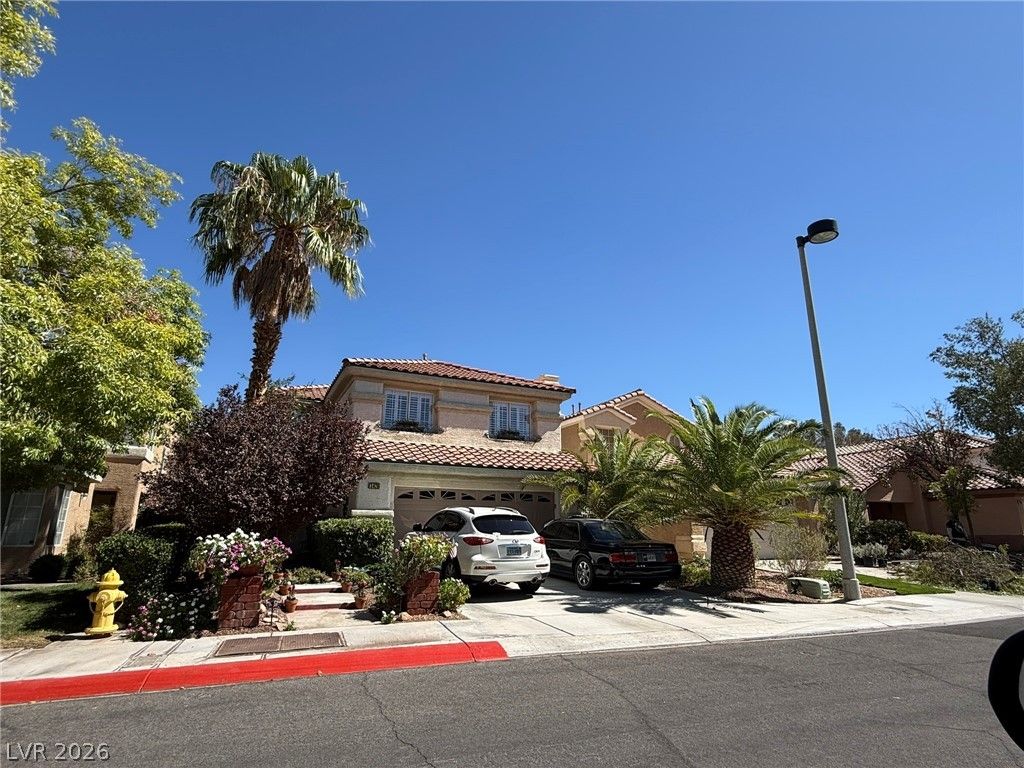
$545,0003 bd3 ba2,254 sqft$242/sqft0.14 mi28 days
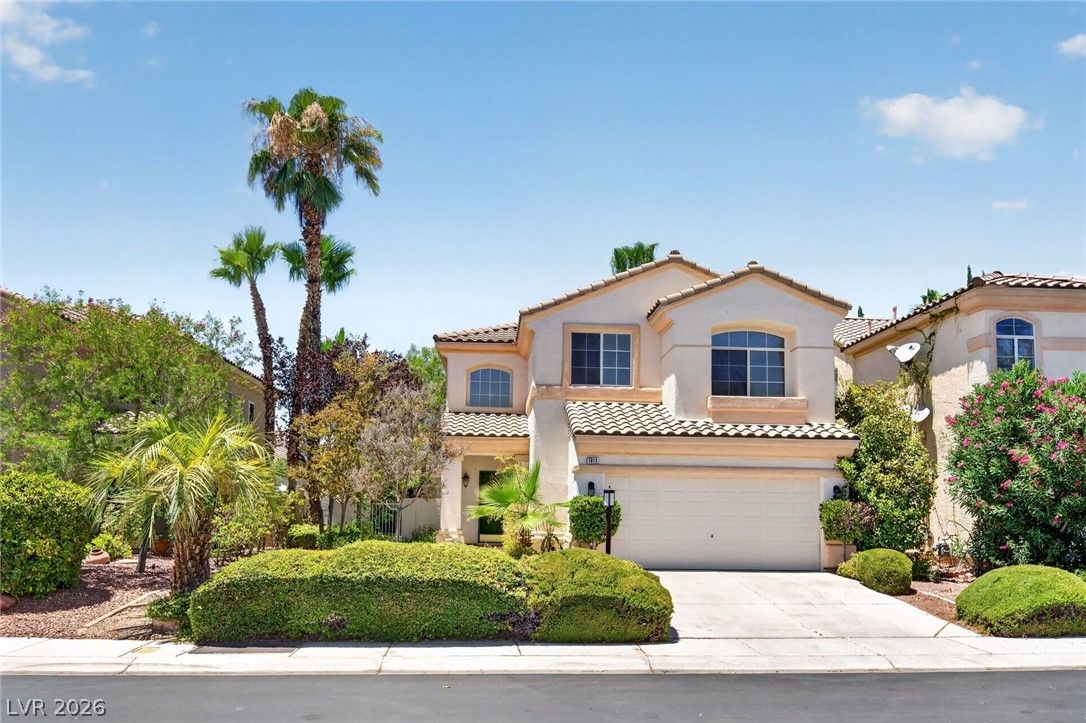
$515,0003 bd3 ba1,950 sqft$264/sqft0.18 mi4 daysSold 2026-07-28
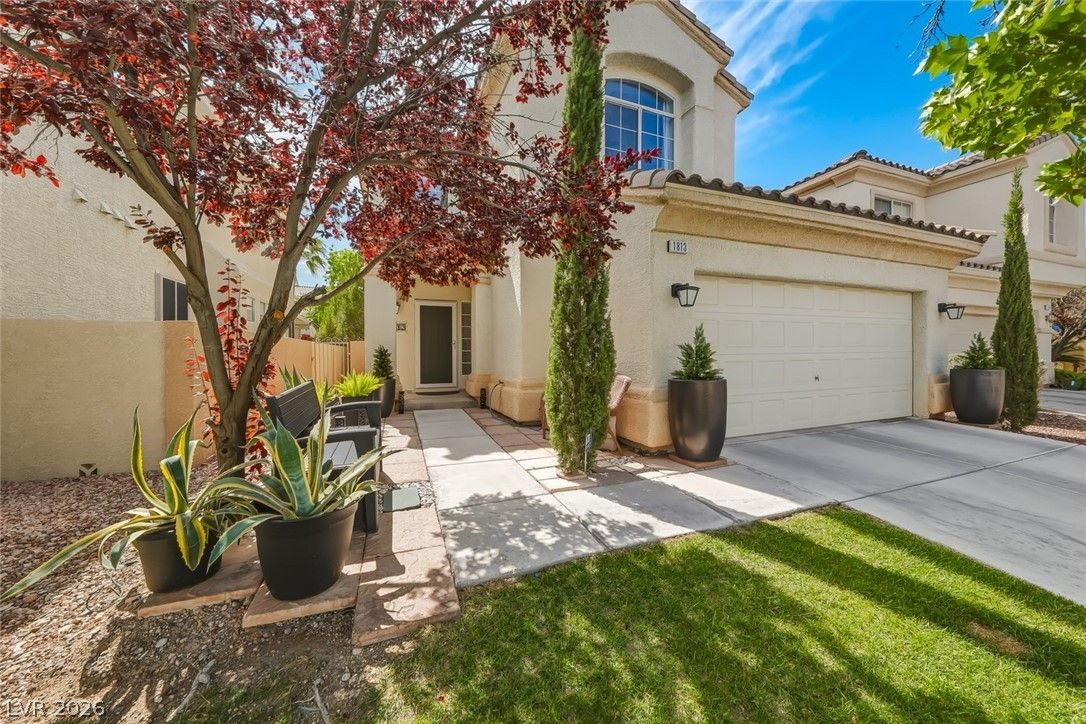
$550,0003 bd3 ba1,846 sqft$298/sqft0.18 mi16 daysSold 2026-08-11
Nearest comparable sales and listings
12 comparables · median price $488,500 · range $450,000 – $655,000 · median $/sq ft $248 · average $/sq ft $249
| Address | Status | Price | $/Sq Ft | Bd / Ba | Sq Ft | Sold / market time | Distance |
|---|---|---|---|---|---|---|---|
| 1608 Saddle Rock Circle | Active | $495,000 | $221 | 4 / 4 | 2,235 | 18 days on market | 0.02 mi |
| 1608 Calle Montery Street | Sold | $555,000 | $246 | 3 / 3 | 2,254 | Sold 2026-07-31 | 0.09 mi |
| 1612 Country Hollow Drive | Active | $455,000 | $259 | 3 / 3 | 1,755 | 59 days on market | 0.10 mi |
| 1664 Shifting Winds Street | Sold | $450,000 | $187 | 4 / 3 | 2,404 | Sold 2026-08-21 | 0.10 mi |
| 9744 Lost Colt Circle | Sold | $482,000 | $239 | 3 / 3 | 2,016 | Sold 2026-06-05 | 0.11 mi |
| 9752 LOST COLT Circle | Sold | $468,000 | $276 | 3 / 2 | 1,693 | Sold 2026-07-10 | 0.12 mi |
| 9737 Ravine Avenue | Sold | $466,000 | $239 | 3 / 3 | 1,950 | Sold 2026-09-23 | 0.13 mi |
| 1428 Calle Montery Street | Active | $545,000 | $242 | 3 / 3 | 2,254 | 28 days on market | 0.14 mi |
| 1813 Warrenville Street | Sold | $515,000 | $264 | 3 / 3 | 1,950 | Sold 2026-07-28 | 0.18 mi |
| 1813 Havercamp Street | Sold | $550,000 | $298 | 3 / 3 | 1,846 | Sold 2026-08-11 | 0.18 mi |
| 1624 British Cup Drive | Pending | $455,000 | $250 | 3 / 3 | 1,820 | 70 days on market | 0.21 mi |
| 9808 Dusty Winds Avenue | Sold | $655,000 | $267 | 4 / 3 | 2,457 | Sold 2026-04-24 | 0.21 mi |


