
Comparable Sales Near 2800 Desert Song Drive, Las Vegas, NV 89106
1st Realty · Comparable sales report · 1st.estate · October 21, 2026
Browse our Las Vegas area guides →
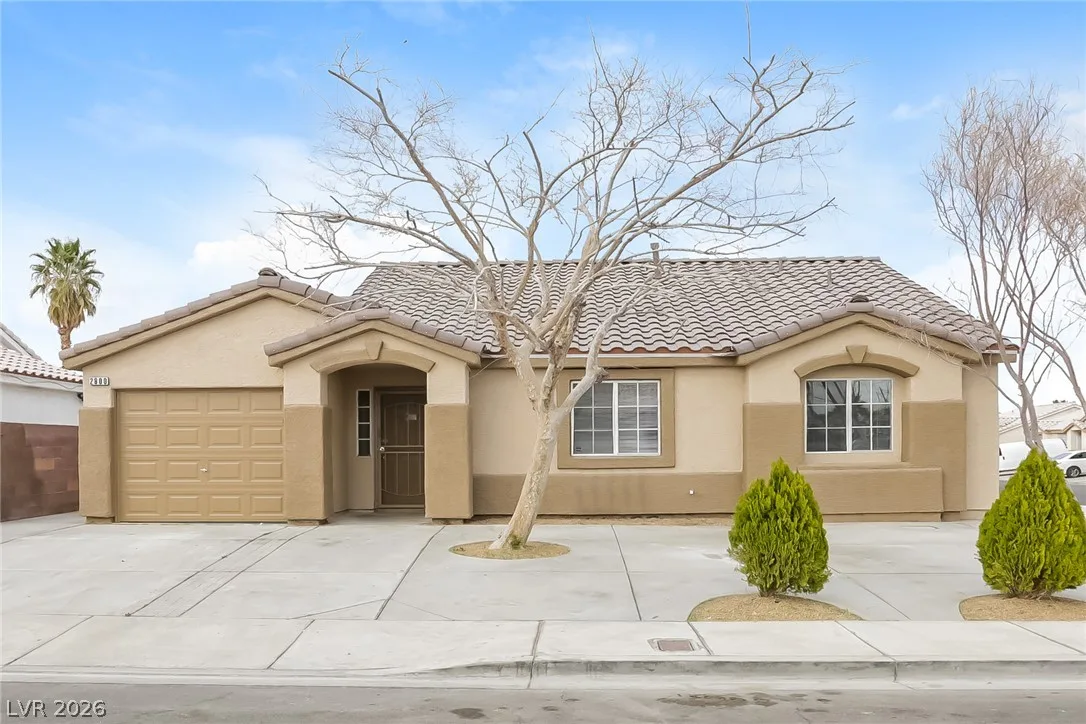
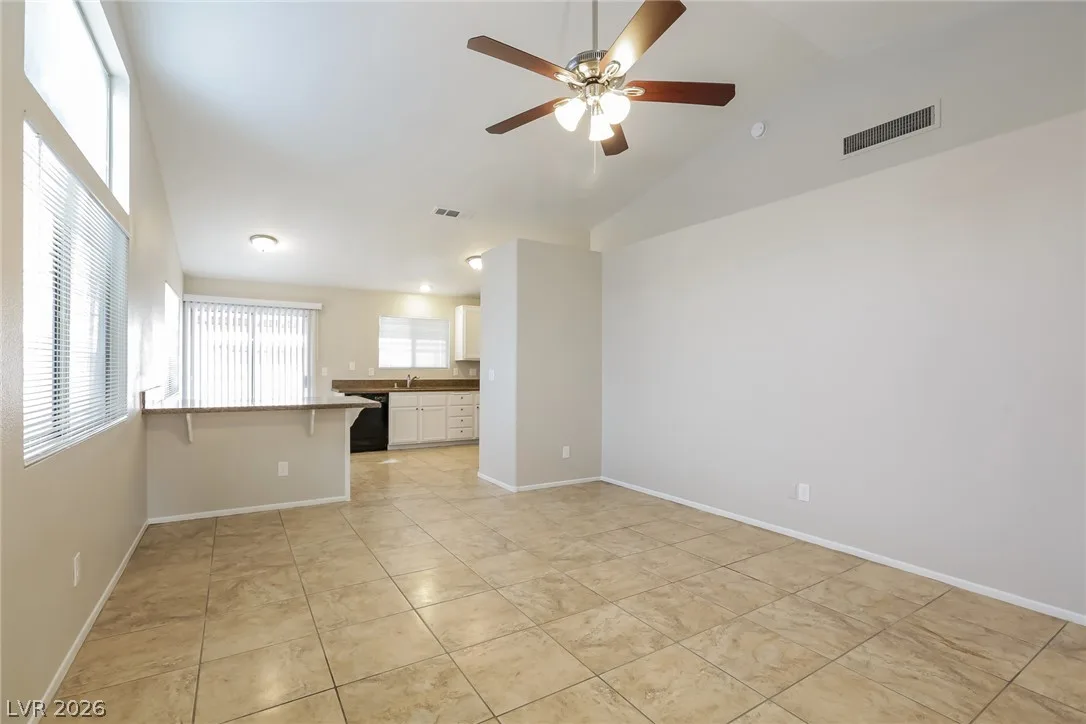
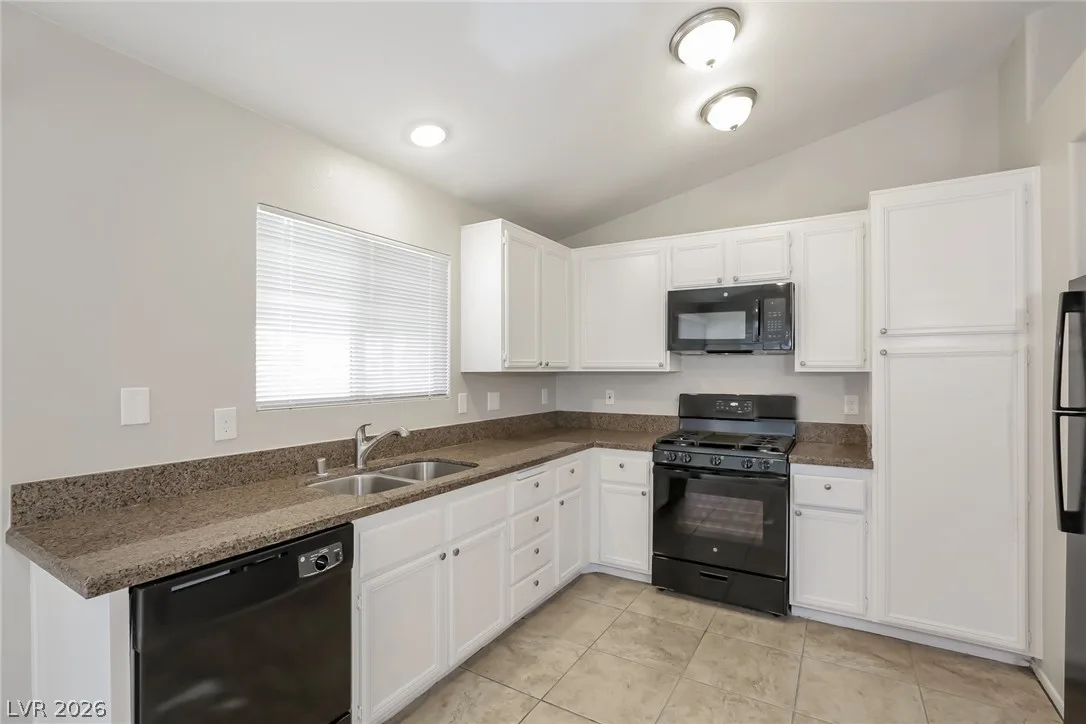
2800 Desert Song Drive, Las Vegas, NV 89106
Status: For Rent
$2,100 List Price
$2
$ / Sq Ft
1,309
Living Area
3,920 sqft
Lot Size
4
Beds
2
Baths
1993
Year Built
Search Parameters
Property Type
Status
Radius
Sold Within
Beds
Baths
Living Area (Sq Ft)
Lot Size (Sq Ft)
This comp search reflects your current search parameters — adjust the filters above as needed for a more accurate estimate.
Estimated Value
—
Average $/Sqft
—
Check one or more comps below to calculate an estimate.
Nearest 10 of 30 comparable sales and listings within 1 mile of this home. Use the filters above and press Search to refine.
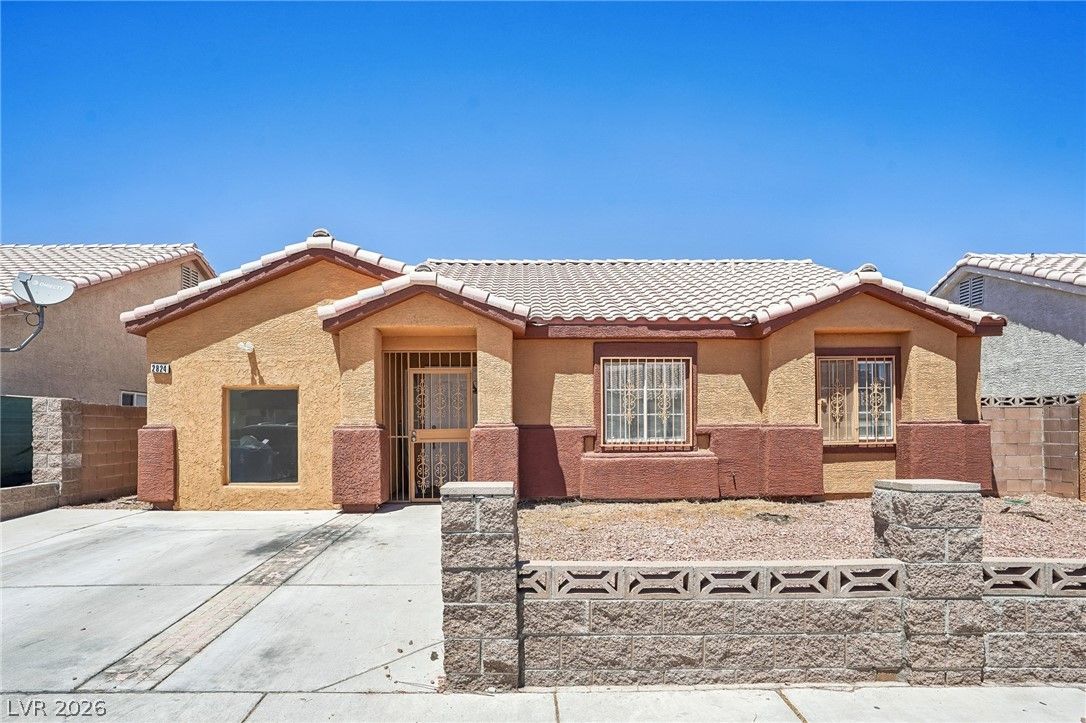
$330,0003 bd2 ba1,175 sqft$281/sqft0.09 mi15 daysSold 2026-09-17
$340,0003 bd2 ba1,220 sqft$279/sqft0.11 mi5 daysSold 2026-06-10
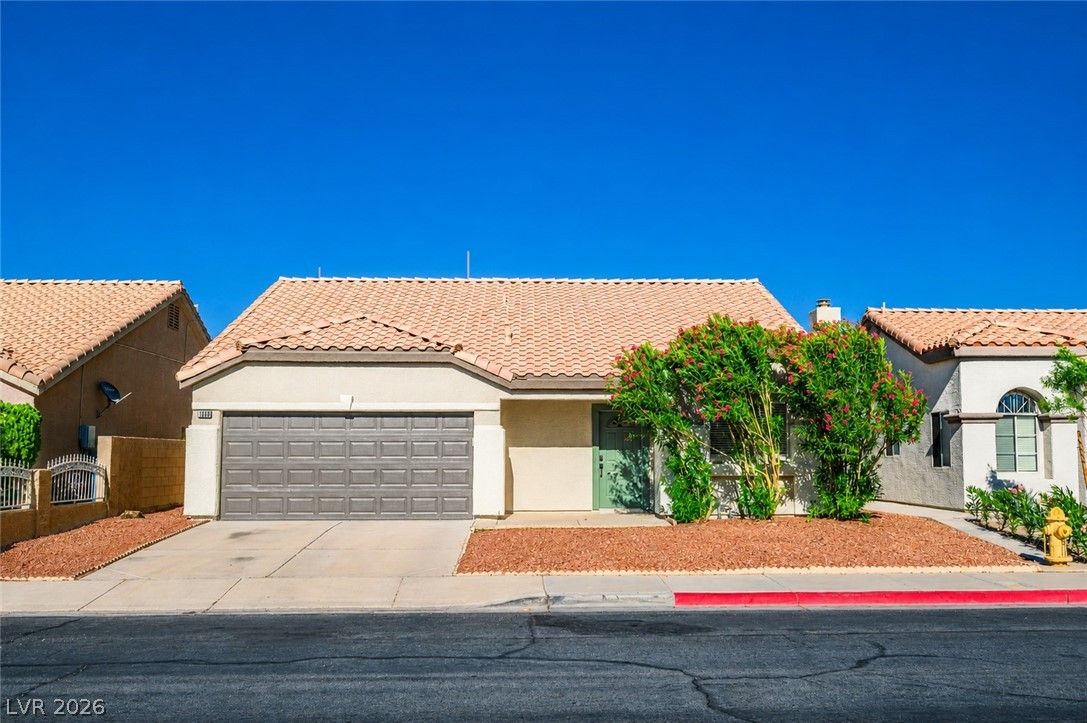
$375,0003 bd2 ba1,220 sqft$307/sqft0.12 mi6 daysSold 2026-07-30
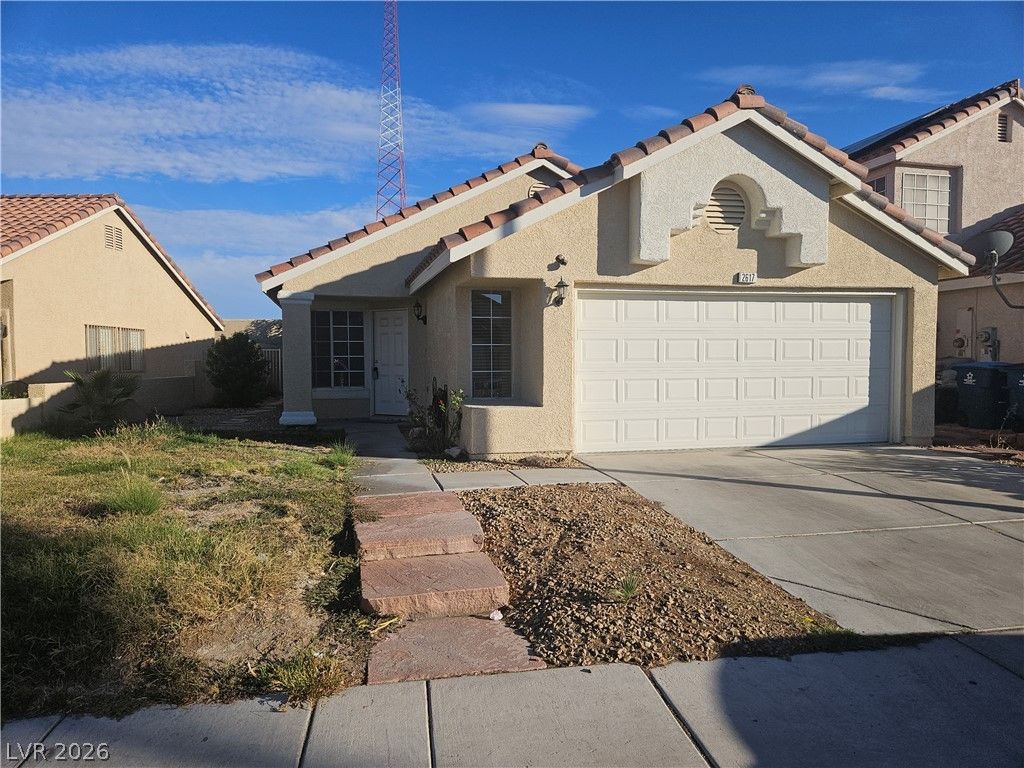
$360,0003 bd2 ba1,429 sqft$252/sqft0.14 mi6 daysSold 2026-10-16

2545 Rising Legend WayActive
$371,0004 bd2 ba1,429 sqft$260/sqft0.19 mi22 days
$390,5004 bd3 ba1,435 sqft$272/sqft0.28 mi16 daysSold 2026-05-01

2312 Shady Hill AvenueActive
$300,0003 bd2 ba1,096 sqft$274/sqft0.39 mi2 days
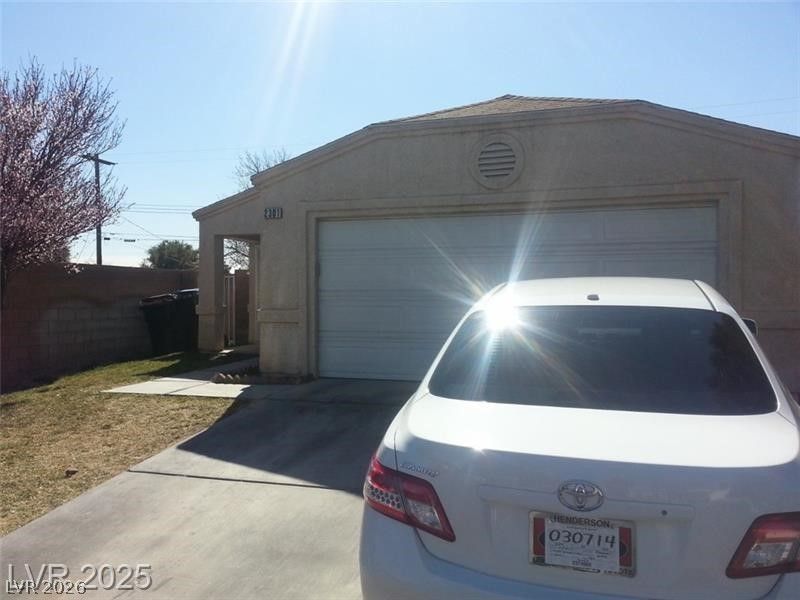
2301 Shady Hill AvenueActive
$349,9004 bd2 ba1,244 sqft$281/sqft0.40 mi0 days

2216 Abraham AvenueActive
$354,9903 bd3 ba1,311 sqft$271/sqft0.44 mi40 days
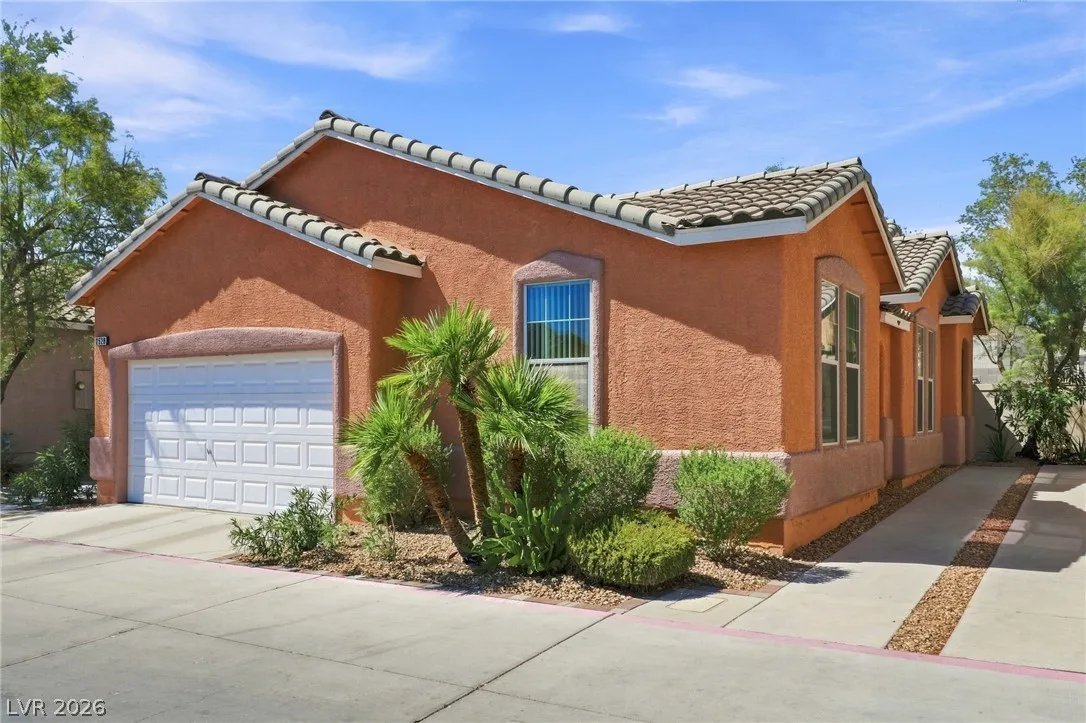
2528 Living Rock StreetActive
$329,9903 bd2 ba1,385 sqft$238/sqft0.45 mi14 days
Nearest comparable sales and listings
12 comparables · median price $357,495 · range $300,000 – $390,500 · median $/sq ft $273 · average $/sq ft $271
| Address | Status | Price | $/Sq Ft | Bd / Ba | Sq Ft | Sold / market time | Distance |
|---|---|---|---|---|---|---|---|
| 2824 Windstorm Avenue | Sold | $330,000 | $281 | 3 / 2 | 1,175 | Sold 2026-09-17 | 0.09 mi |
| 2900 Windstorm Avenue | Sold | $340,000 | $279 | 3 / 2 | 1,220 | Sold 2026-06-10 | 0.11 mi |
| 1808 Crystal Chimes Drive | Sold | $375,000 | $307 | 3 / 2 | 1,220 | Sold 2026-07-30 | 0.12 mi |
| 2617 Rising Legend Way | Sold | $360,000 | $252 | 3 / 2 | 1,429 | Sold 2026-10-16 | 0.14 mi |
| 2545 Rising Legend Way | Active | $371,000 | $260 | 4 / 2 | 1,429 | 22 days on market | 0.19 mi |
| 1712 Robin Street | Sold | $390,500 | $272 | 4 / 3 | 1,435 | Sold 2026-05-01 | 0.28 mi |
| 2312 Shady Hill Avenue | Active | $300,000 | $274 | 3 / 2 | 1,096 | 2 days on market | 0.39 mi |
| 2301 Shady Hill Avenue | Active | $349,900 | $281 | 4 / 2 | 1,244 | 0 days on market | 0.40 mi |
| 2216 Abraham Avenue | Active | $354,990 | $271 | 3 / 3 | 1,311 | 40 days on market | 0.44 mi |
| 2528 Living Rock Street | Active | $329,990 | $238 | 3 / 2 | 1,385 | 14 days on market | 0.45 mi |
| 2704 Wooly Rose Avenue | Active | $370,000 | $238 | 3 / 3 | 1,554 | 11 days on market | 0.46 mi |
| 2209 Abraham Avenue | Pending | $369,990 | $299 | 3 / 3 | 1,239 | 50 days on market | 0.46 mi |


