
Comparable Sales Near 6533 Twin Brooks Avenue, Las Vegas, NV 89139
1st Realty · Comparable sales report · 1st.estate · October 20, 2026
Read the Enterprise neighborhood guide →
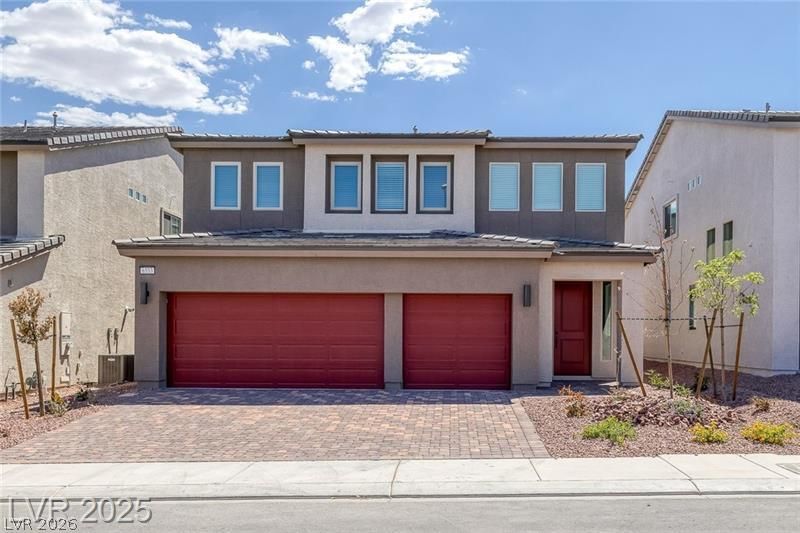
6533 Twin Brooks Avenue, Las Vegas, NV 89139
Status: Sold
$2,990 Sold Price
$1
$ / Sq Ft
2,883
Living Area
4,792 sqft
Lot Size
5
Beds
4
Baths
2024
Year Built
Search Parameters
Property Type
Status
Radius
Sold Within
Beds
Baths
Living Area (Sq Ft)
Lot Size (Sq Ft)
This comp search reflects your current search parameters — adjust the filters above as needed for a more accurate estimate.
Estimated Value
—
Average $/Sqft
—
Check one or more comps below to calculate an estimate.
Nearest 10 of 33 comparable sales and listings within 1 mile of this home. Use the filters above and press Search to refine.

$675,0004 bd3 ba2,883 sqft$234/sqft0.05 mi44 days
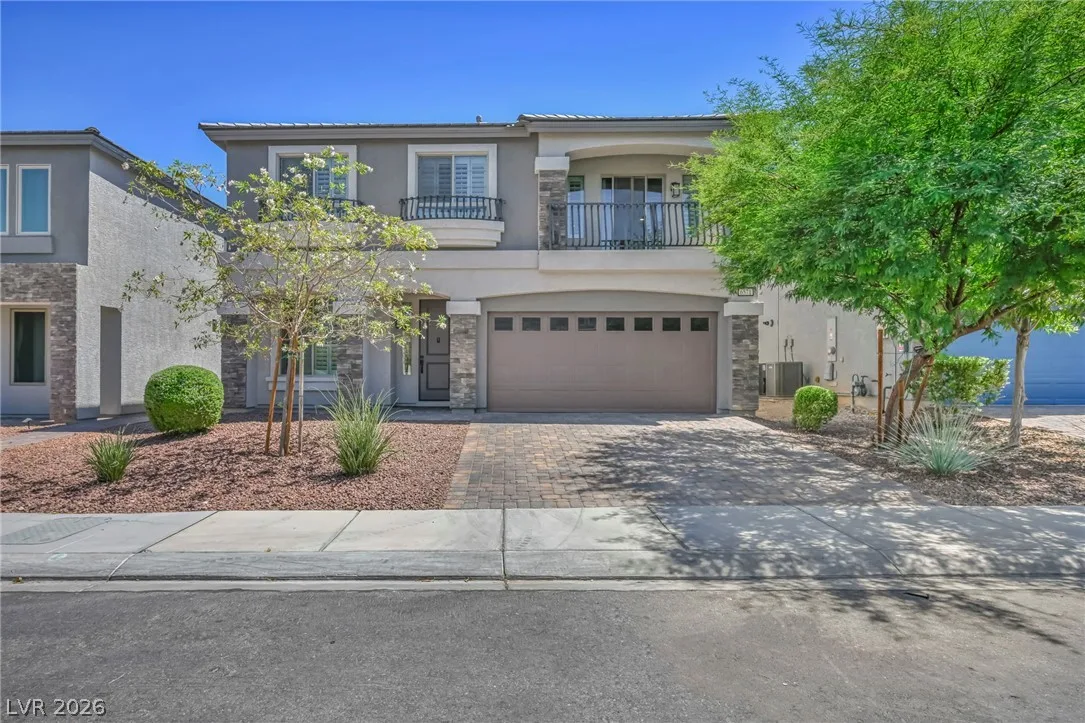
$638,0004 bd5 ba3,000 sqft$213/sqft0.07 mi0 days

6723 Vista Roma AvenueActive
$689,9005 bd3 ba2,883 sqft$239/sqft0.21 mi49 days
$712,5004 bd4 ba2,988 sqft$238/sqft0.27 mi37 daysSold 2026-05-27
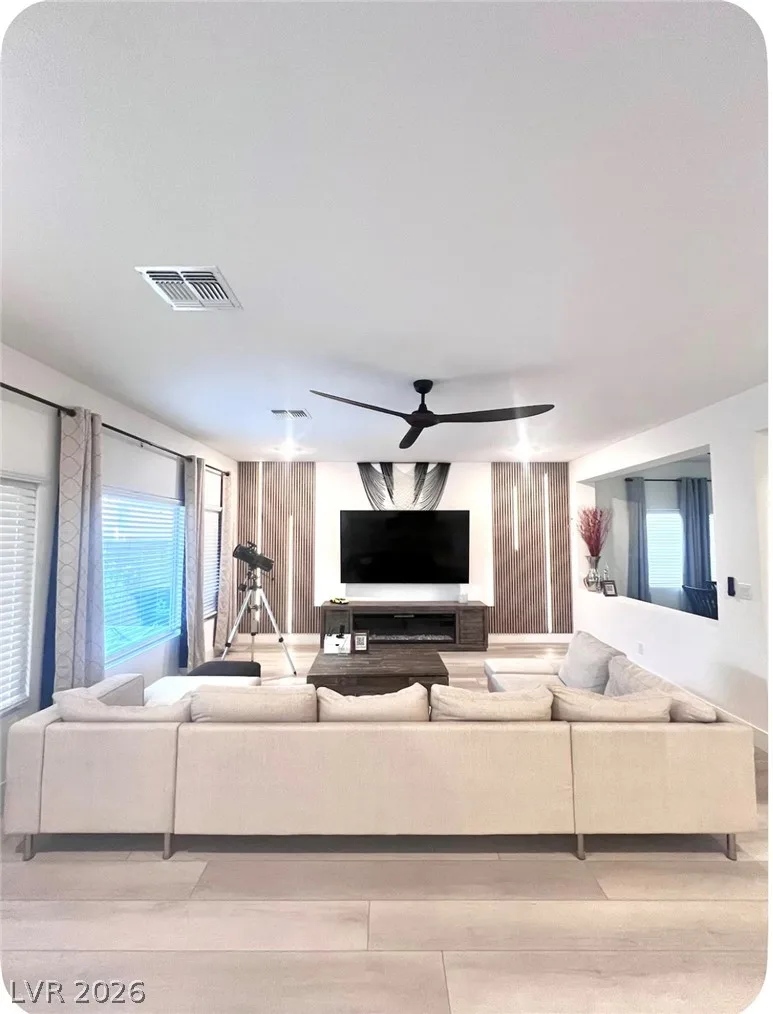
$695,0004 bd3 ba3,054 sqft$228/sqft0.45 mi0 days
$645,0005 bd5 ba3,000 sqft$215/sqft0.47 mi64 daysSold 2026-04-24
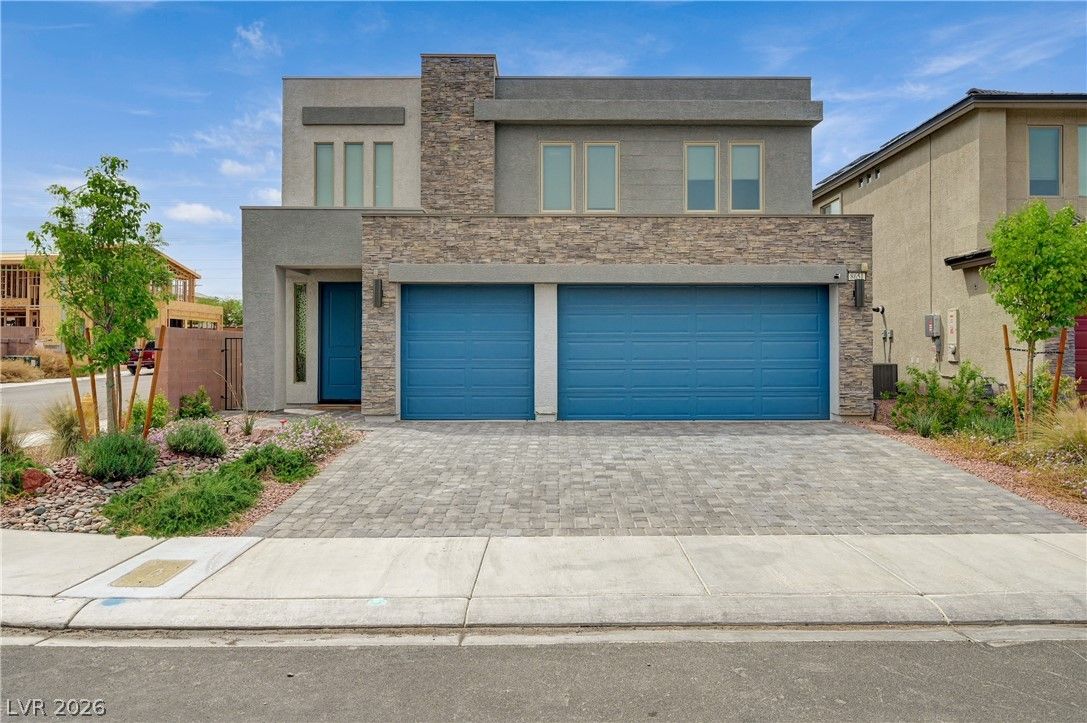
8651 Black Cordon RoadActive
$648,0004 bd3 ba2,883 sqft$225/sqft0.48 mi41 days
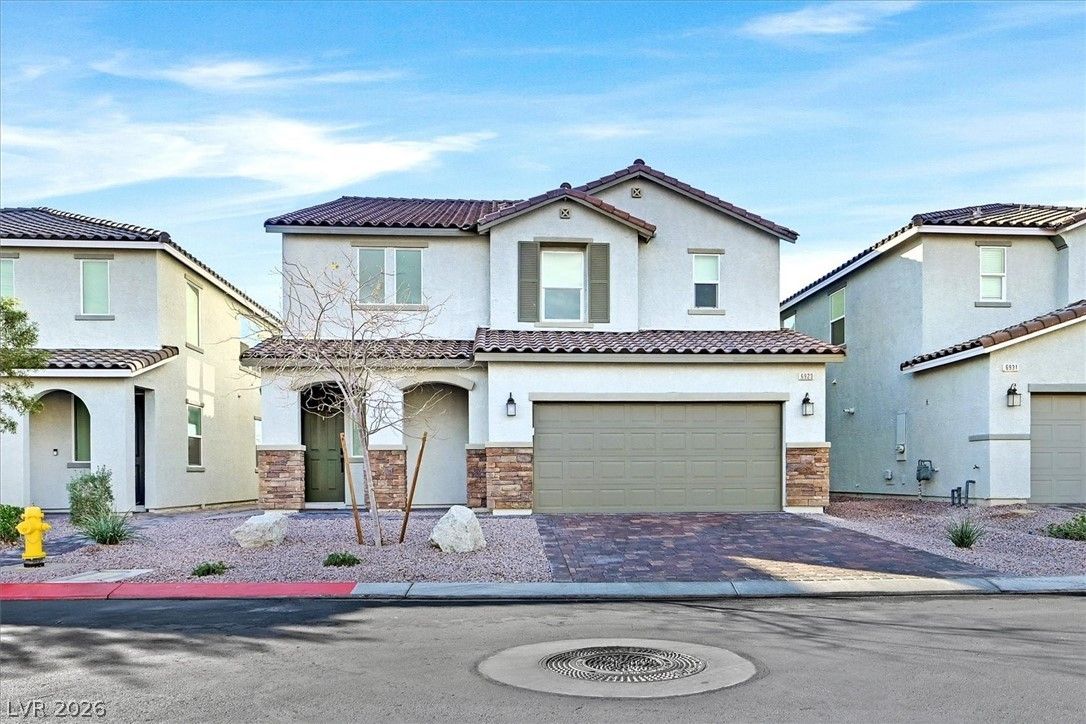
$649,9005 bd5 ba3,088 sqft$210/sqft0.49 mi26 days
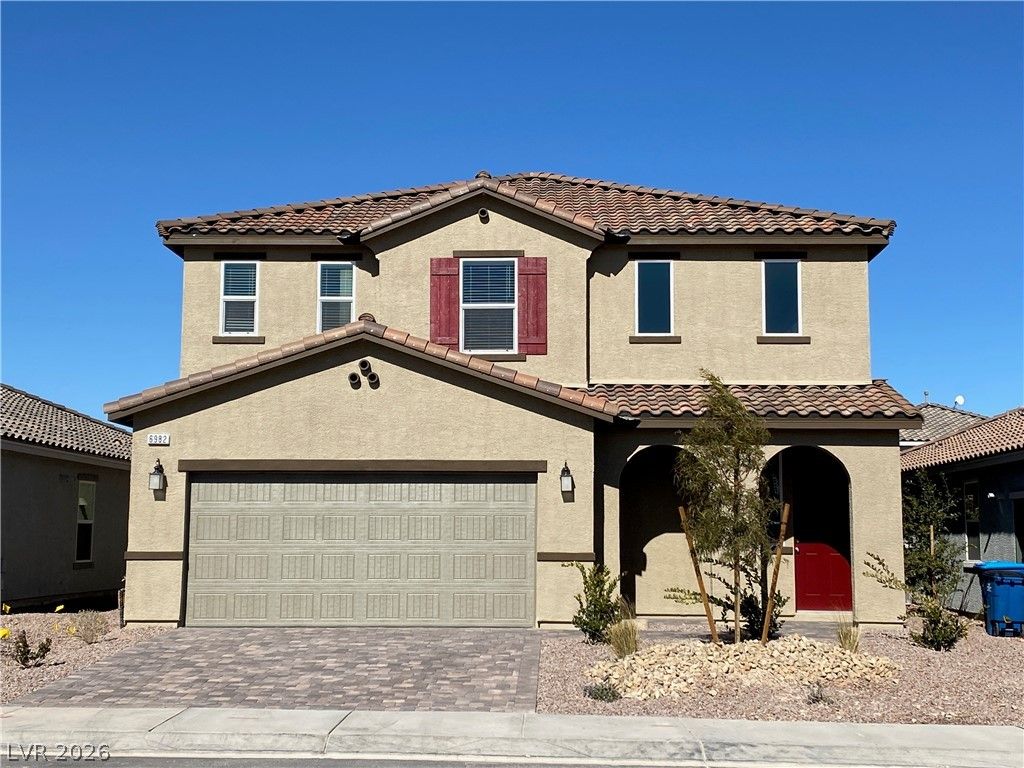
$666,0005 bd4 ba3,088 sqft$216/sqft0.58 mi182 days

$678,0005 bd4 ba3,088 sqft$220/sqft0.60 mi16 days
Nearest comparable sales and listings
12 comparables · median price $657,950 · range $520,000 – $712,500 · median $/sq ft $218 · average $/sq ft $218
| Address | Status | Price | $/Sq Ft | Bd / Ba | Sq Ft | Sold / market time | Distance |
|---|---|---|---|---|---|---|---|
| 8960 Pemberton Valley Drive | Active | $675,000 | $234 | 4 / 3 | 2,883 | 44 days on market | 0.05 mi |
| 6571 Tangled Vines Avenue | Active | $638,000 | $213 | 4 / 5 | 3,000 | 0 days on market | 0.07 mi |
| 6723 Vista Roma Avenue | Active | $689,900 | $239 | 5 / 3 | 2,883 | 49 days on market | 0.21 mi |
| 6764 Vista Roma Avenue | Sold | $712,500 | $238 | 4 / 4 | 2,988 | Sold 2026-05-27 | 0.27 mi |
| 8683 South Black Cordon Road | Active | $695,000 | $228 | 4 / 3 | 3,054 | 0 days on market | 0.45 mi |
| 8638 Black Cordon Road | Sold | $645,000 | $215 | 5 / 5 | 3,000 | Sold 2026-04-24 | 0.47 mi |
| 8651 Black Cordon Road | Active | $648,000 | $225 | 4 / 3 | 2,883 | 41 days on market | 0.48 mi |
| 6923 Elysian Valley Avenue | Active | $649,900 | $210 | 5 / 5 | 3,088 | 26 days on market | 0.49 mi |
| 6982 Solano Canyon Avenue | Active | $666,000 | $216 | 5 / 4 | 3,088 | 182 days on market | 0.58 mi |
| 6998 Solano Canyon Avenue | Active | $678,000 | $220 | 5 / 4 | 3,088 | 16 days on market | 0.60 mi |
| 8573 Silver Coast Street | Sold | $520,000 | $175 | 4 / 3 | 2,971 | Sold 2026-08-31 | 0.60 mi |
| 6532 Octave Avenue | Sold | $535,000 | $202 | 4 / 3 | 2,654 | Sold 2026-05-19 | 0.64 mi |


