
Comparable Sales Near 7048 Picaroon Lane, Las Vegas, NV 89145
1st Realty · Comparable sales report · 1st.estate · October 20, 2026
Browse our Las Vegas area guides →
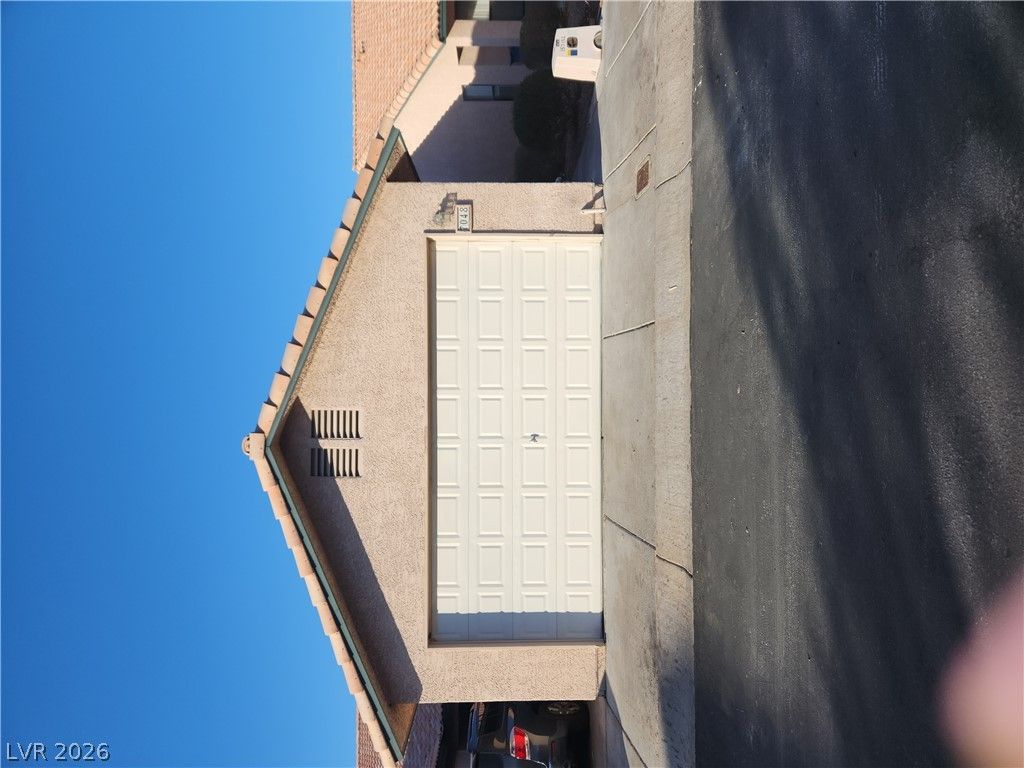
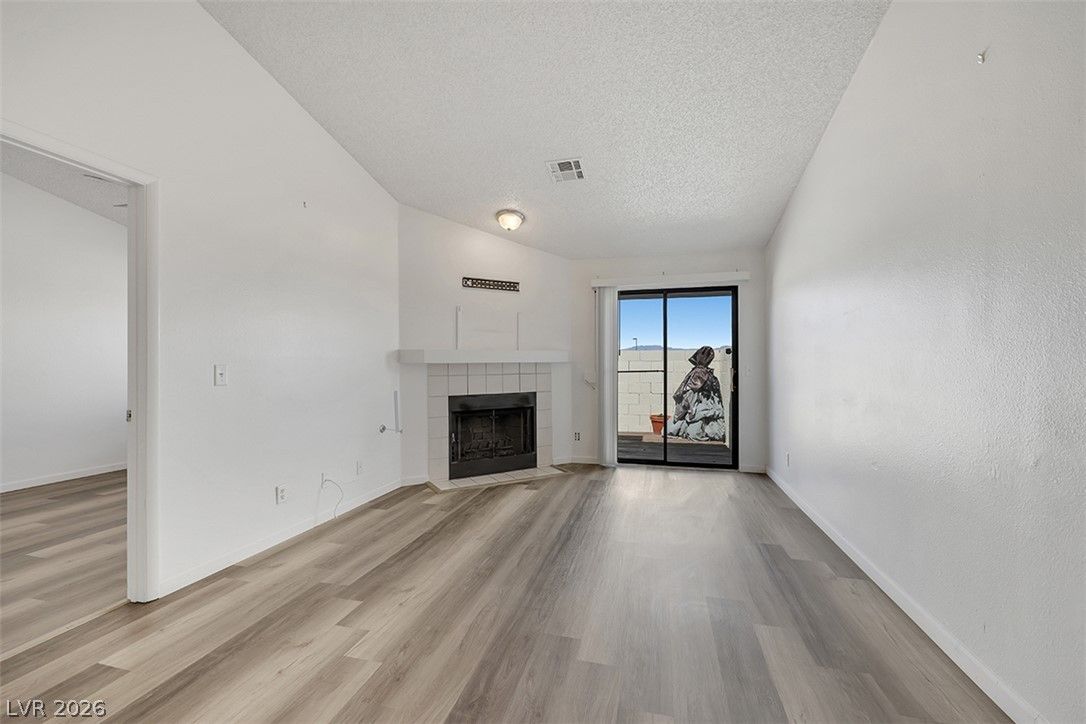
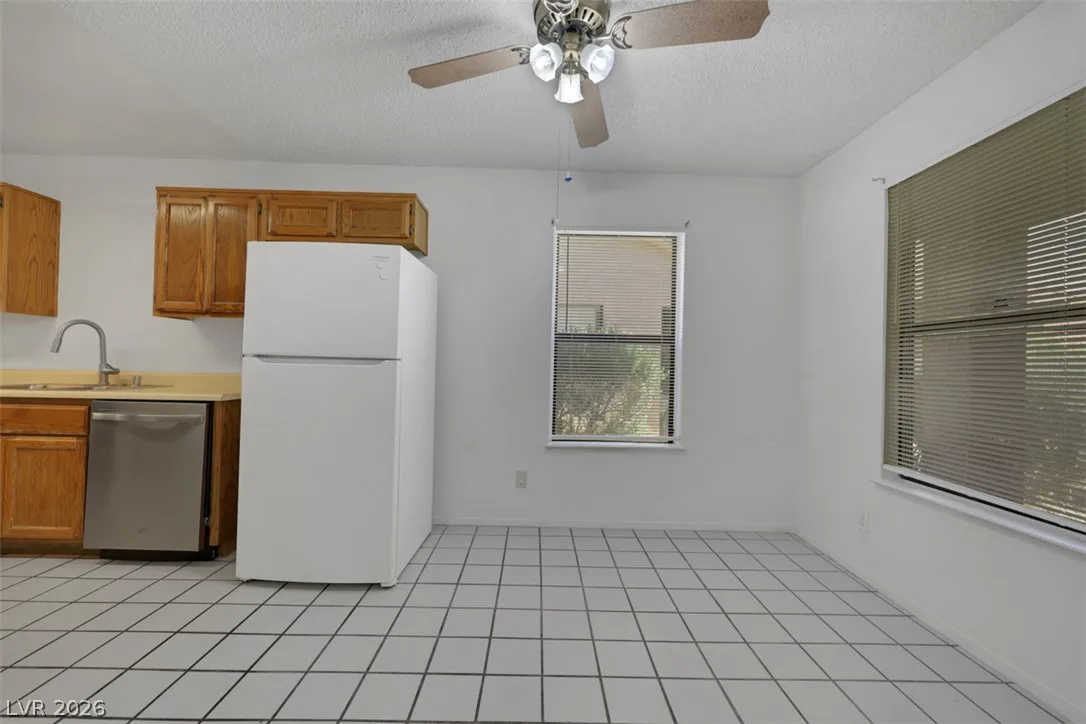
7048 Picaroon Lane, Las Vegas, NV 89145
Status: Sold
$1,675 Sold Price
$2
$ / Sq Ft
1,083
Living Area
2,178 sqft
Lot Size
2
Beds
2
Baths
1989
Year Built
Search Parameters
Property Type
Status
Radius
Sold Within
Beds
Baths
Living Area (Sq Ft)
Lot Size (Sq Ft)
This comp search reflects your current search parameters — adjust the filters above as needed for a more accurate estimate.
Estimated Value
—
Average $/Sqft
—
Check one or more comps below to calculate an estimate.
Nearest 10 of 18 comparable sales and listings within 1 mile of this home. Use the filters above and press Search to refine.
312 Yardarm WaySold
$285,0002 bd2 ba1,119 sqft$255/sqft0.07 mi22 daysSold 2026-05-01
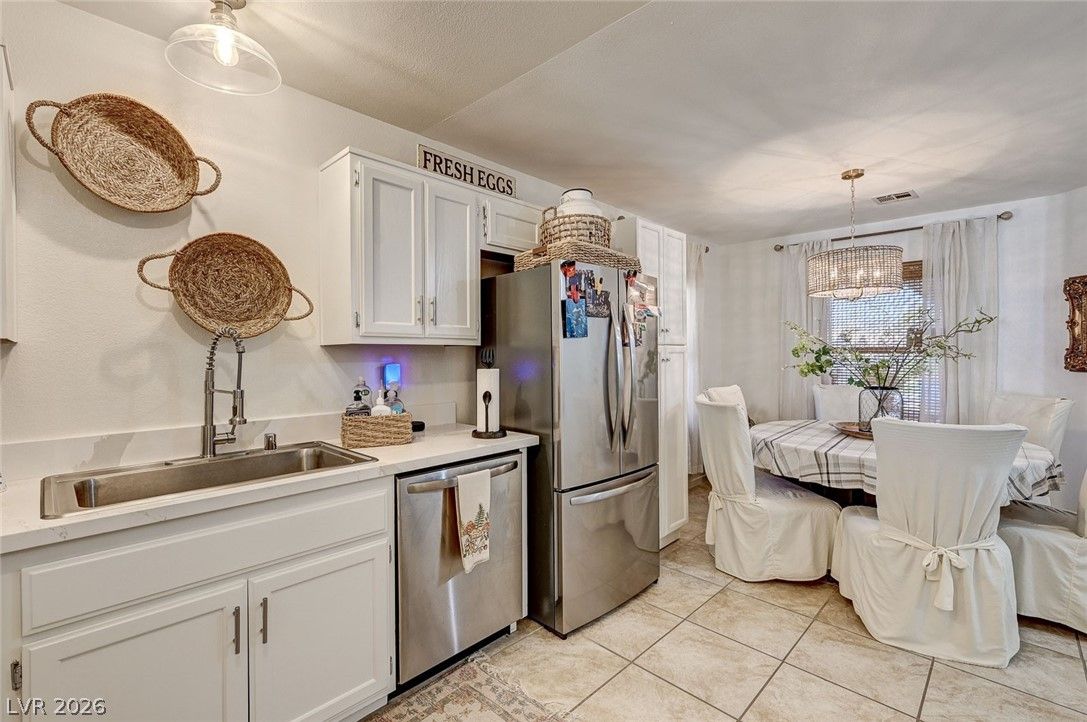
216 Yardarm WayActive
$310,0002 bd2 ba1,171 sqft$265/sqft0.11 mi177 days
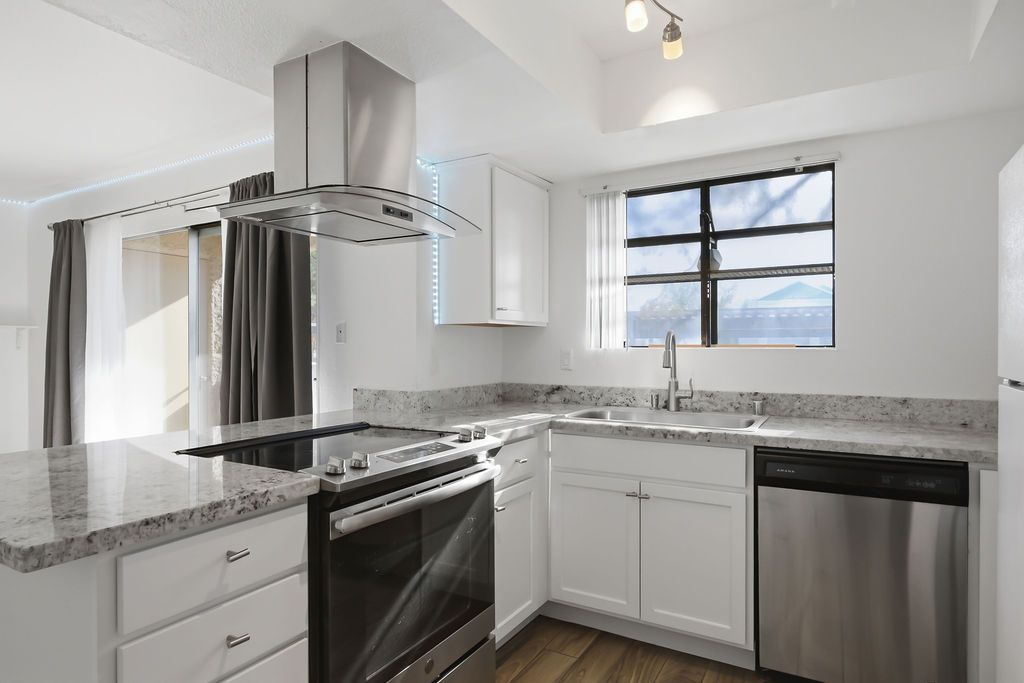
$190,0002 bd2 ba908 sqft$209/sqft0.20 mi35 days
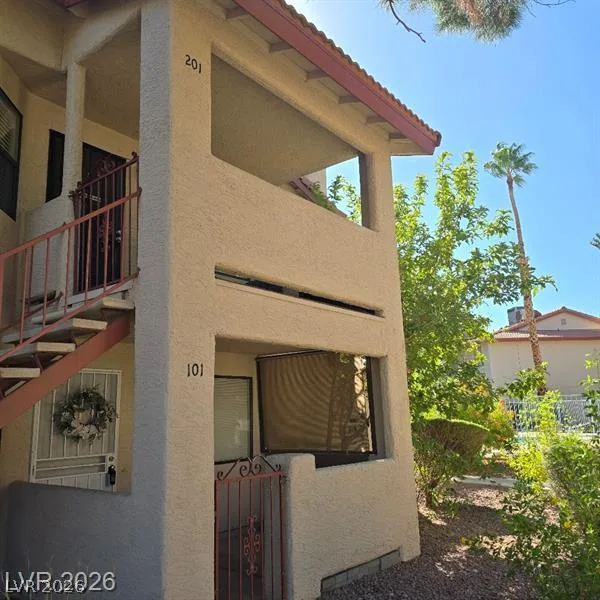
$205,0002 bd2 ba912 sqft$225/sqft0.32 mi5 days
$188,8002 bd2 ba908 sqft$208/sqft0.38 mi53 daysSold 2026-04-30
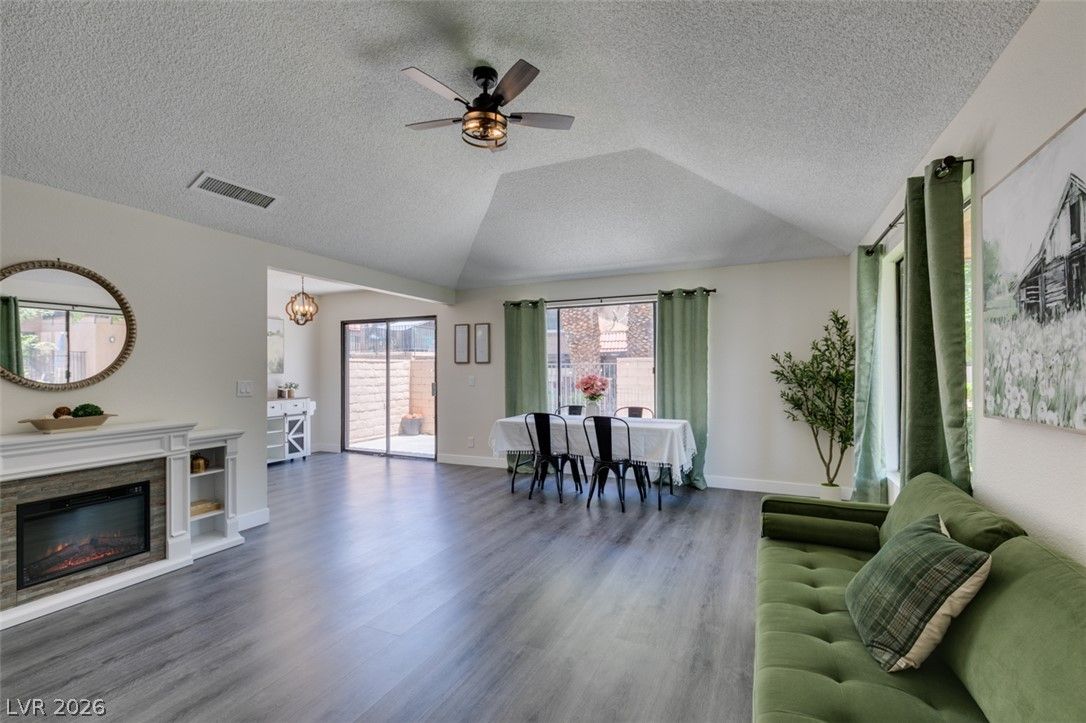
$265,0003 bd2 ba1,176 sqft$225/sqft0.57 mi21 daysSold 2026-09-14
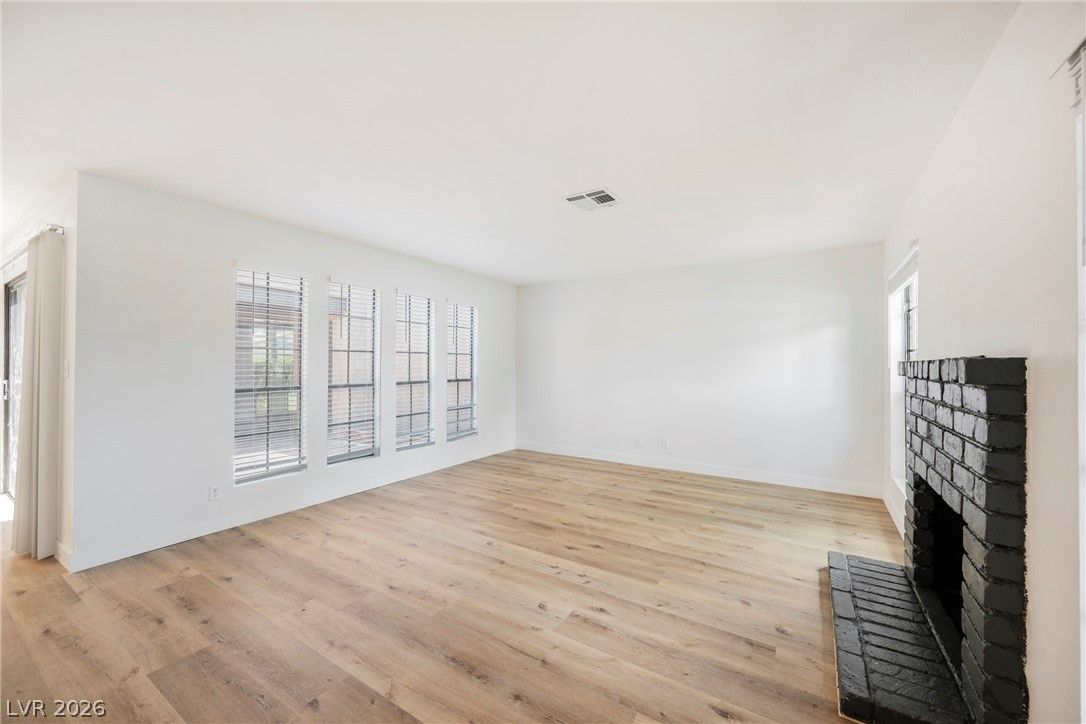
$295,0002 bd2 ba1,327 sqft$222/sqft0.74 mi26 daysSold 2026-10-14
$170,0002 bd2 ba996 sqft$171/sqft0.76 mi53 daysSold 2026-06-03
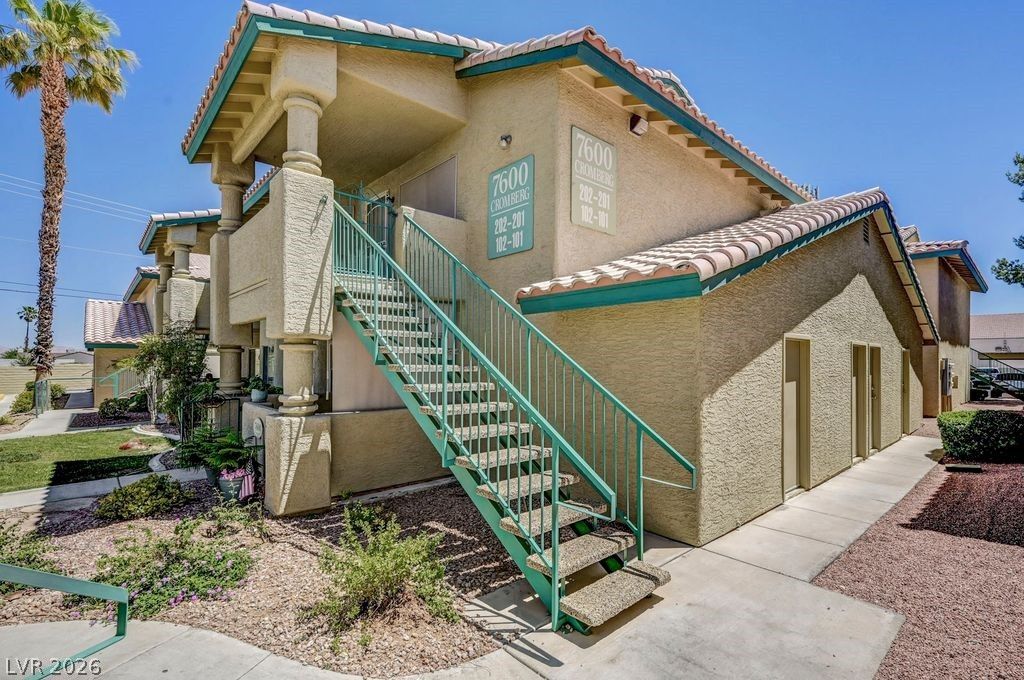
7600 Cromberg Avenue 201Active
$200,0002 bd2 ba1,192 sqft$168/sqft0.77 mi84 days
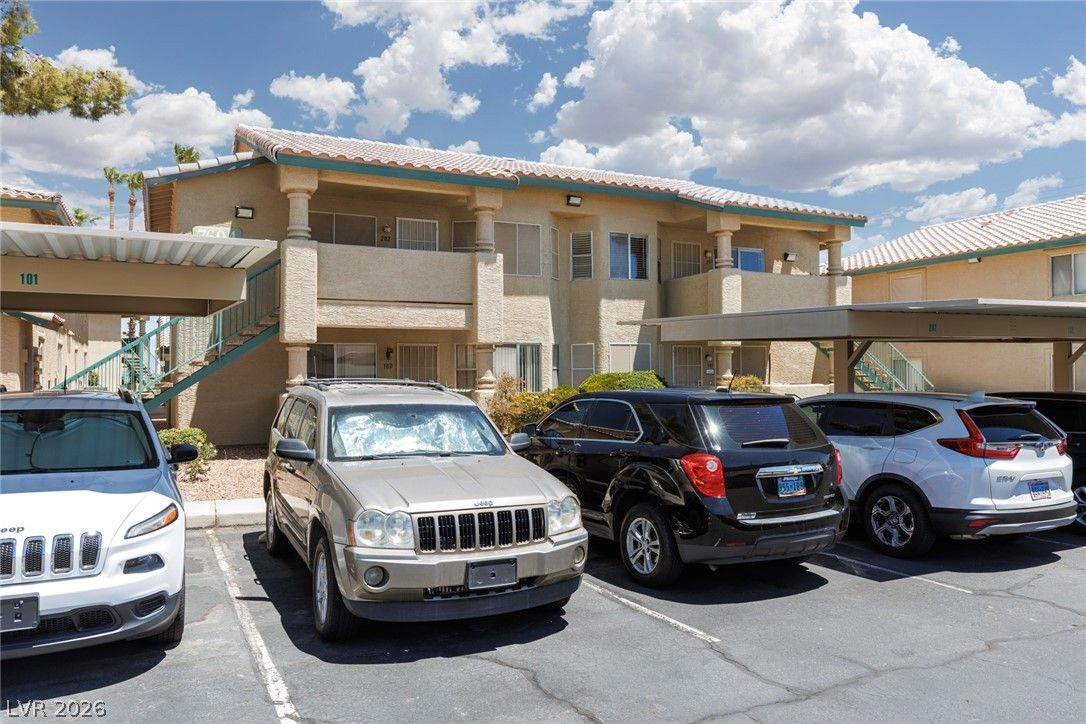
7604 Cromberg 201Active
$199,9992 bd2 ba996 sqft$201/sqft0.78 mi51 days
Nearest comparable sales and listings
12 comparables · median price $202,500 · range $170,000 – $310,000 · median $/sq ft $209 · average $/sq ft $211
| Address | Status | Price | $/Sq Ft | Bd / Ba | Sq Ft | Sold / market time | Distance |
|---|---|---|---|---|---|---|---|
| 312 Yardarm Way | Sold | $285,000 | $255 | 2 / 2 | 1,119 | Sold 2026-05-01 | 0.07 mi |
| 216 Yardarm Way | Active | $310,000 | $265 | 2 / 2 | 1,171 | 177 days on market | 0.11 mi |
| 7200 Pirates Cove Road 1039 | Active | $190,000 | $209 | 2 / 2 | 908 | 35 days on market | 0.20 mi |
| 713 Rock Springs Drive 101 | Active | $205,000 | $225 | 2 / 2 | 912 | 5 days on market | 0.32 mi |
| 7300 Pirates Cove Road 1100 | Sold | $188,800 | $208 | 2 / 2 | 908 | Sold 2026-04-30 | 0.38 mi |
| 301 Misty Isle Lane A | Sold | $265,000 | $225 | 3 / 2 | 1,176 | Sold 2026-09-14 | 0.57 mi |
| 501 Buttonwood Lane | Sold | $295,000 | $222 | 2 / 2 | 1,327 | Sold 2026-10-14 | 0.74 mi |
| 332 South Buffalo Drive 202 | Sold | $170,000 | $171 | 2 / 2 | 996 | Sold 2026-06-03 | 0.76 mi |
| 7600 Cromberg Avenue 201 | Active | $200,000 | $168 | 2 / 2 | 1,192 | 84 days on market | 0.77 mi |
| 7604 Cromberg 201 | Active | $199,999 | $201 | 2 / 2 | 996 | 51 days on market | 0.78 mi |
| 6521 Sugarpine Lane | Active | $243,000 | $183 | 2 / 2 | 1,327 | 64 days on market | 0.79 mi |
| 1113 North Buffalo Drive 201 | Sold | $186,000 | $204 | 2 / 2 | 912 | Sold 2026-05-11 | 0.79 mi |


