
Comparable Sales Near 910 HOLLOWBLUFF Avenue, North Las Vegas, NV 89031
1st Realty · Comparable sales report · 1st.estate · October 20, 2026
Read the North Las Vegas area guide →
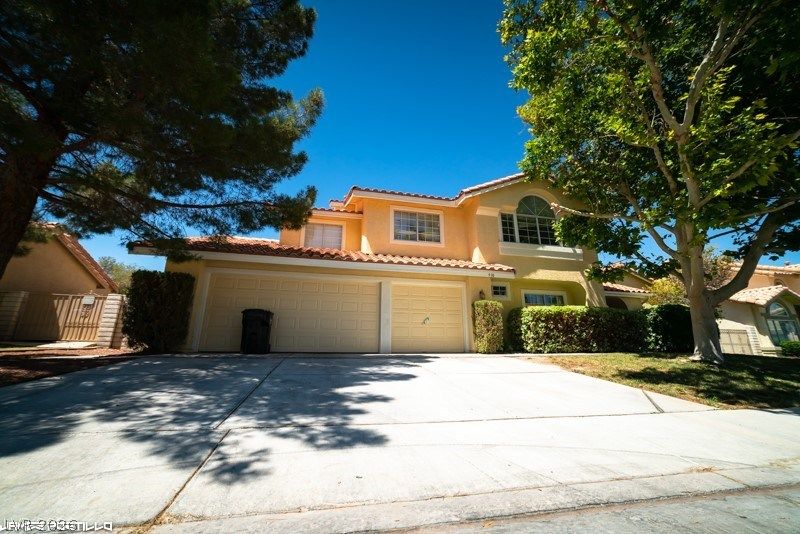
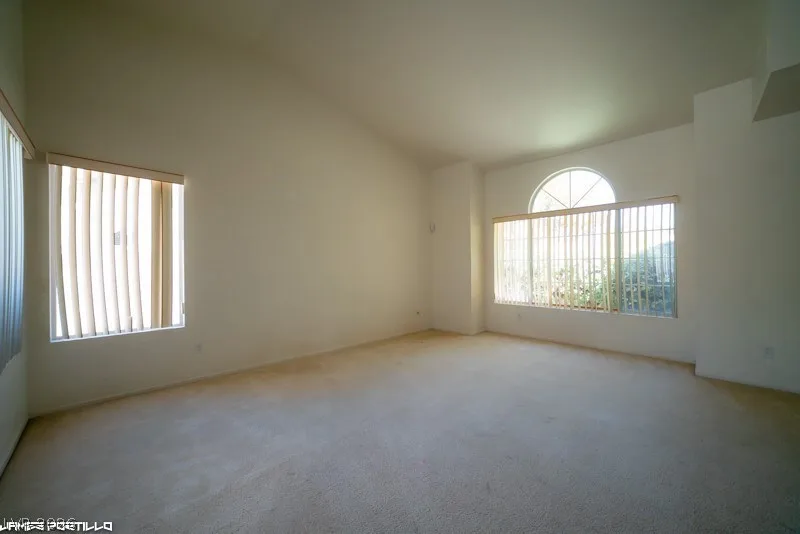
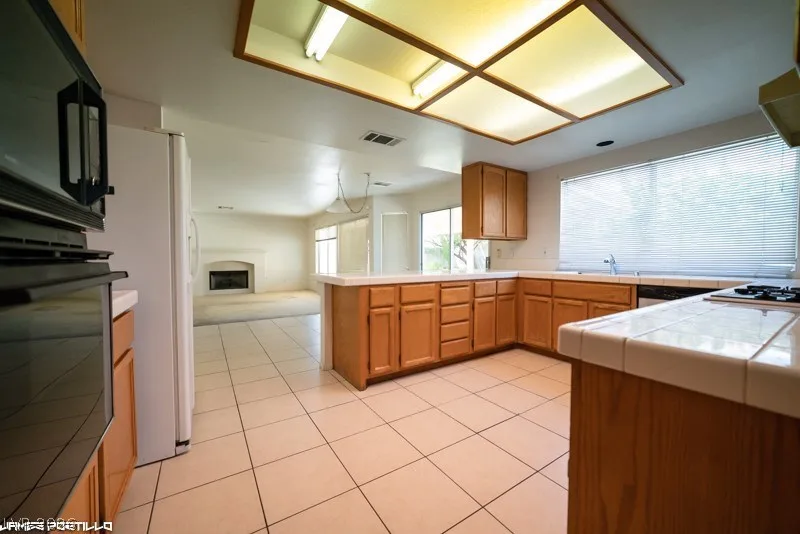
910 HOLLOWBLUFF Avenue, North Las Vegas, NV 89031
Status: Sold
$2,895 Sold Price
$1
$ / Sq Ft
3,105
Living Area
10,454 sqft
Lot Size
4
Beds
3
Baths
1992
Year Built
Search Parameters
Property Type
Status
Radius
Sold Within
Beds
Baths
Living Area (Sq Ft)
Lot Size (Sq Ft)
This comp search reflects your current search parameters — adjust the filters above as needed for a more accurate estimate.
Estimated Value
—
Average $/Sqft
—
Check one or more comps below to calculate an estimate.
Nearest 10 of 27 comparable sales and listings within 1 mile of this home. Use the filters above and press Search to refine.
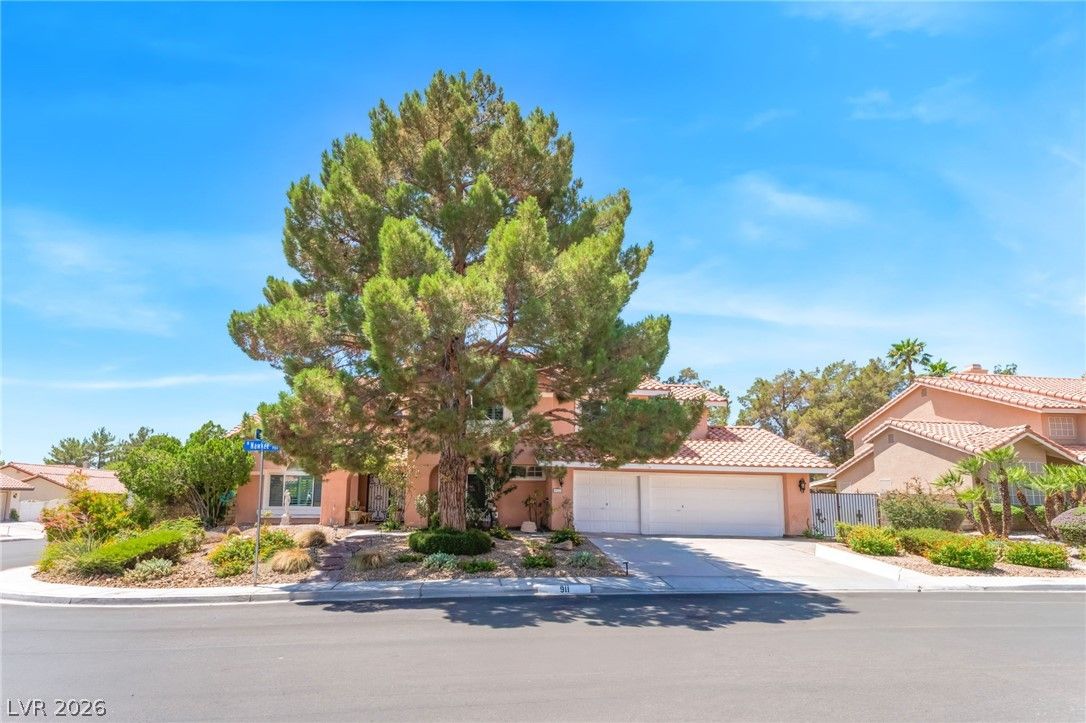
911 Nawkee DriveSold
$610,0004 bd3 ba3,105 sqft$196/sqft0.08 mi27 daysSold 2026-08-03
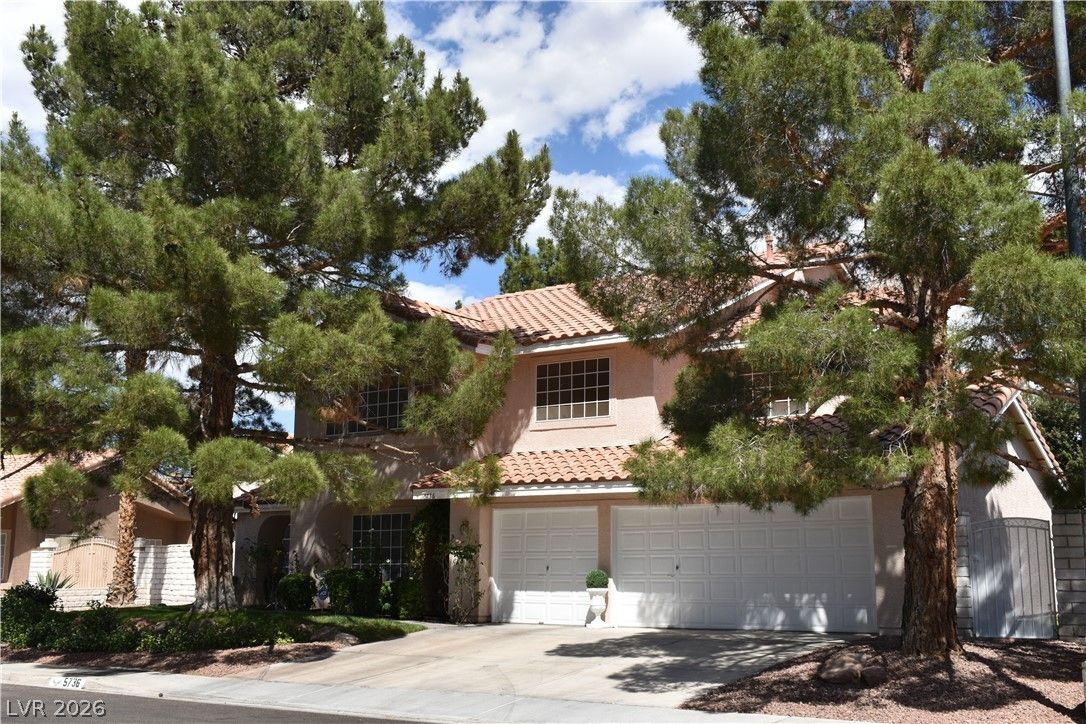
5736 Willowcreek RoadActive
$639,9004 bd3 ba3,105 sqft$206/sqft0.15 mi48 days
$636,0004 bd3 ba3,105 sqft$205/sqft0.15 mi12 daysSold 2026-05-11
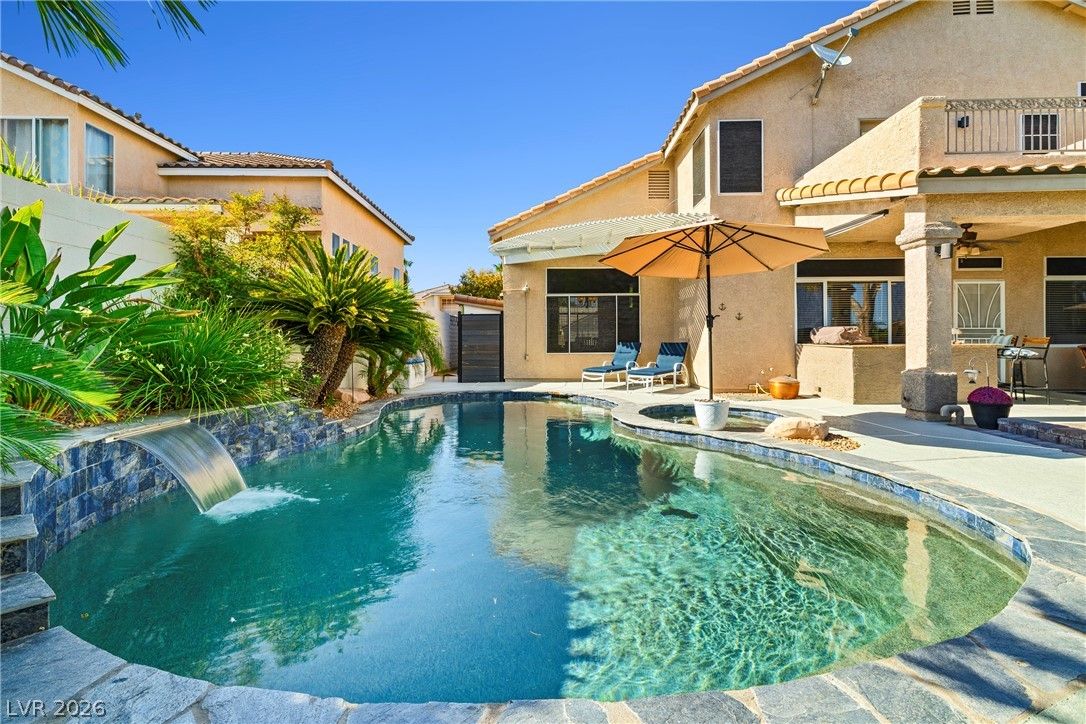
$605,0004 bd3 ba2,659 sqft$228/sqft0.25 mi3 daysSold 2026-07-31
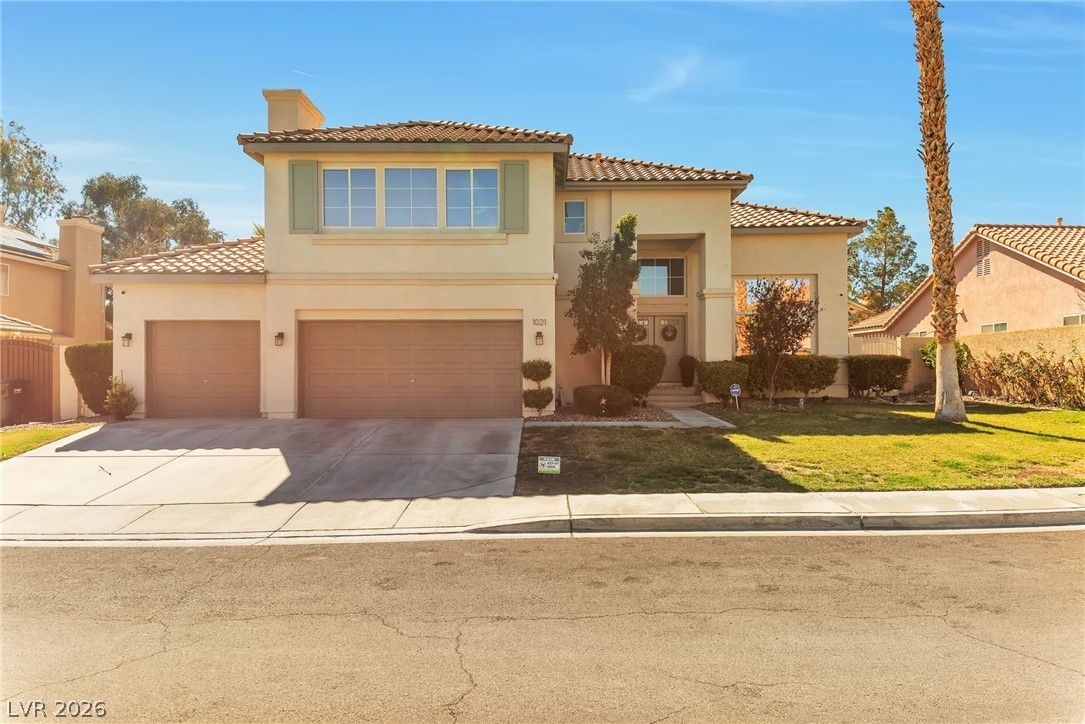
$625,0004 bd4 ba3,006 sqft$208/sqft0.26 mi97 daysSold 2026-08-28
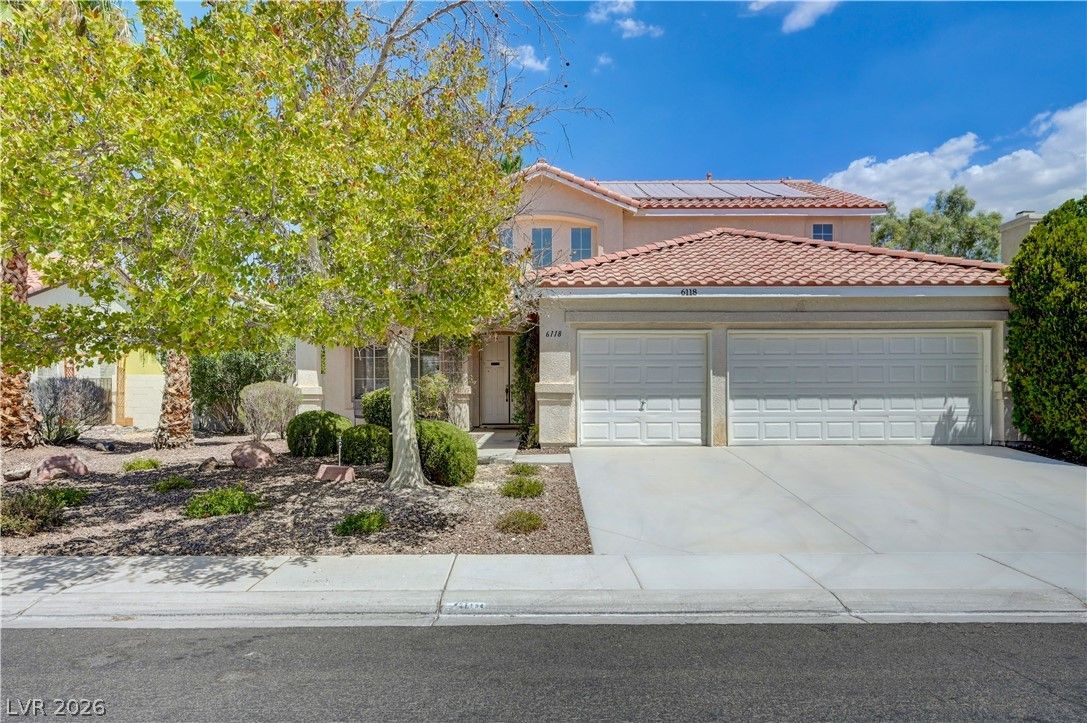
$530,0004 bd3 ba2,472 sqft$214/sqft0.40 mi6 daysSold 2026-08-28
$585,0004 bd4 ba3,040 sqft$192/sqft0.45 mi46 daysSold 2026-04-24
$540,0004 bd3 ba2,425 sqft$223/sqft0.52 mi95 daysSold 2026-07-01
$620,0005 bd3 ba3,040 sqft$204/sqft0.65 mi16 daysSold 2026-07-14
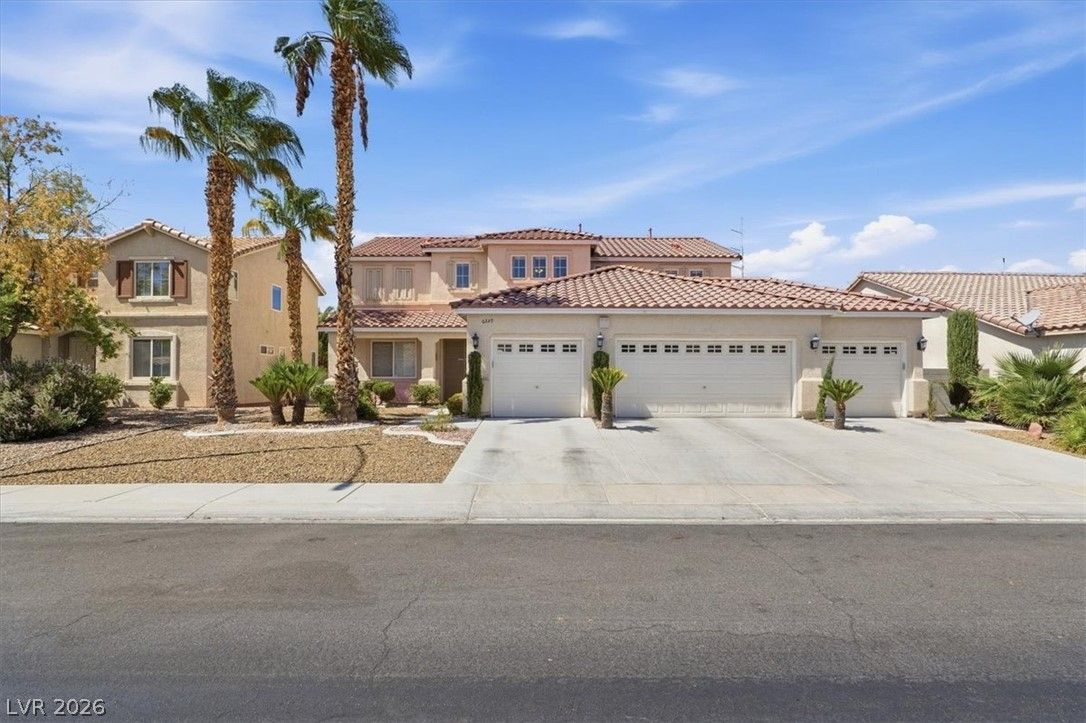
6329 Snow Cactus StreetActive
$575,0004 bd3 ba3,040 sqft$189/sqft0.66 mi4 days
Nearest comparable sales and listings
12 comparables · median price $595,000 · range $500,000 – $639,900 · median $/sq ft $204 · average $/sq ft $204
| Address | Status | Price | $/Sq Ft | Bd / Ba | Sq Ft | Sold / market time | Distance |
|---|---|---|---|---|---|---|---|
| 911 Nawkee Drive | Sold | $610,000 | $196 | 4 / 3 | 3,105 | Sold 2026-08-03 | 0.08 mi |
| 5736 Willowcreek Road | Active | $639,900 | $206 | 4 / 3 | 3,105 | 48 days on market | 0.15 mi |
| 1016 Grey Hollow Avenue | Sold | $636,000 | $205 | 4 / 3 | 3,105 | Sold 2026-05-11 | 0.15 mi |
| 1139 Crescent Moon Drive | Sold | $605,000 | $228 | 4 / 3 | 2,659 | Sold 2026-07-31 | 0.25 mi |
| 1021 Moorpoint Drive | Sold | $625,000 | $208 | 4 / 4 | 3,006 | Sold 2026-08-28 | 0.26 mi |
| 6118 Rising Circle | Sold | $530,000 | $214 | 4 / 3 | 2,472 | Sold 2026-08-28 | 0.40 mi |
| 6220 Star Decker Road | Sold | $585,000 | $192 | 4 / 4 | 3,040 | Sold 2026-04-24 | 0.45 mi |
| 1334 Stable Glen Drive | Sold | $540,000 | $223 | 4 / 3 | 2,425 | Sold 2026-07-01 | 0.52 mi |
| 6328 Bunch Grass Court | Sold | $620,000 | $204 | 5 / 3 | 3,040 | Sold 2026-07-14 | 0.65 mi |
| 6329 Snow Cactus Street | Active | $575,000 | $189 | 4 / 3 | 3,040 | 4 days on market | 0.66 mi |
| 6324 Black Oaks Street | Sold | $550,000 | $200 | 4 / 3 | 2,747 | Sold 2026-07-24 | 0.66 mi |
| 6332 Bunch Grass Court | Sold | $500,000 | $182 | 4 / 3 | 2,747 | Sold 2026-06-16 | 0.66 mi |


