
Comparable Sales Near 11556 Aruba Beach Avenue, Las Vegas, NV 89138
1st Realty · Comparable sales report · 1st.estate · October 20, 2026
Browse our Las Vegas area guides →
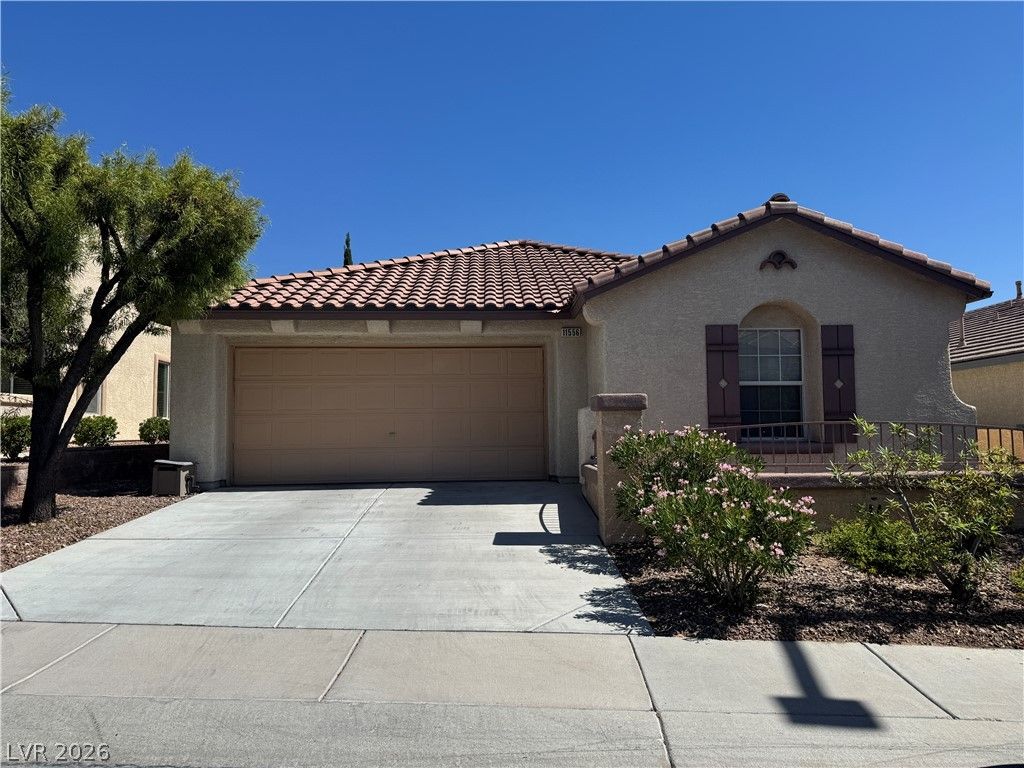
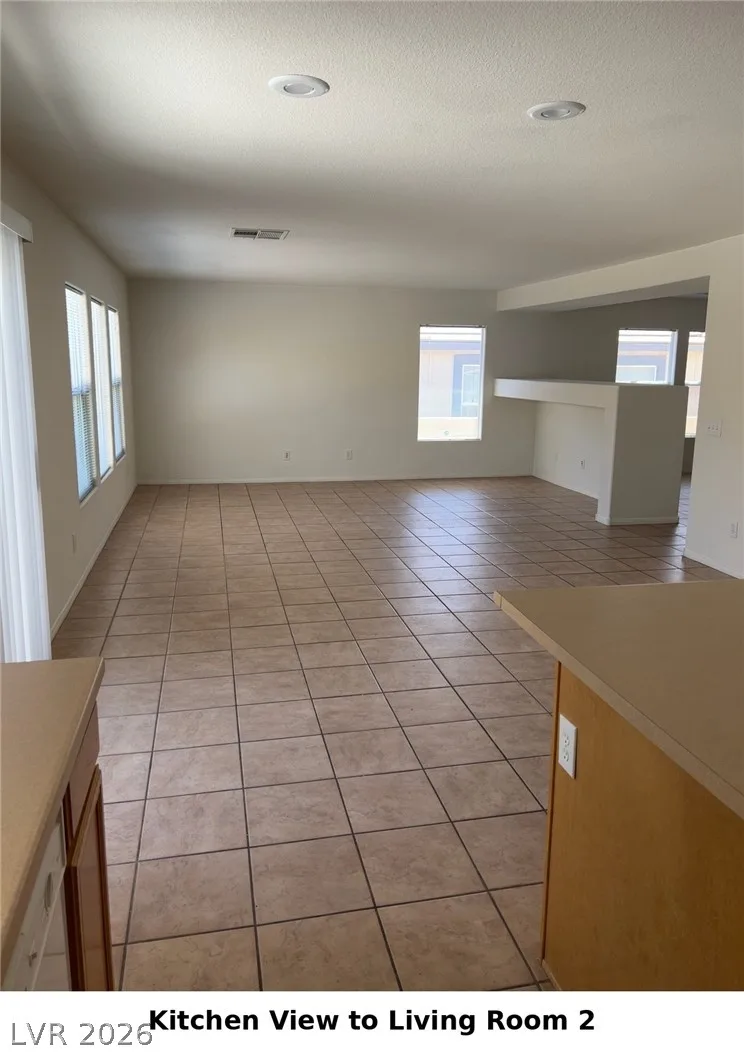
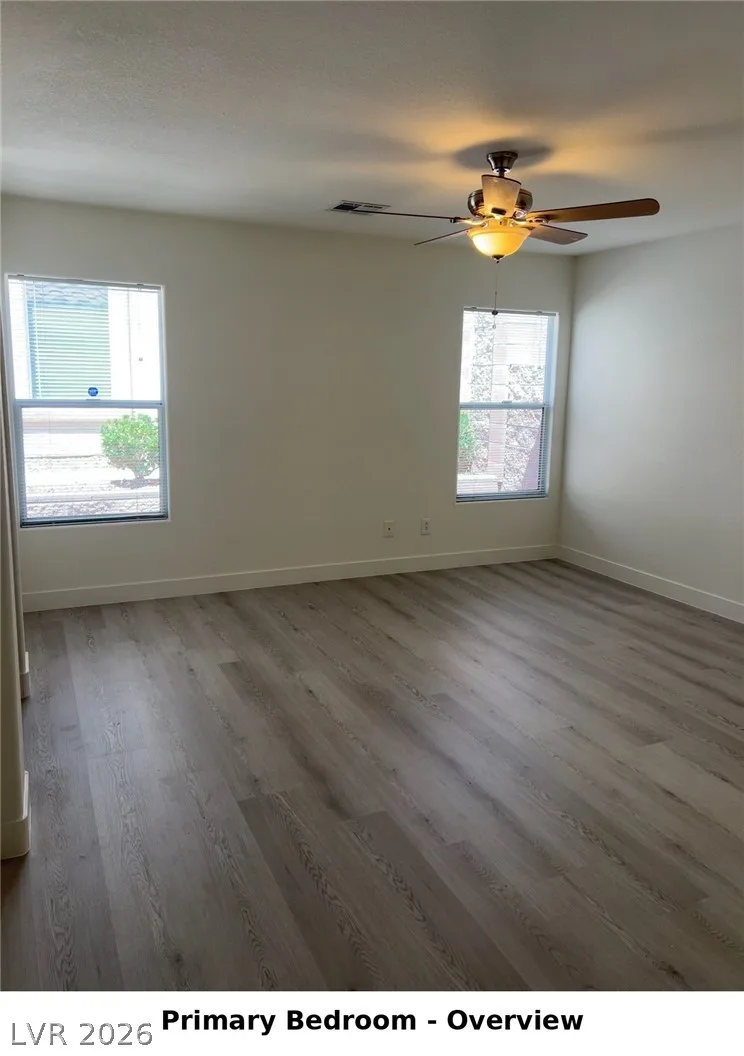
11556 Aruba Beach Avenue, Las Vegas, NV 89138
Status: Sold
$1,995 Sold Price
$1
$ / Sq Ft
1,713
Living Area
4,792 sqft
Lot Size
3
Beds
2
Baths
2004
Year Built
Search Parameters
Property Type
Status
Radius
Sold Within
Beds
Baths
Living Area (Sq Ft)
Lot Size (Sq Ft)
This comp search reflects your current search parameters — adjust the filters above as needed for a more accurate estimate.
Estimated Value
—
Average $/Sqft
—
Check one or more comps below to calculate an estimate.
Nearest 10 of 48 comparable sales and listings within 1 mile of this home. Use the filters above and press Search to refine.
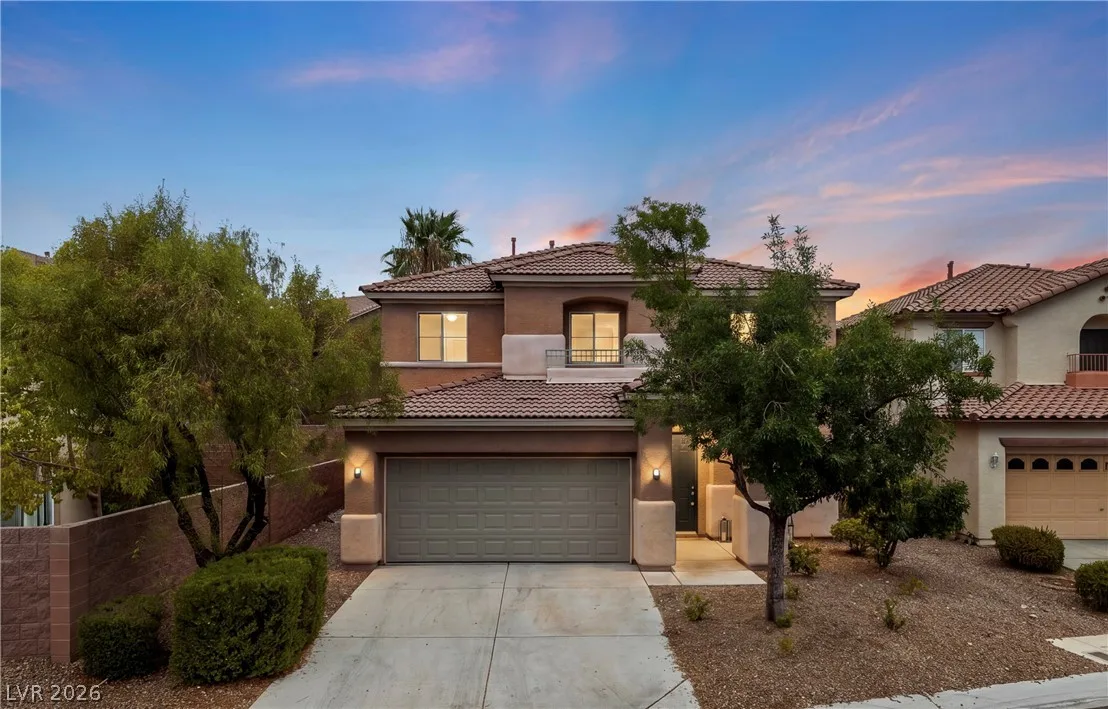
537 Lacabana Beach DriveActive
$614,9004 bd3 ba2,051 sqft$300/sqft0.15 mi18 days
$525,0004 bd3 ba2,051 sqft$256/sqft0.15 mi23 daysSold 2026-06-08
$540,0003 bd2 ba1,680 sqft$321/sqft0.36 mi20 daysSold 2026-06-15
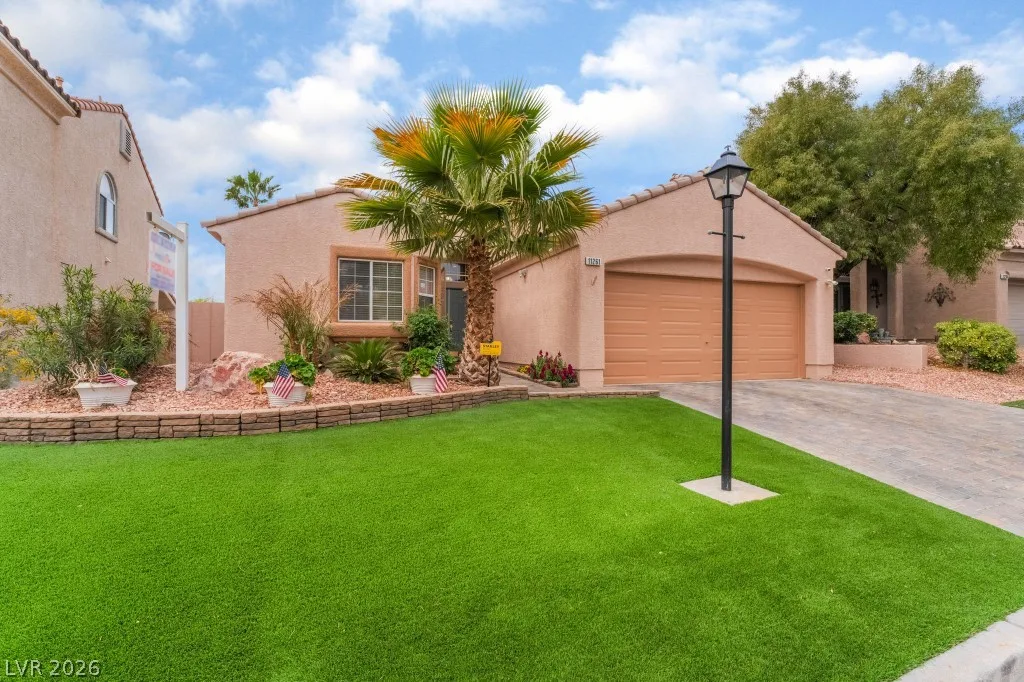
$619,9953 bd2 ba1,898 sqft$327/sqft0.40 mi5 days
$520,0002 bd3 ba1,432 sqft$363/sqft0.42 mi10 daysSold 2026-05-29
$595,0003 bd2 ba1,904 sqft$313/sqft0.42 mi15 daysSold 2026-07-08
$669,0003 bd2 ba1,884 sqft$355/sqft0.45 mi76 daysSold 2026-05-14
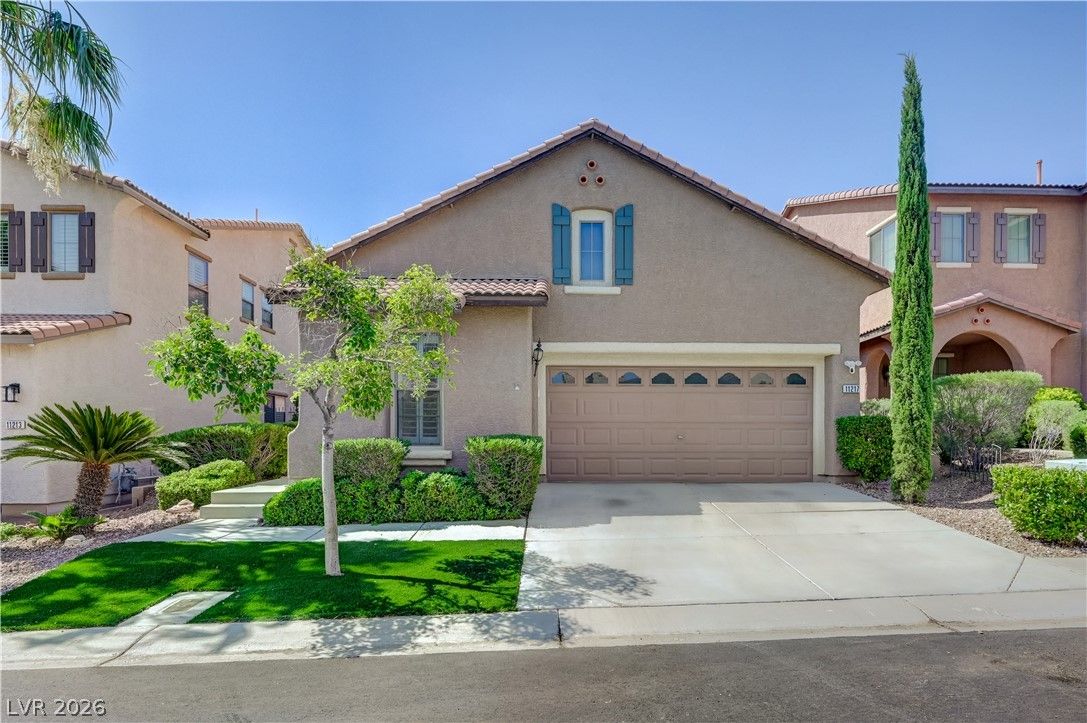
$525,0003 bd2 ba1,621 sqft$324/sqft0.47 mi16 daysSold 2026-07-31
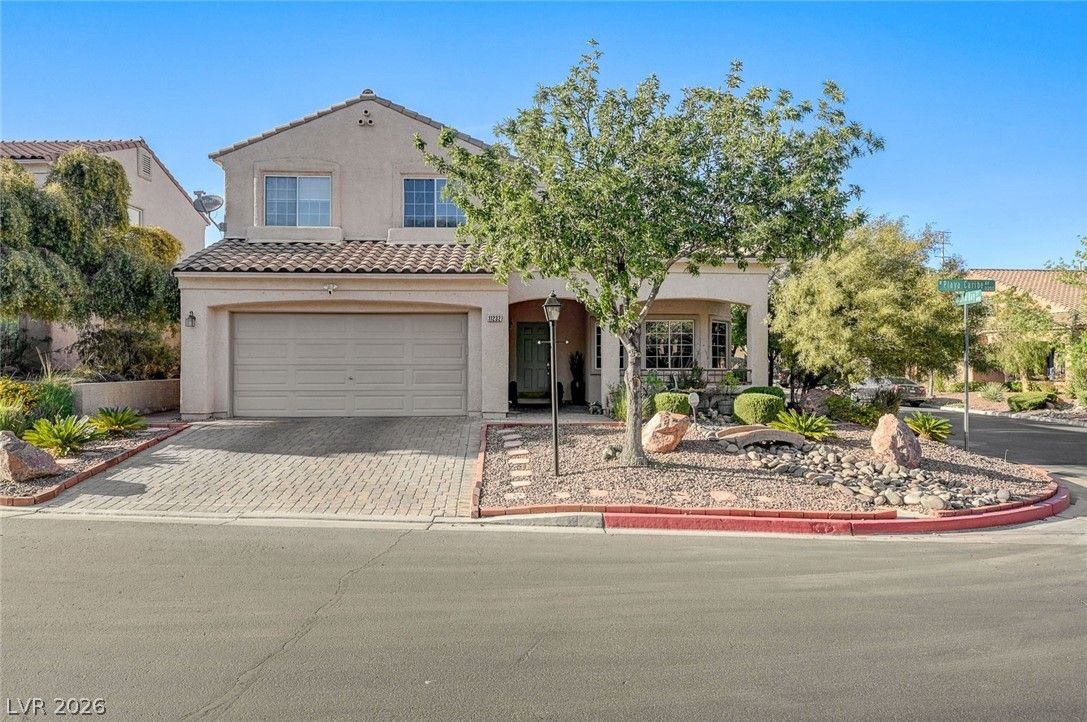
$565,0003 bd3 ba1,976 sqft$286/sqft0.47 mi70 daysSold 2026-08-31
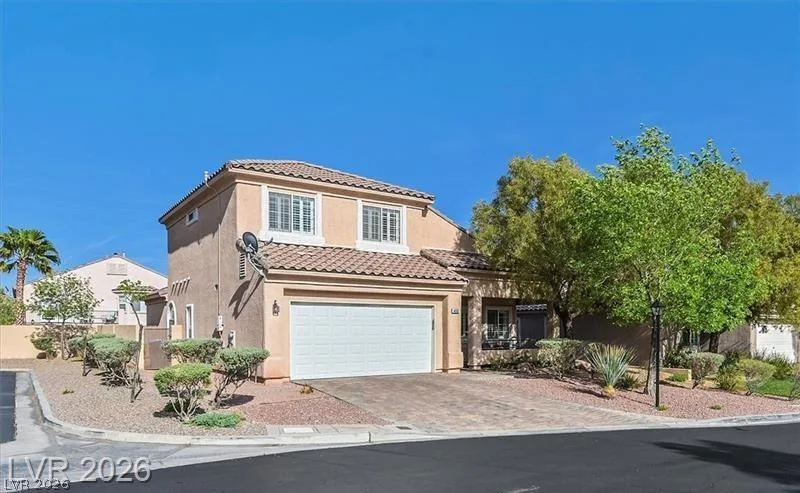
$559,9903 bd3 ba1,976 sqft$283/sqft0.48 mi1 days
Nearest comparable sales and listings
12 comparables · median price $562,495 · range $495,000 – $669,000 · median $/sq ft $316 · average $/sq ft $311
| Address | Status | Price | $/Sq Ft | Bd / Ba | Sq Ft | Sold / market time | Distance |
|---|---|---|---|---|---|---|---|
| 537 Lacabana Beach Drive | Active | $614,900 | $300 | 4 / 3 | 2,051 | 18 days on market | 0.15 mi |
| 537 Lacabana Beach Drive | Sold | $525,000 | $256 | 4 / 3 | 2,051 | Sold 2026-06-08 | 0.15 mi |
| 708 Granite Rapids Street | Sold | $540,000 | $321 | 3 / 2 | 1,680 | Sold 2026-06-15 | 0.36 mi |
| 11261 Playa Caribe Avenue | Active | $619,995 | $327 | 3 / 2 | 1,898 | 5 days on market | 0.40 mi |
| 608 Del Giorno Street | Sold | $520,000 | $363 | 2 / 3 | 1,432 | Sold 2026-05-29 | 0.42 mi |
| 11533 Crimson Rose Avenue | Sold | $595,000 | $313 | 3 / 2 | 1,904 | Sold 2026-07-08 | 0.42 mi |
| 11249 Revelry Lane | Sold | $669,000 | $355 | 3 / 2 | 1,884 | Sold 2026-05-14 | 0.45 mi |
| 11217 Newbury Hills Avenue | Sold | $525,000 | $324 | 3 / 2 | 1,621 | Sold 2026-07-31 | 0.47 mi |
| 11232 Playa Caribe Avenue | Sold | $565,000 | $286 | 3 / 3 | 1,976 | Sold 2026-08-31 | 0.47 mi |
| 460 West Garrafon Bay Street | Active | $559,990 | $283 | 3 / 3 | 1,976 | 1 days on market | 0.48 mi |
| 11215 Playa Bonita Avenue | Sold | $610,000 | $319 | 3 / 2 | 1,913 | Sold 2026-08-12 | 0.48 mi |
| 11237 Woodland Violet Avenue | Sold | $495,000 | $290 | 3 / 3 | 1,708 | Sold 2026-05-01 | 0.53 mi |


