
Comparable Sales Near 714 Kibbey Street, Las Vegas, NV 89178
1st Realty · Comparable sales report · 1st.estate · October 20, 2026
Read the Enterprise neighborhood guide →
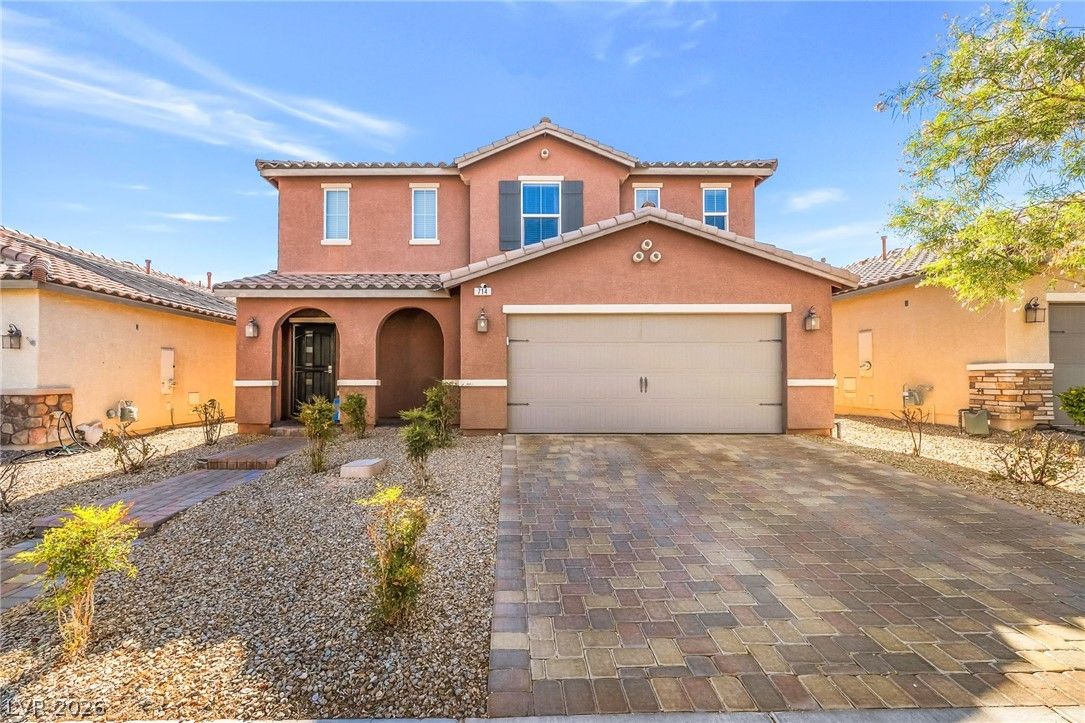
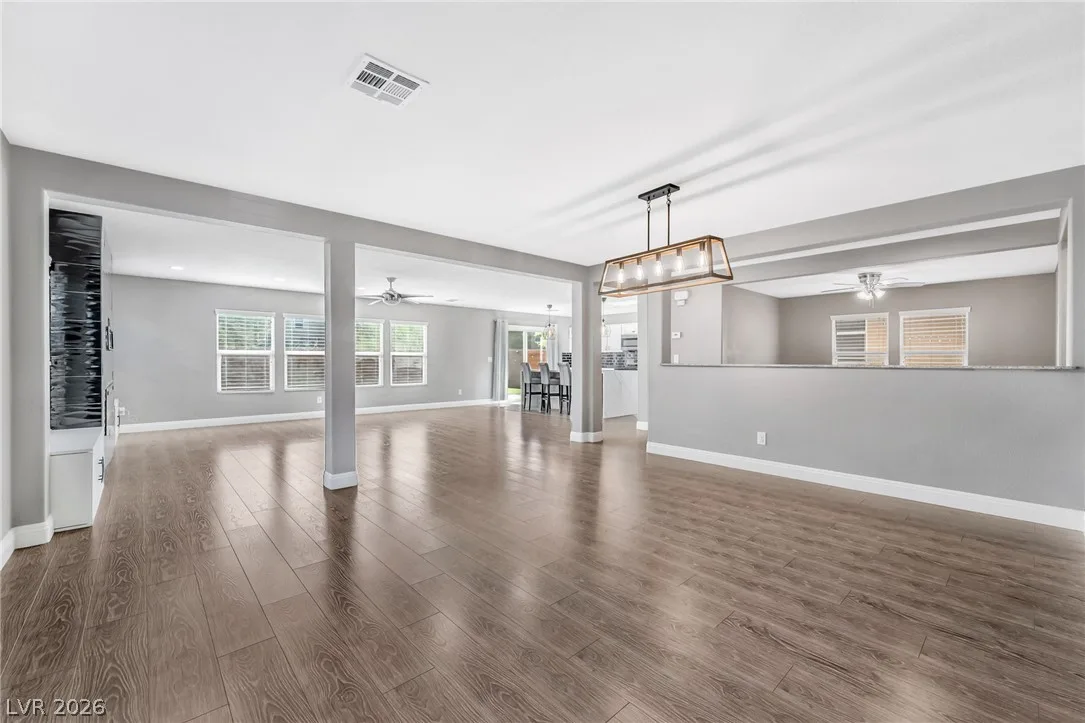
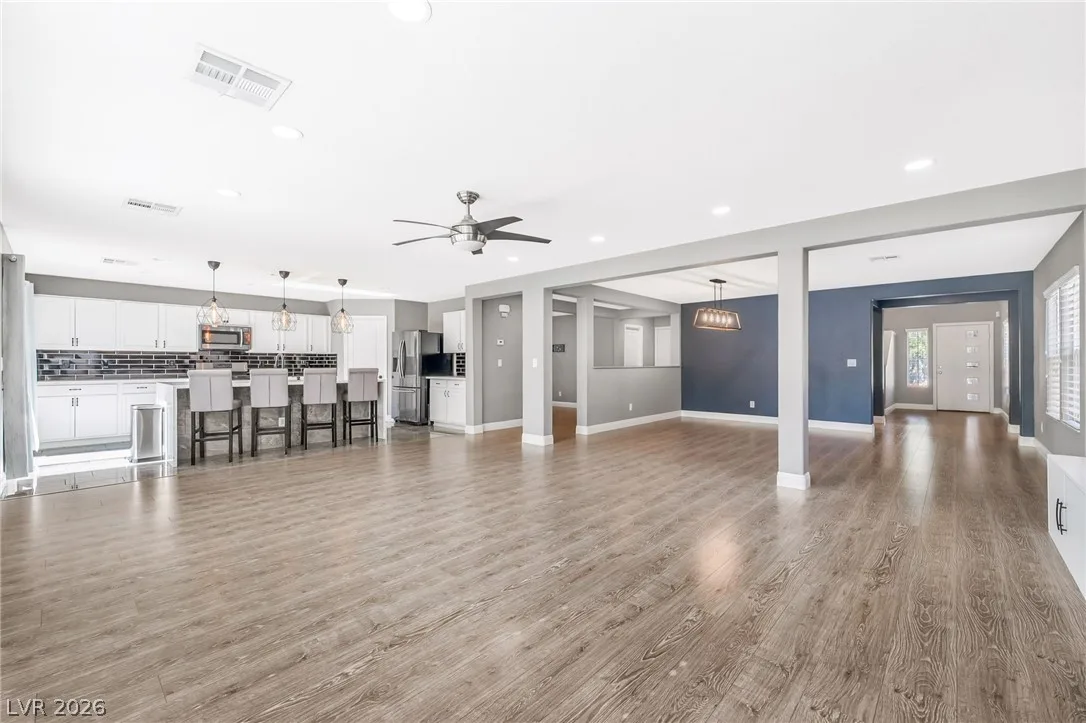
714 Kibbey Street, Las Vegas, NV 89178
Status: Sold
$2,645 Sold Price
$1
$ / Sq Ft
3,055
Living Area
4,792 sqft
Lot Size
4
Beds
3
Baths
2016
Year Built
Search Parameters
Property Type
Status
Radius
Sold Within
Beds
Baths
Living Area (Sq Ft)
Lot Size (Sq Ft)
This comp search reflects your current search parameters — adjust the filters above as needed for a more accurate estimate.
Estimated Value
—
Average $/Sqft
—
Check one or more comps below to calculate an estimate.
Nearest 10 of 28 comparable sales and listings within 1 mile of this home. Use the filters above and press Search to refine.
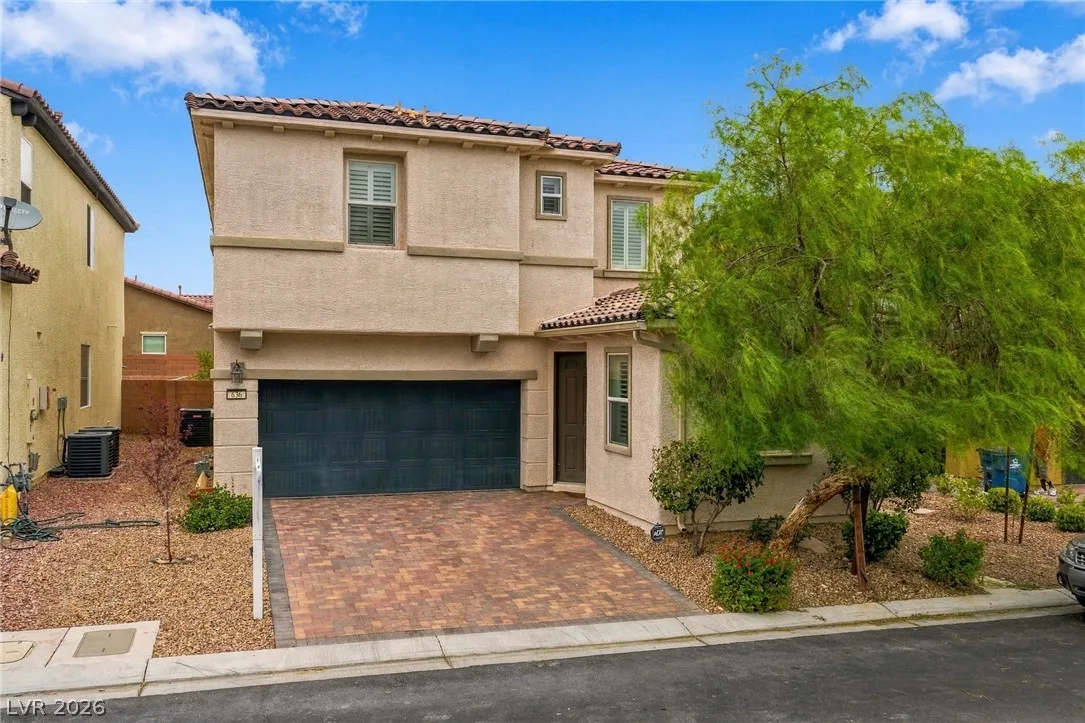
636 Crying Bird AvenueActive
$499,9984 bd3 ba2,332 sqft$214/sqft0.12 mi0 days
$530,0004 bd3 ba2,936 sqft$181/sqft0.19 mi134 daysSold 2026-05-20
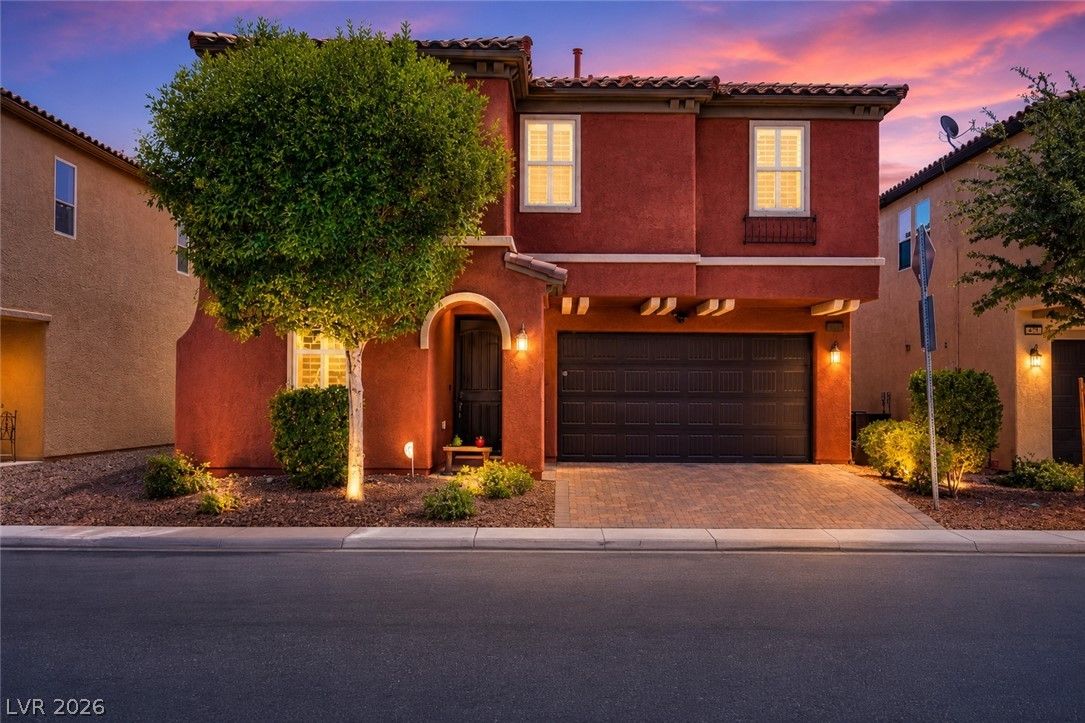
$575,0003 bd3 ba2,800 sqft$205/sqft0.20 mi35 daysSold 2026-08-17
$550,0005 bd4 ba2,474 sqft$222/sqft0.38 mi0 daysSold 2026-07-06
$650,0005 bd4 ba2,946 sqft$221/sqft0.38 mi18 daysSold 2026-04-27
$540,0004 bd3 ba2,328 sqft$232/sqft0.39 mi16 daysSold 2026-07-02
$509,0004 bd3 ba2,328 sqft$219/sqft0.41 mi11 daysSold 2026-06-01
$565,0005 bd3 ba2,767 sqft$204/sqft0.42 mi12 daysSold 2026-06-01
$480,0003 bd3 ba2,492 sqft$193/sqft0.48 mi59 daysSold 2026-05-06

817 Orchard Course DriveActive
$639,9003 bd3 ba2,632 sqft$243/sqft0.54 mi37 days
Nearest comparable sales and listings
12 comparables · median price $557,500 · range $480,000 – $650,000 · median $/sq ft $217 · average $/sq ft $213
| Address | Status | Price | $/Sq Ft | Bd / Ba | Sq Ft | Sold / market time | Distance |
|---|---|---|---|---|---|---|---|
| 636 Crying Bird Avenue | Active | $499,998 | $214 | 4 / 3 | 2,332 | 0 days on market | 0.12 mi |
| 971 Huntington Cove Parkway | Sold | $530,000 | $181 | 4 / 3 | 2,936 | Sold 2026-05-20 | 0.19 mi |
| 984 Pretty Fire Street | Sold | $575,000 | $205 | 3 / 3 | 2,800 | Sold 2026-08-17 | 0.20 mi |
| 936 Safe Sapphire Way | Sold | $550,000 | $222 | 5 / 4 | 2,474 | Sold 2026-07-06 | 0.38 mi |
| 9956 West Cougar Avenue | Sold | $650,000 | $221 | 5 / 4 | 2,946 | Sold 2026-04-27 | 0.38 mi |
| 8623 Reynolds Spring Street | Sold | $540,000 | $232 | 4 / 3 | 2,328 | Sold 2026-07-02 | 0.39 mi |
| 8624 Earl Creek Street | Sold | $509,000 | $219 | 4 / 3 | 2,328 | Sold 2026-06-01 | 0.41 mi |
| 9990 Bleeding Heart Avenue | Sold | $565,000 | $204 | 5 / 3 | 2,767 | Sold 2026-06-01 | 0.42 mi |
| 436 Merseyside Drive | Sold | $480,000 | $193 | 3 / 3 | 2,492 | Sold 2026-05-06 | 0.48 mi |
| 817 Orchard Course Drive | Active | $639,900 | $243 | 3 / 3 | 2,632 | 37 days on market | 0.54 mi |
| 328 Cranstonhill Drive | Active | $610,000 | $202 | 5 / 3 | 3,015 | 0 days on market | 0.56 mi |
| 9463 Brough Avenue | Under Contract | $579,000 | $222 | 4 / 3 | 2,604 | 13 days on market | 0.56 mi |


