
Comparable Sales Near 5805 Trent Avenue, Las Vegas, NV 89107
1st Realty · Comparable sales report · 1st.estate · October 21, 2026
Browse our Las Vegas area guides →
5805 Trent Avenue, Las Vegas, NV 89107
Status: Sold
$2,100 Sold Price
$1
$ / Sq Ft
1,974
Living Area
9,148 sqft
Lot Size
3
Beds
2
Baths
1977
Year Built
Search Parameters
Property Type
Status
Radius
Sold Within
Beds
Baths
Living Area (Sq Ft)
Lot Size (Sq Ft)
This comp search reflects your current search parameters — adjust the filters above as needed for a more accurate estimate.
Estimated Value
—
Average $/Sqft
—
Check one or more comps below to calculate an estimate.
Nearest 10 of 19 comparable sales and listings within 1 mile of this home. Use the filters above and press Search to refine.
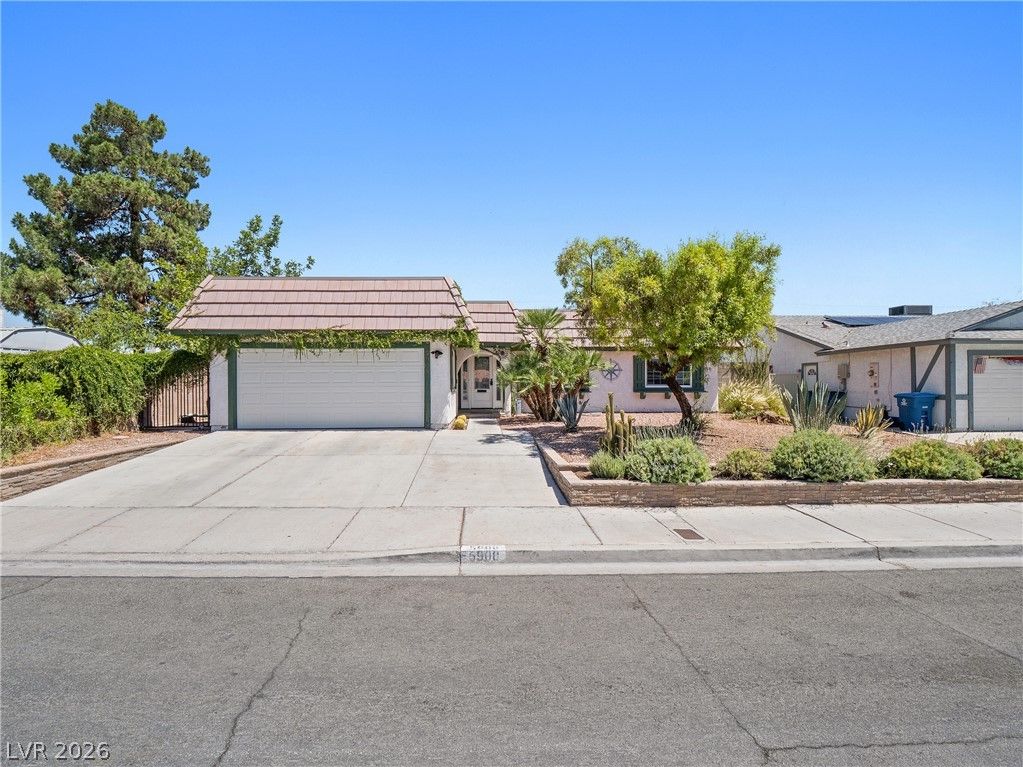
$434,0003 bd2 ba1,492 sqft$291/sqft0.10 mi25 daysSold 2026-08-11
$500,0004 bd2 ba1,662 sqft$301/sqft0.12 mi5 daysSold 2026-04-28
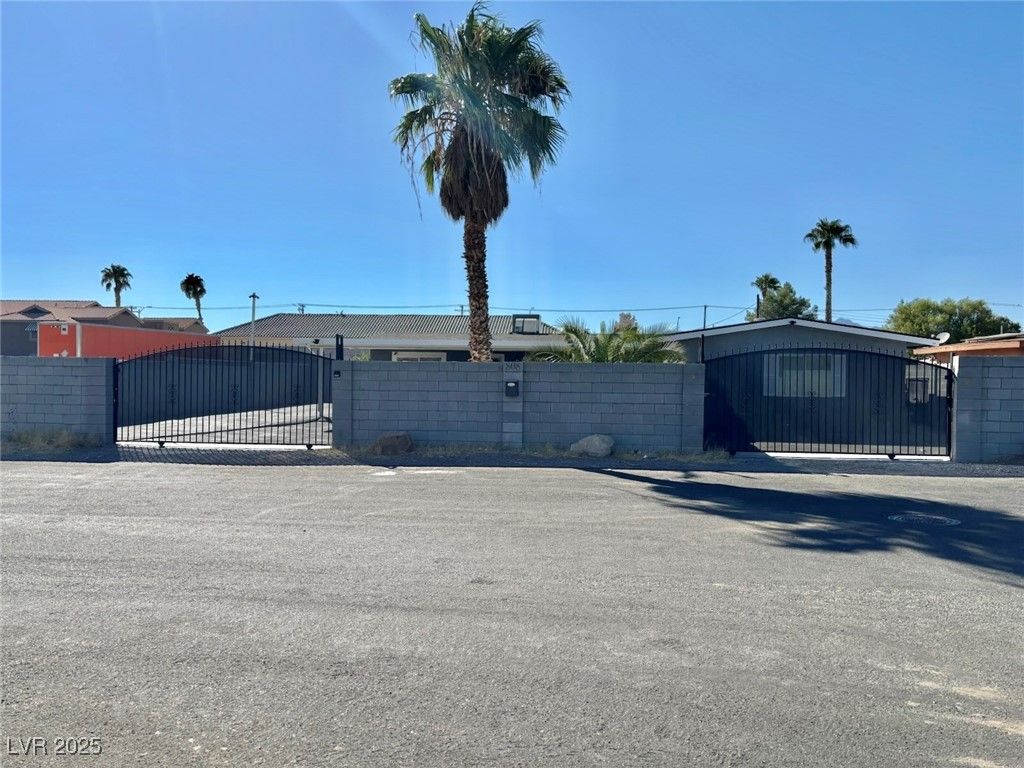
808 South Mallard StreetActive
$498,0004 bd3 ba1,841 sqft$271/sqft0.13 mi186 days
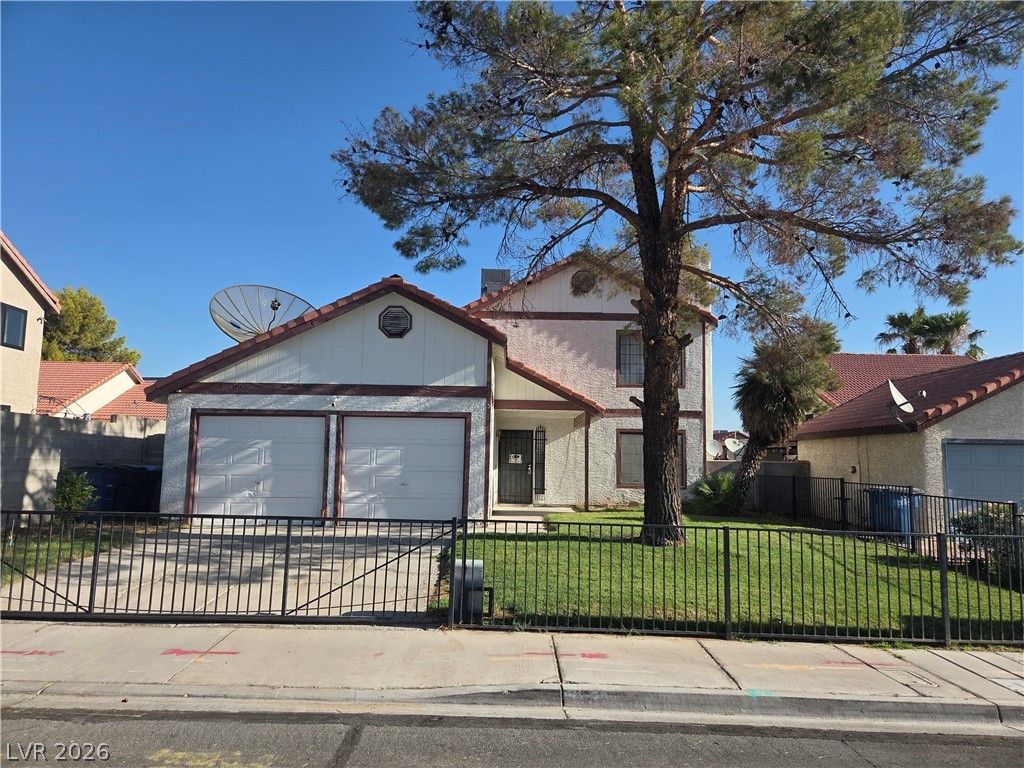
5312 Alpine PlaceActive
$429,9004 bd2 ba2,208 sqft$195/sqft0.37 mi40 days
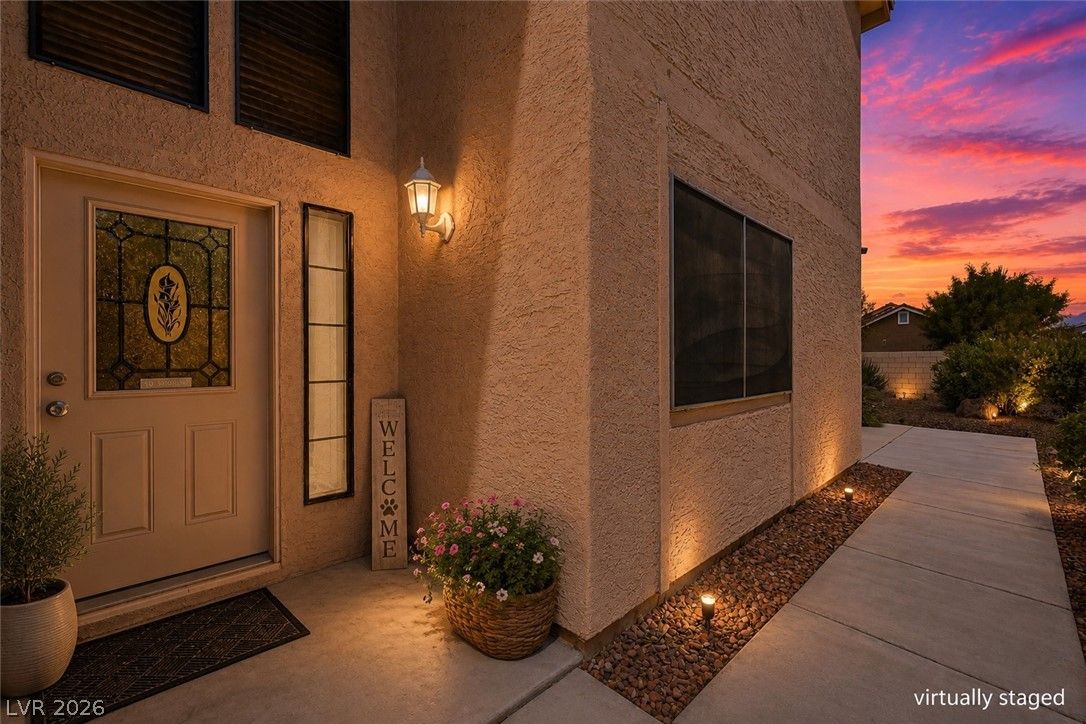
$425,0003 bd2 ba2,021 sqft$210/sqft0.44 mi5 daysSold 2026-08-28
$319,0002 bd2 ba1,809 sqft$176/sqft0.59 mi20 daysSold 2026-06-22

5204 Holmby AvenueActive
$469,9994 bd2 ba1,751 sqft$268/sqft0.65 mi8 days
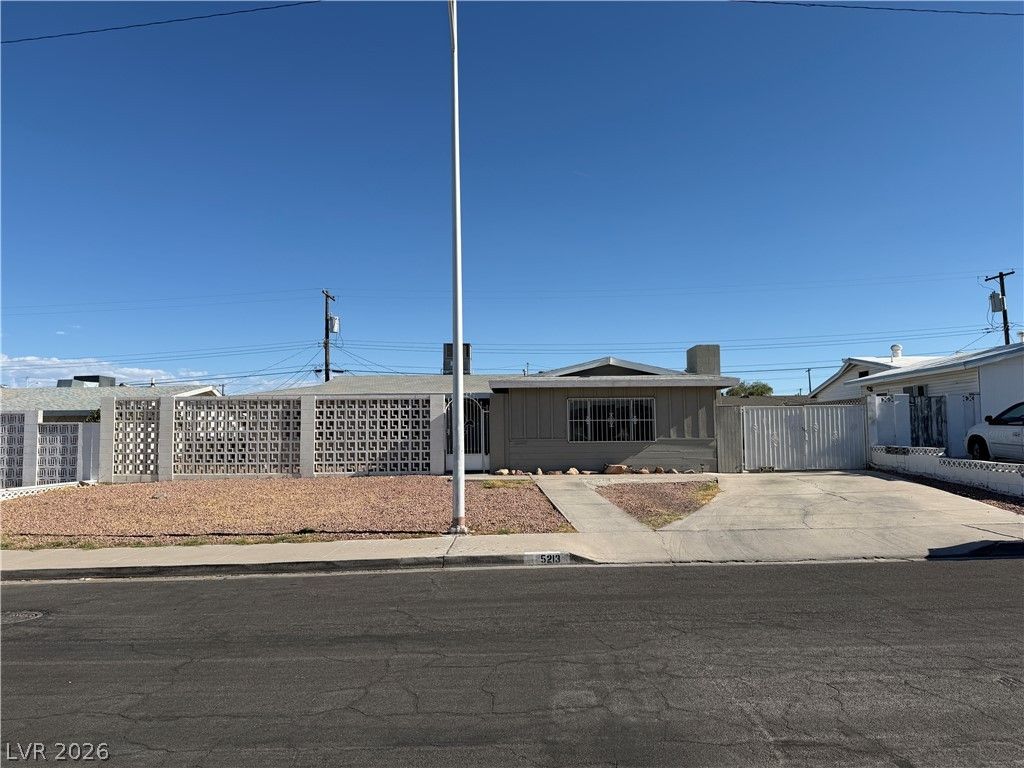
$350,0004 bd2 ba1,751 sqft$200/sqft0.66 mi20 daysSold 2026-08-28
$373,0003 bd2 ba1,751 sqft$213/sqft0.71 mi121 daysSold 2026-06-29
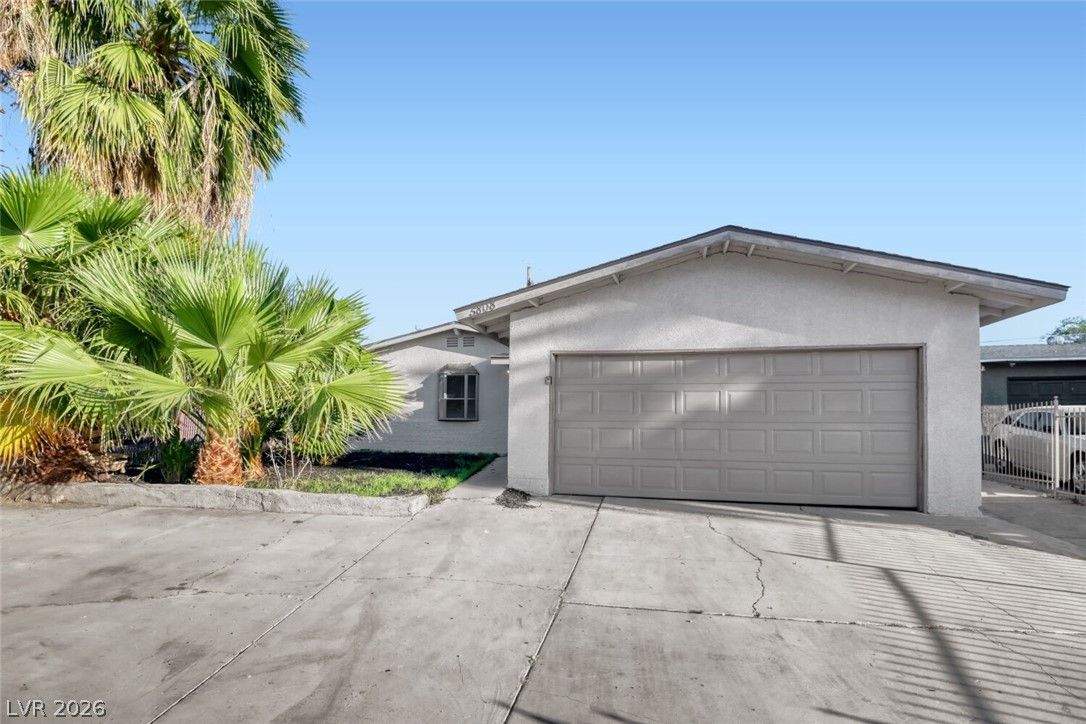
5808 South Lydia DriveActive
$384,9003 bd2 ba1,562 sqft$246/sqft0.73 mi176 days
Nearest comparable sales and listings
12 comparables · median price $417,500 · range $319,000 – $500,000 · median $/sq ft $224 · average $/sq ft $232
| Address | Status | Price | $/Sq Ft | Bd / Ba | Sq Ft | Sold / market time | Distance |
|---|---|---|---|---|---|---|---|
| 5908 Concert Drive | Sold | $434,000 | $291 | 3 / 2 | 1,492 | Sold 2026-08-11 | 0.10 mi |
| 800 South Mallard Street | Sold | $500,000 | $301 | 4 / 2 | 1,662 | Sold 2026-04-28 | 0.12 mi |
| 808 South Mallard Street | Active | $498,000 | $271 | 4 / 3 | 1,841 | 186 days on market | 0.13 mi |
| 5312 Alpine Place | Active | $429,900 | $195 | 4 / 2 | 2,208 | 40 days on market | 0.37 mi |
| 5204 Alpine Place | Sold | $425,000 | $210 | 3 / 2 | 2,021 | Sold 2026-08-28 | 0.44 mi |
| 353 Mill Hollow Road | Sold | $319,000 | $176 | 2 / 2 | 1,809 | Sold 2026-06-22 | 0.59 mi |
| 5204 Holmby Avenue | Active | $469,999 | $268 | 4 / 2 | 1,751 | 8 days on market | 0.65 mi |
| 5213 Longridge Avenue | Sold | $350,000 | $200 | 4 / 2 | 1,751 | Sold 2026-08-28 | 0.66 mi |
| 5132 Del Rey Avenue | Sold | $373,000 | $213 | 3 / 2 | 1,751 | Sold 2026-06-29 | 0.71 mi |
| 5808 South Lydia Drive | Active | $384,900 | $246 | 3 / 2 | 1,562 | 176 days on market | 0.73 mi |
| 1205 Squires Street | Sold | $410,000 | $234 | 4 / 2 | 1,751 | Sold 2026-07-14 | 0.74 mi |
| 1308 Montclair Street | Active | $350,000 | $180 | 3 / 2 | 1,944 | 160 days on market | 0.79 mi |


