
Comparable Sales Near 7329 LATTIMORE Drive, Las Vegas, NV 89155
1st Realty · Comparable sales report · 1st.estate · October 20, 2026
Browse our Las Vegas area guides →
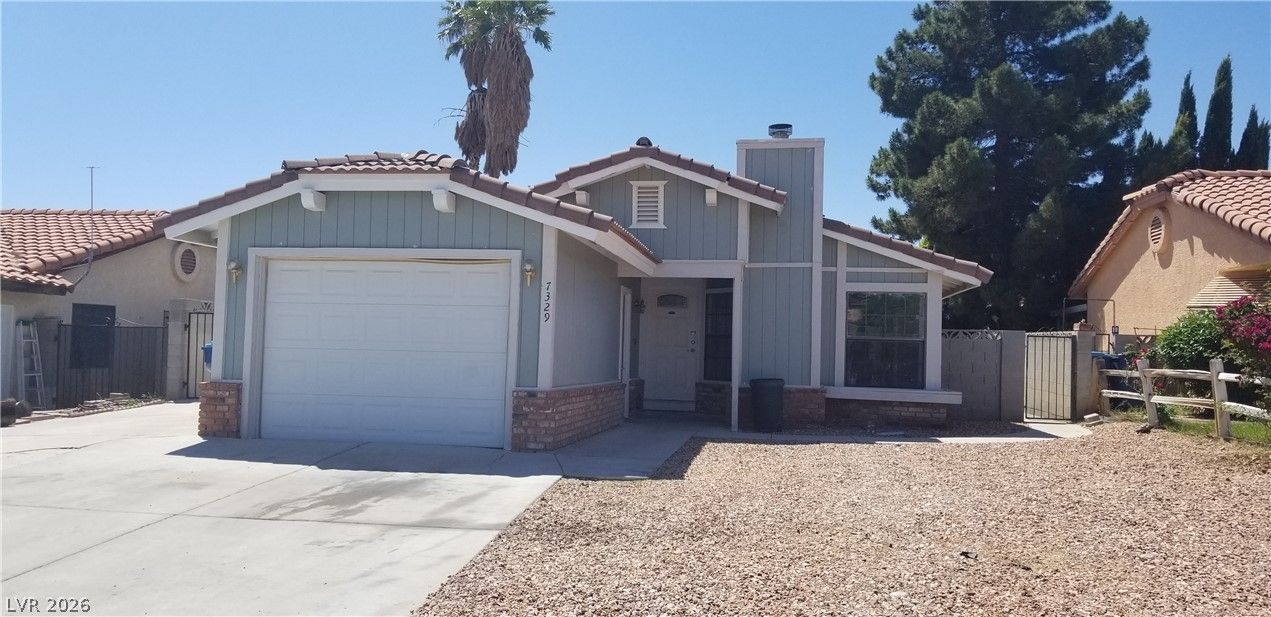
7329 LATTIMORE Drive, Las Vegas, NV 89155
Status: Sold
$1,700 Sold Price
$2
$ / Sq Ft
922
Living Area
—
Lot Size
2
Beds
2
Baths
1986
Year Built
Search Parameters
Property Type
Status
Radius
Sold Within
Beds
Baths
Living Area (Sq Ft)
Lot Size (Sq Ft)
This comp search reflects your current search parameters — adjust the filters above as needed for a more accurate estimate.
Estimated Value
—
Average $/Sqft
—
Check one or more comps below to calculate an estimate.
Nearest 10 of 17 comparable sales and listings within 1 mile of this home. Use the filters above and press Search to refine.
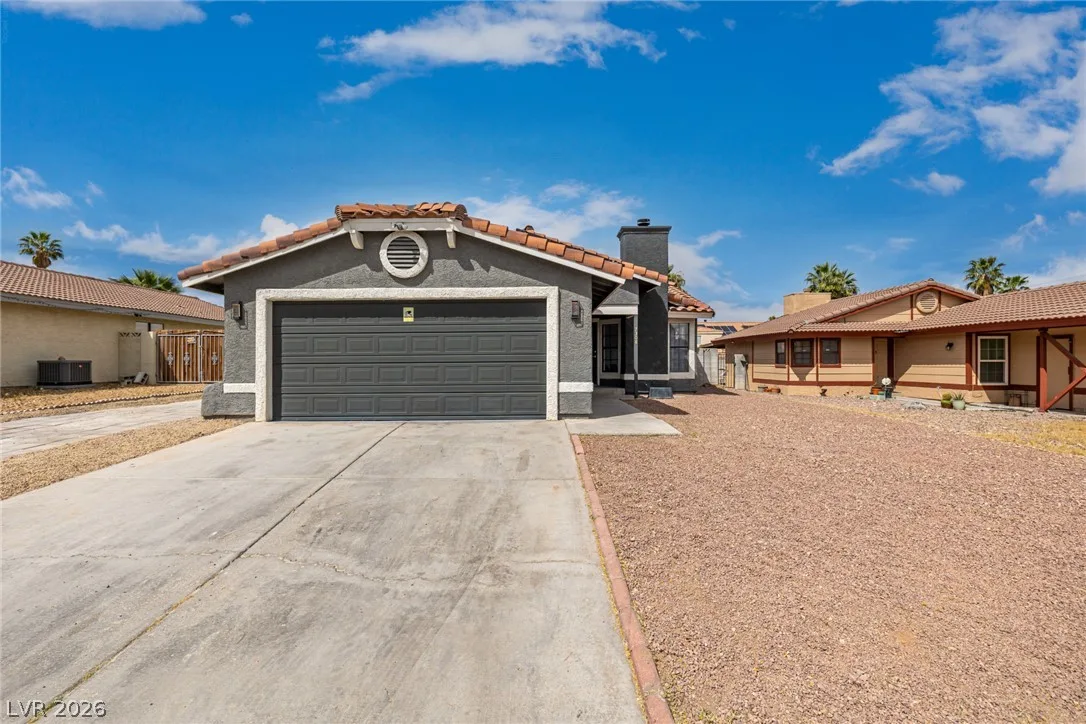
$369,9003 bd2 ba1,039 sqft$356/sqft0.07 mi0 days
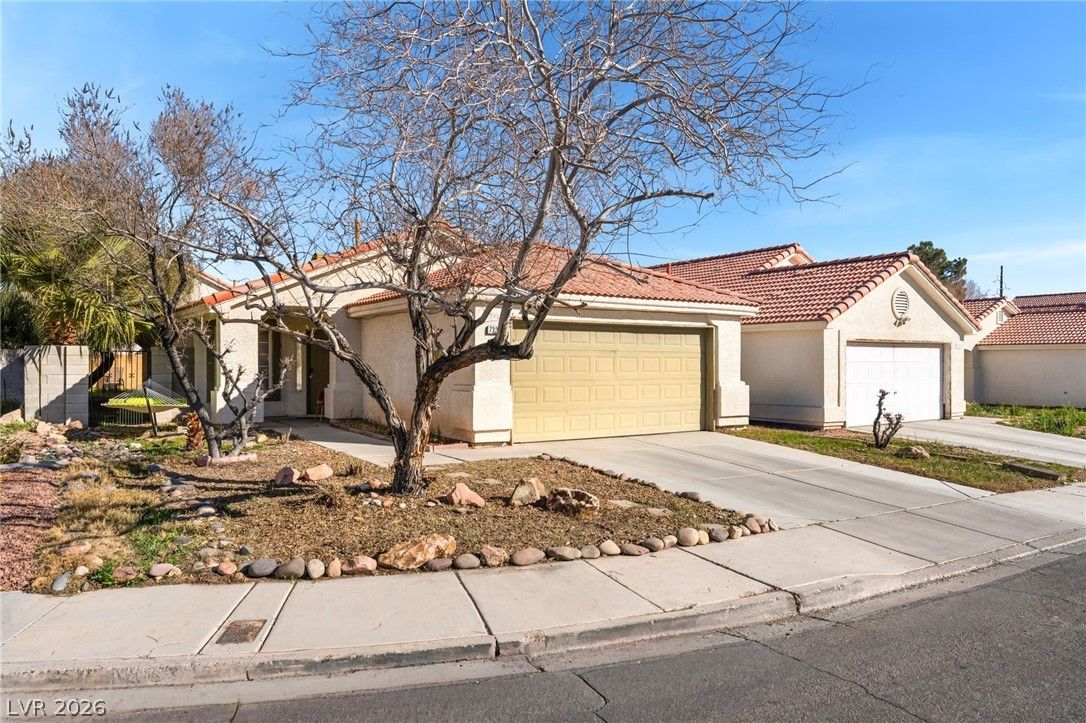
$380,0003 bd2 ba1,143 sqft$332/sqft0.07 mi111 daysSold 2026-08-11
$380,0002 bd2 ba1,130 sqft$336/sqft0.21 mi27 daysSold 2026-06-11

1109 Olvera WayActive
$409,0003 bd2 ba1,143 sqft$358/sqft0.28 mi67 days
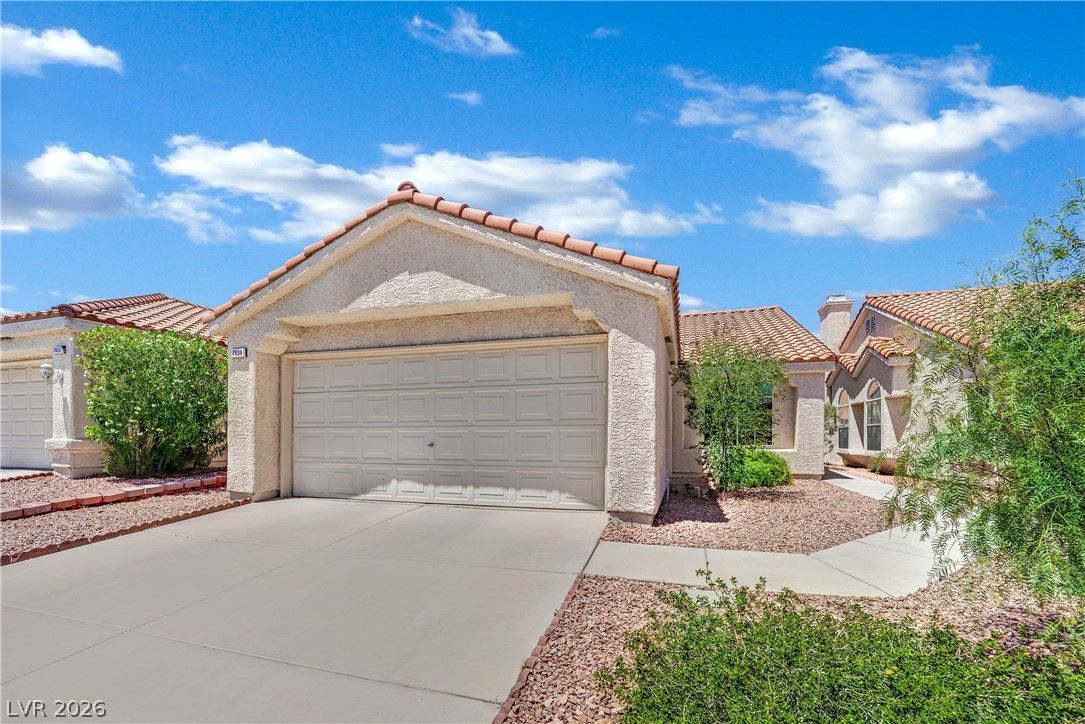
7608 Haskell Flats DriveActive
$399,9993 bd2 ba1,134 sqft$353/sqft0.52 mi138 days
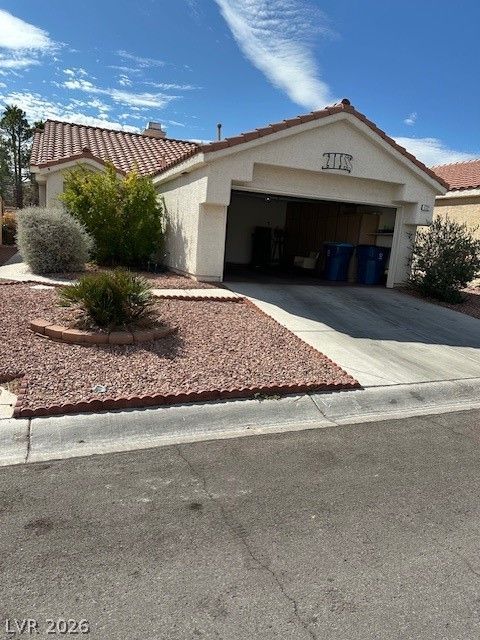
7721 Rockfield DriveActive
$420,0003 bd2 ba1,134 sqft$370/sqft0.60 mi116 days
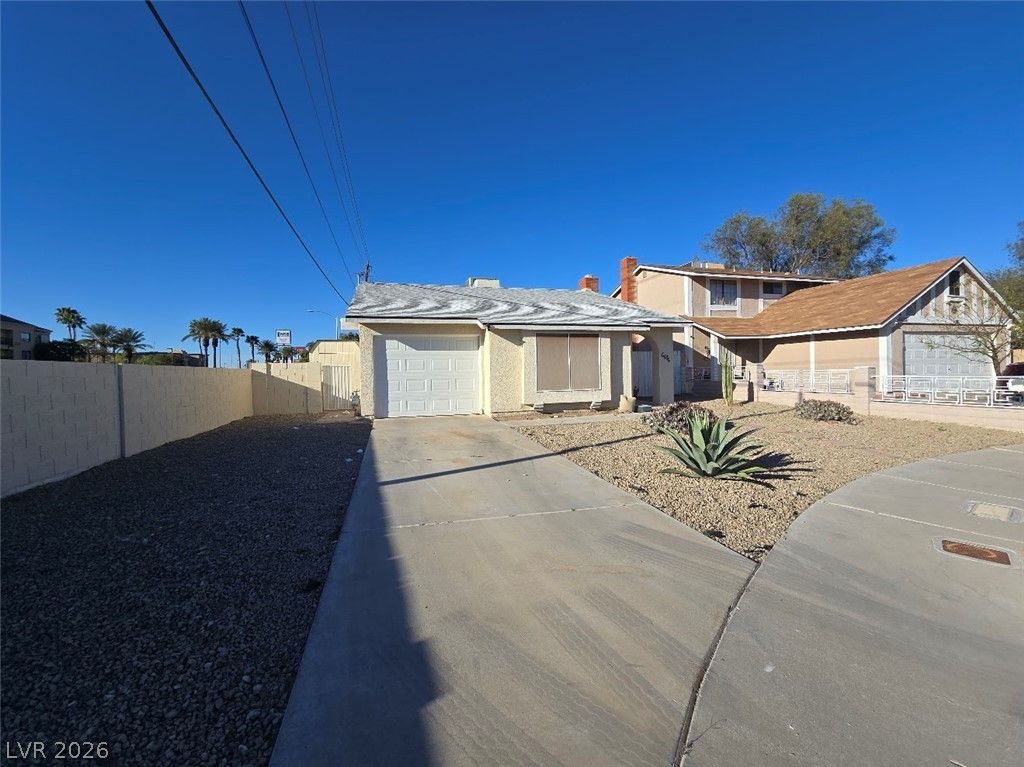
$280,0002 bd1 ba896 sqft$313/sqft0.67 mi13 daysSold 2026-09-29
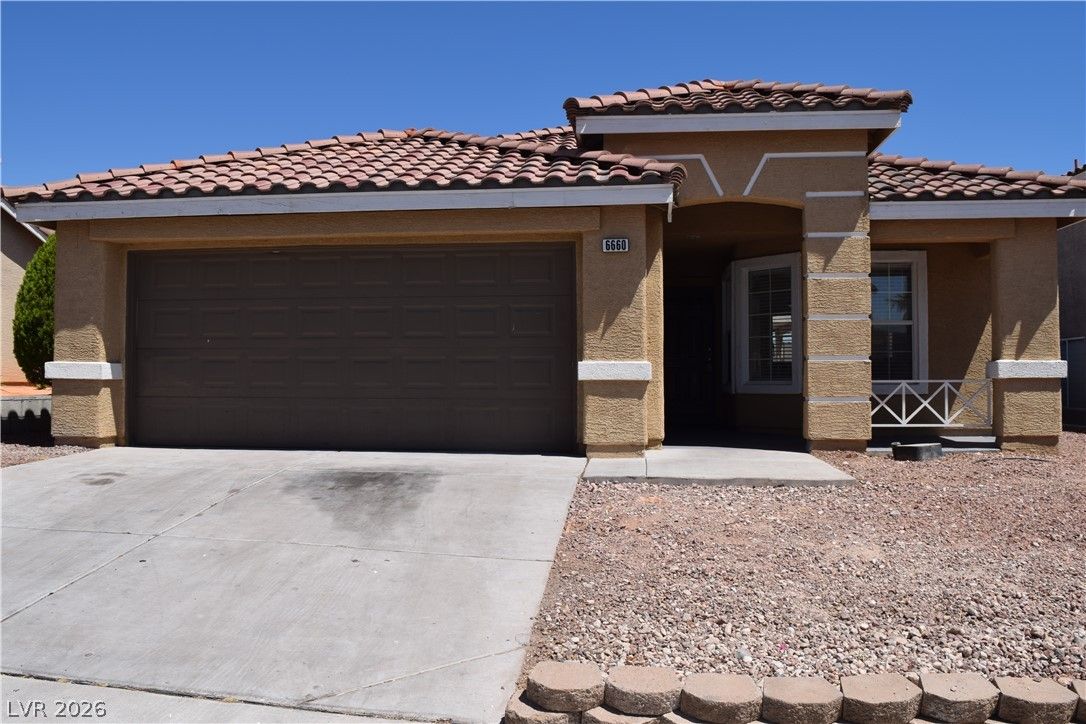
$365,0003 bd2 ba1,085 sqft$336/sqft0.68 mi4 daysSold 2026-08-11
$310,0003 bd2 ba1,125 sqft$276/sqft0.73 mi33 daysSold 2026-07-10
6637 Lund DriveSold
$330,0003 bd2 ba1,069 sqft$309/sqft0.74 mi195 daysSold 2026-04-28
Nearest comparable sales and listings
12 comparables · median price $367,450 · range $280,000 – $420,000 · median $/sq ft $334 · average $/sq ft $327
| Address | Status | Price | $/Sq Ft | Bd / Ba | Sq Ft | Sold / market time | Distance |
|---|---|---|---|---|---|---|---|
| 7308 Saybrook Point Drive | Active | $369,900 | $356 | 3 / 2 | 1,039 | 0 days on market | 0.07 mi |
| 7320 Silver Ridge Drive | Sold | $380,000 | $332 | 3 / 2 | 1,143 | Sold 2026-08-11 | 0.07 mi |
| 7400 Queen Palm Drive | Sold | $380,000 | $336 | 2 / 2 | 1,130 | Sold 2026-06-11 | 0.21 mi |
| 1109 Olvera Way | Active | $409,000 | $358 | 3 / 2 | 1,143 | 67 days on market | 0.28 mi |
| 7608 Haskell Flats Drive | Active | $399,999 | $353 | 3 / 2 | 1,134 | 138 days on market | 0.52 mi |
| 7721 Rockfield Drive | Active | $420,000 | $370 | 3 / 2 | 1,134 | 116 days on market | 0.60 mi |
| 6676 Fredonia Drive | Sold | $280,000 | $313 | 2 / 1 | 896 | Sold 2026-09-29 | 0.67 mi |
| 6660 Lost Dutchman Drive | Sold | $365,000 | $336 | 3 / 2 | 1,085 | Sold 2026-08-11 | 0.68 mi |
| 1928 Harvest Drive | Sold | $310,000 | $276 | 3 / 2 | 1,125 | Sold 2026-07-10 | 0.73 mi |
| 6637 Lund Drive | Sold | $330,000 | $309 | 3 / 2 | 1,069 | Sold 2026-04-28 | 0.74 mi |
| 6648 Gazelle Drive | Sold | $288,000 | $250 | 3 / 1 | 1,150 | Sold 2026-07-01 | 0.74 mi |
| 1520 Bonnie Castle Way | Active | $355,000 | $332 | 3 / 2 | 1,069 | 30 days on market | 0.75 mi |


