
Comparable Sales Near 9608 Langden Brook, Las Vegas, NV 89178
1st Realty · Comparable sales report · 1st.estate · October 20, 2026
Read the Enterprise neighborhood guide →
9608 Langden Brook, Las Vegas, NV 89178
Status: Sold
$440,000 Sold Price
$379
$ / Sq Ft
1,161
Living Area
4,356 sqft
Lot Size
2
Beds
2
Baths
2022
Year Built
Search Parameters
Property Type
Status
Radius
Sold Within
Beds
Baths
Living Area (Sq Ft)
Lot Size (Sq Ft)
This comp search reflects your current search parameters — adjust the filters above as needed for a more accurate estimate.
Estimated Value
—
Average $/Sqft
—
Check one or more comps below to calculate an estimate.
Nearest 8 of 8 comparable sales and listings within 1 mile of this home. Use the filters above and press Search to refine.
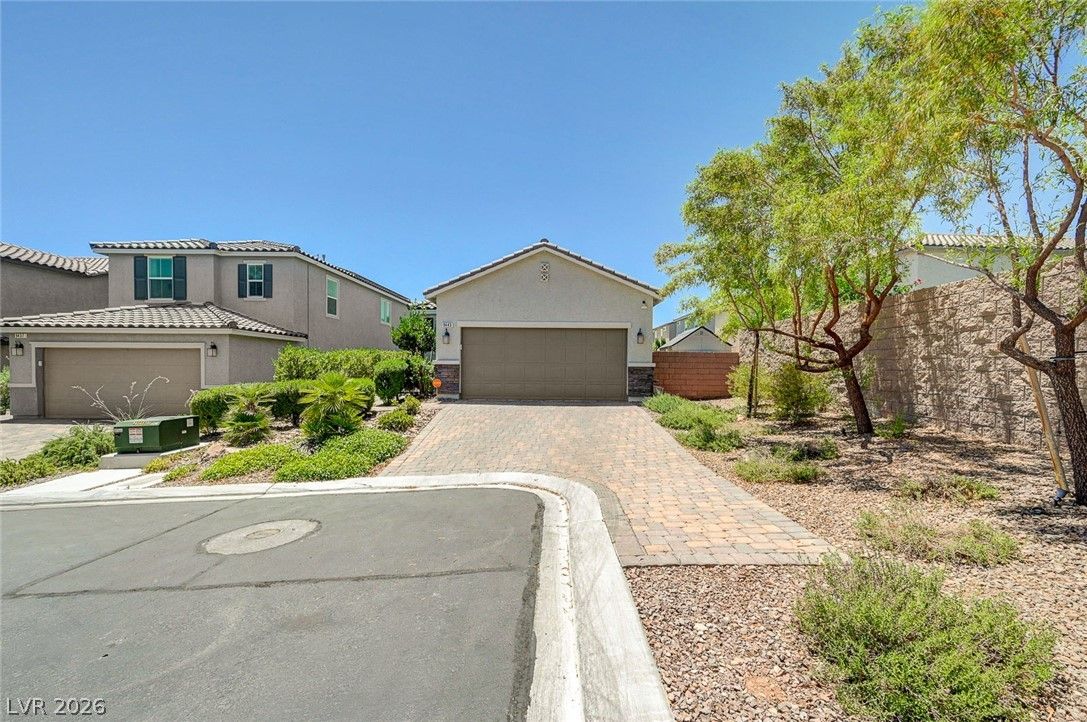
$449,9902 bd2 ba1,161 sqft$388/sqft0.05 mi17 daysSold 2026-07-29
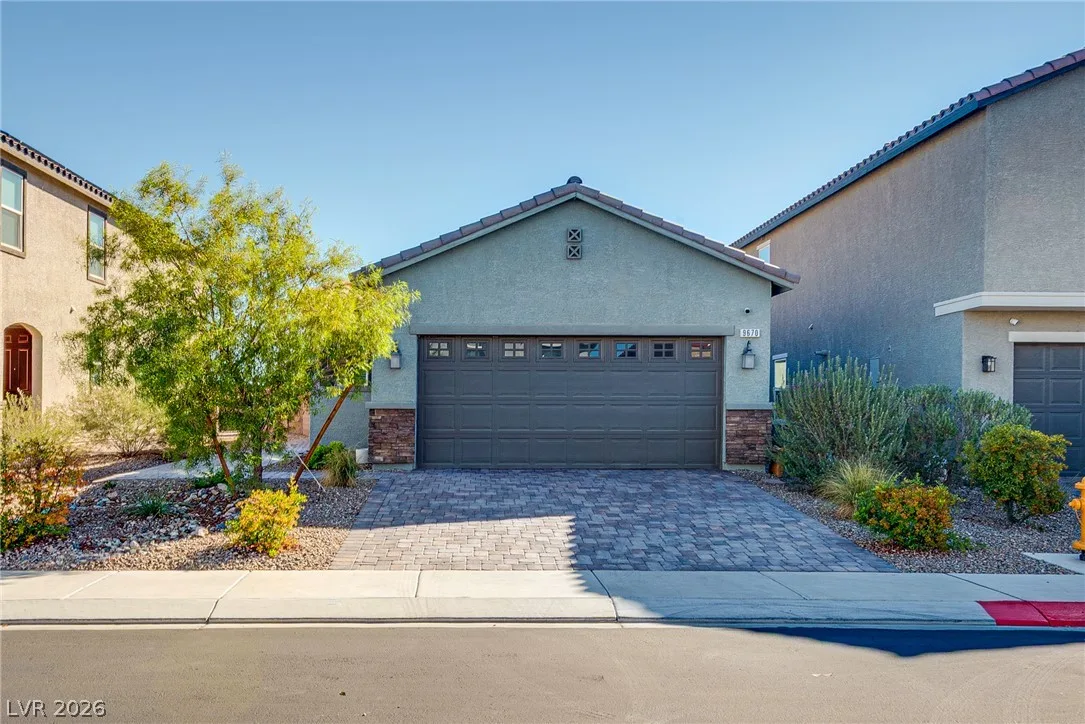
9670 Eamont River StreetActive
$445,8882 bd2 ba1,161 sqft$384/sqft0.09 mi1 days
$359,0002 bd3 ba1,240 sqft$290/sqft0.43 mi60 daysSold 2026-06-30
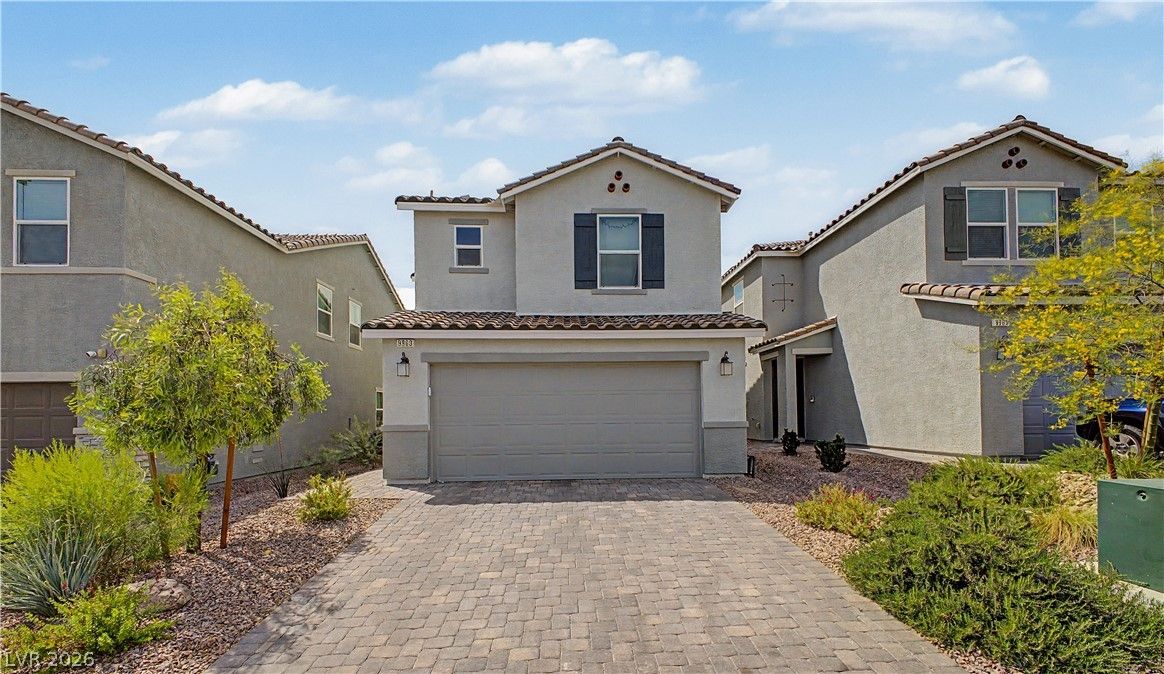
$417,5003 bd3 ba1,374 sqft$304/sqft0.73 mi59 daysSold 2026-07-27
9331 Parsnip Peak StreetActive
$417,5003 bd3 ba1,374 sqft$304/sqft0.78 mi7 days
$427,5003 bd2 ba1,422 sqft$301/sqft0.90 mi36 daysSold 2026-07-15
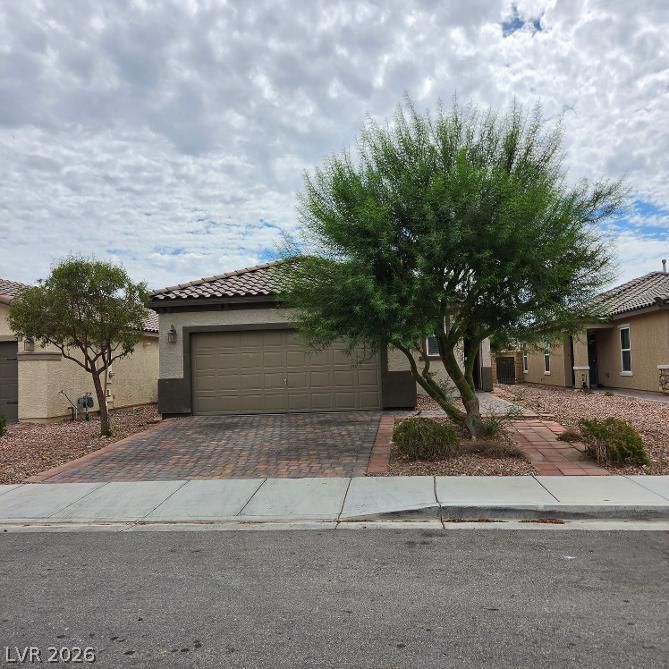
$425,0003 bd2 ba1,418 sqft$300/sqft0.98 mi18 daysSold 2026-08-31
$406,0003 bd2 ba1,418 sqft$286/sqft1.00 mi2 daysSold 2026-05-29
Nearest comparable sales and listings
8 comparables · median price $421,250 · range $359,000 – $449,990 · median $/sq ft $302 · average $/sq ft $319
| Address | Status | Price | $/Sq Ft | Bd / Ba | Sq Ft | Sold / market time | Distance |
|---|---|---|---|---|---|---|---|
| 9443 Cumberland Ranch Avenue | Sold | $449,990 | $388 | 2 / 2 | 1,161 | Sold 2026-07-29 | 0.05 mi |
| 9670 Eamont River Street | Active | $445,888 | $384 | 2 / 2 | 1,161 | 1 days on market | 0.09 mi |
| 9941 Mission Creek Inn Street | Sold | $359,000 | $290 | 2 / 3 | 1,240 | Sold 2026-06-30 | 0.43 mi |
| 9963 Ravenswood Peak Avenue | Sold | $417,500 | $304 | 3 / 3 | 1,374 | Sold 2026-07-27 | 0.73 mi |
| 9331 Parsnip Peak Street | Active | $417,500 | $304 | 3 / 3 | 1,374 | 7 days on market | 0.78 mi |
| 8734 Livermore Valley Avenue | Sold | $427,500 | $301 | 3 / 2 | 1,422 | Sold 2026-07-15 | 0.90 mi |
| 8852 West Quarterhorse Lane | Sold | $425,000 | $300 | 3 / 2 | 1,418 | Sold 2026-08-31 | 0.98 mi |
| 8840 Quarterhorse Lane | Sold | $406,000 | $286 | 3 / 2 | 1,418 | Sold 2026-05-29 | 1.00 mi |


