
Comparable Sales Near 1237 Taramar Street, North Las Vegas, NV 89031
1st Realty · Comparable sales report · 1st.estate · October 20, 2026
Read the North Las Vegas area guide →
1237 Taramar Street, North Las Vegas, NV 89031
Status: Sold
$385,000 Sold Price
$243
$ / Sq Ft
1,582
Living Area
4,792 sqft
Lot Size
3
Beds
2
Baths
1993
Year Built
Search Parameters
Property Type
Status
Radius
Sold Within
Beds
Baths
Living Area (Sq Ft)
Lot Size (Sq Ft)
This comp search reflects your current search parameters — adjust the filters above as needed for a more accurate estimate.
Estimated Value
—
Average $/Sqft
—
Check one or more comps below to calculate an estimate.
Nearest 10 of 45 comparable sales and listings within 1 mile of this home. Use the filters above and press Search to refine.
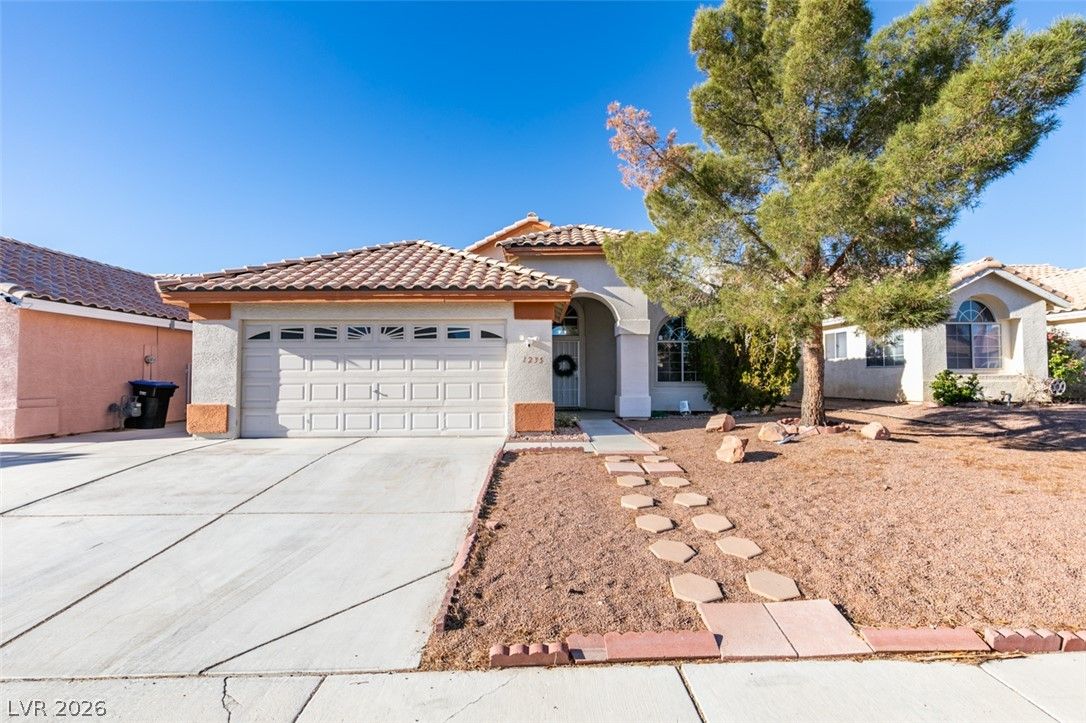
1235 Pagentry DriveActive
$379,9903 bd2 ba1,583 sqft$240/sqft0.05 mi55 days
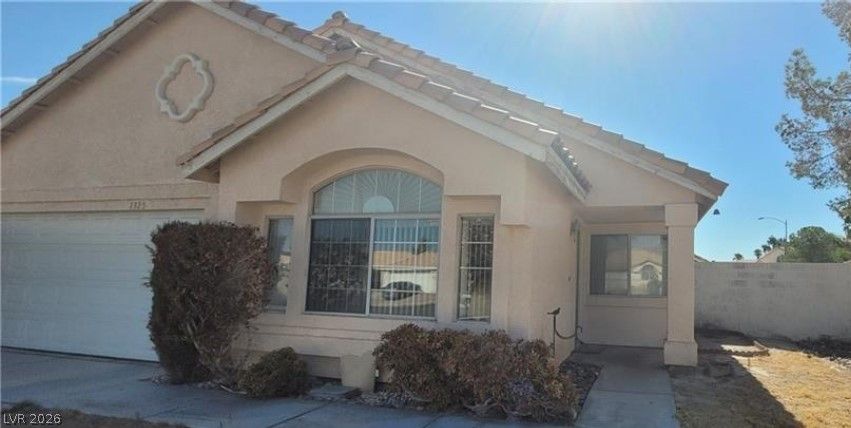
1325 Fiesta Grande CourtActive
$409,9002 bd2 ba1,248 sqft$328/sqft0.14 mi0 days
$357,0003 bd2 ba1,275 sqft$280/sqft0.18 mi28 daysSold 2026-10-06
$390,0003 bd2 ba1,318 sqft$296/sqft0.28 mi7 daysSold 2026-06-30
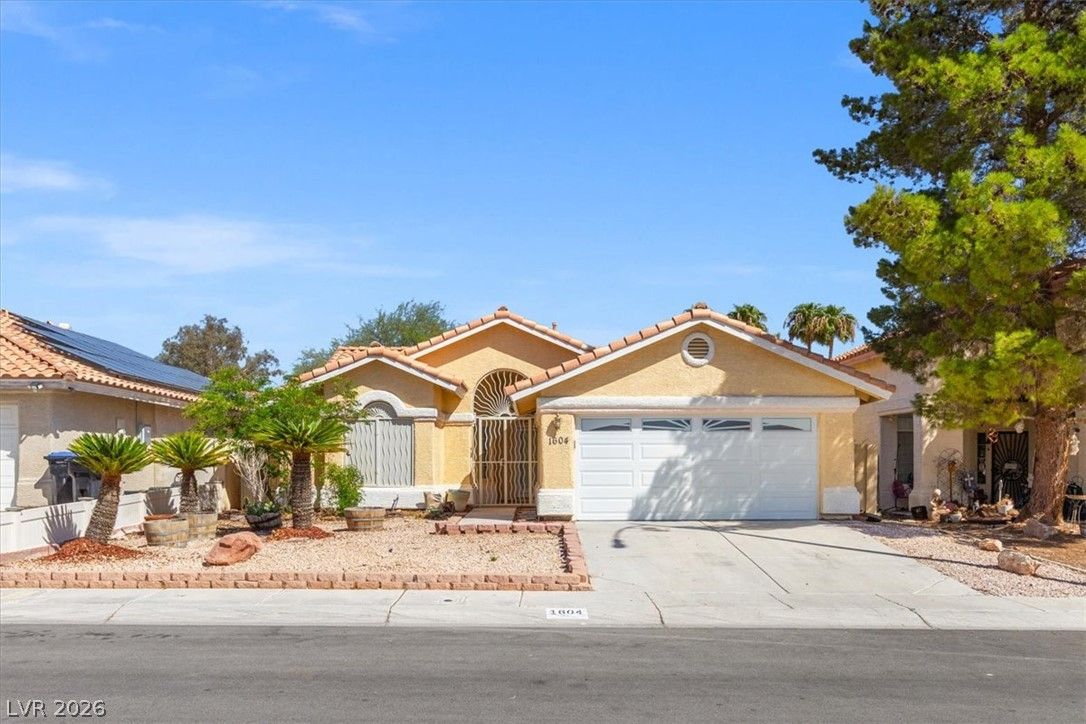
$375,0003 bd2 ba1,318 sqft$285/sqft0.33 mi4 daysSold 2026-10-16
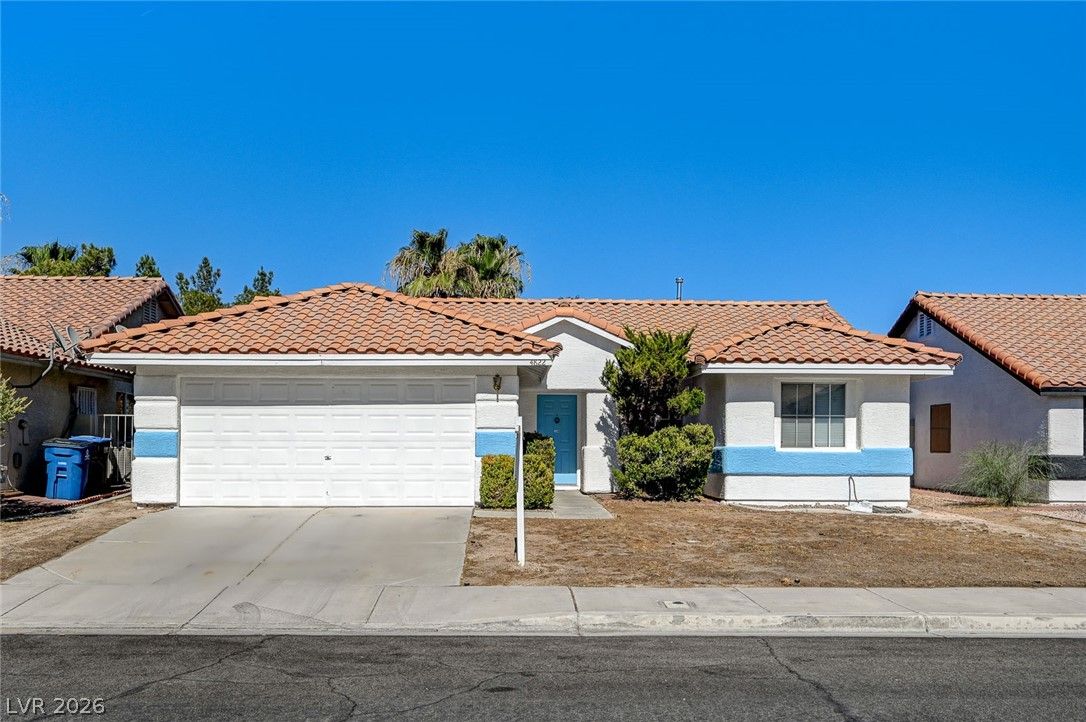
$350,0003 bd2 ba1,275 sqft$275/sqft0.34 mi25 daysSold 2026-08-18
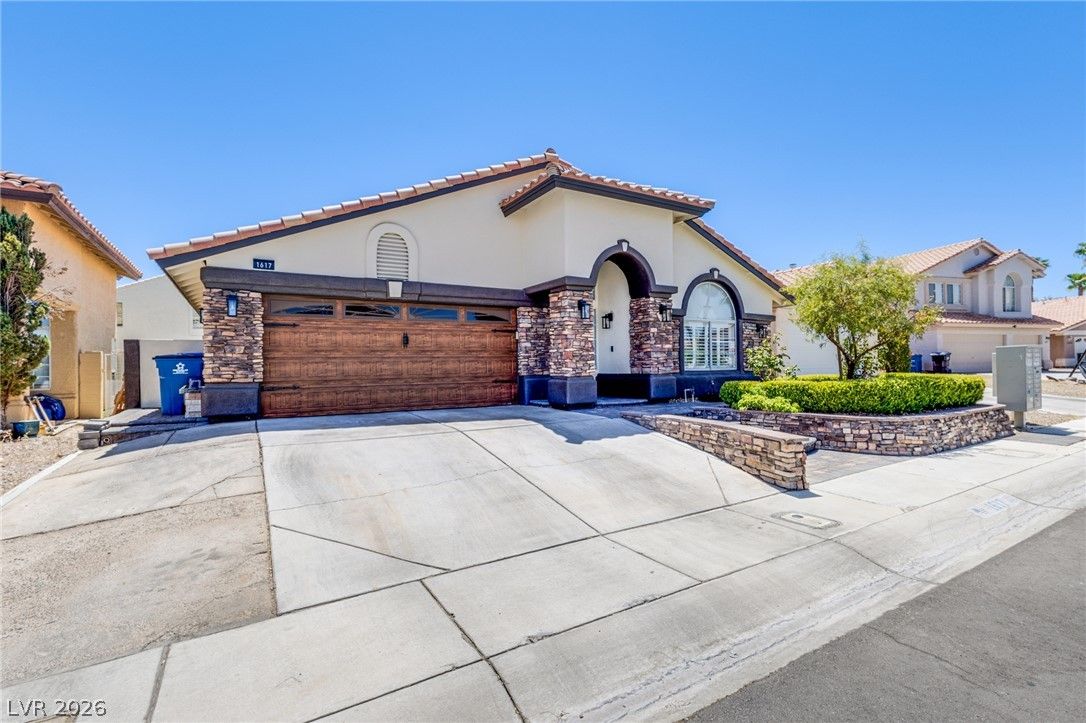
$439,5003 bd2 ba1,756 sqft$250/sqft0.37 mi8 daysSold 2026-09-02
$405,0003 bd3 ba1,599 sqft$253/sqft0.38 mi74 daysSold 2026-07-10
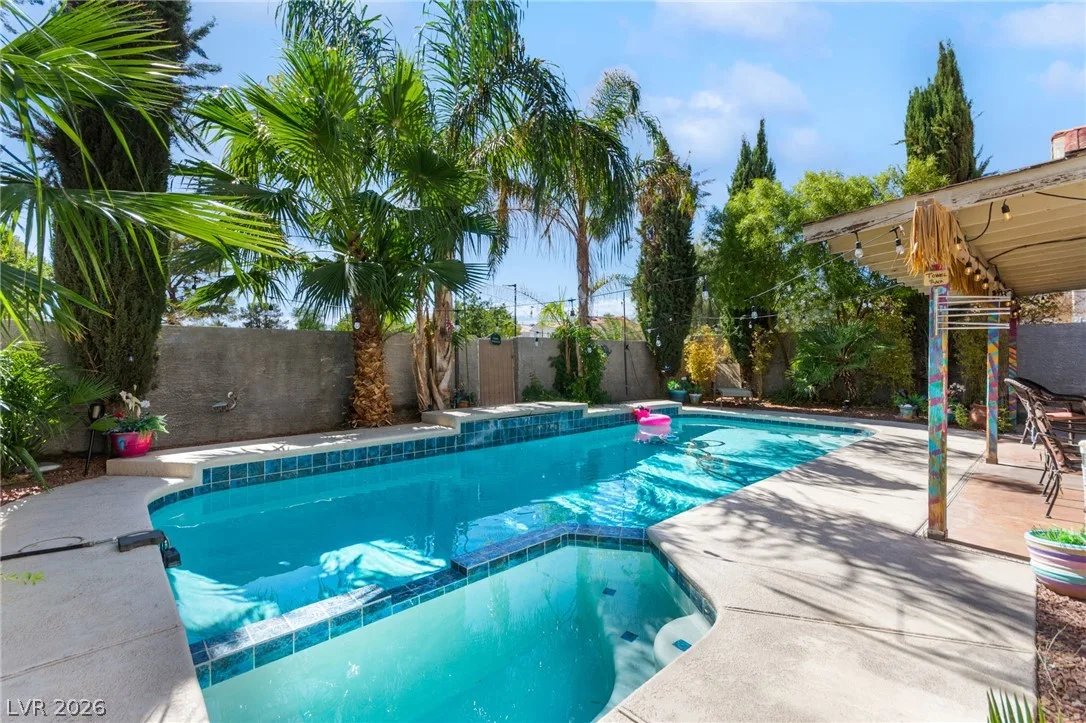
1731 Monte Alban DriveUnder Contract
$399,9003 bd3 ba1,599 sqft$250/sqft0.44 mi4 days
$370,0003 bd2 ba1,304 sqft$284/sqft0.46 mi38 daysSold 2026-06-18
Nearest comparable sales and listings
12 comparables · median price $384,995 · range $350,000 – $439,500 · median $/sq ft $274 · average $/sq ft $273
| Address | Status | Price | $/Sq Ft | Bd / Ba | Sq Ft | Sold / market time | Distance |
|---|---|---|---|---|---|---|---|
| 1235 Pagentry Drive | Active | $379,990 | $240 | 3 / 2 | 1,583 | 55 days on market | 0.05 mi |
| 1325 Fiesta Grande Court | Active | $409,900 | $328 | 2 / 2 | 1,248 | 0 days on market | 0.14 mi |
| 4934 Hunters Run Drive | Sold | $357,000 | $280 | 3 / 2 | 1,275 | Sold 2026-10-06 | 0.18 mi |
| 1600 Los Alamos Drive | Sold | $390,000 | $296 | 3 / 2 | 1,318 | Sold 2026-06-30 | 0.28 mi |
| 1604 Blanco Drive | Sold | $375,000 | $285 | 3 / 2 | 1,318 | Sold 2026-10-16 | 0.33 mi |
| 4822 Hunters Run Drive | Sold | $350,000 | $275 | 3 / 2 | 1,275 | Sold 2026-08-18 | 0.34 mi |
| 1617 Blanco Drive | Sold | $439,500 | $250 | 3 / 2 | 1,756 | Sold 2026-09-02 | 0.37 mi |
| 4948 El Sur Court | Sold | $405,000 | $253 | 3 / 3 | 1,599 | Sold 2026-07-10 | 0.38 mi |
| 1731 Monte Alban Drive | Under Contract | $399,900 | $250 | 3 / 3 | 1,599 | 4 days on market | 0.44 mi |
| 5115 Palo Pinto Lane | Sold | $370,000 | $284 | 3 / 2 | 1,304 | Sold 2026-06-18 | 0.46 mi |
| 1816 Panther Place | Active | $399,900 | $273 | 3 / 2 | 1,467 | 18 days on market | 0.51 mi |
| 1824 Panther Place | Sold | $360,000 | $257 | 2 / 2 | 1,400 | Sold 2026-08-28 | 0.53 mi |


