
Comparable Sales Near 5433 Bridgehampton Avenue, Las Vegas, NV 89130
1st Realty · Comparable sales report · 1st.estate · October 20, 2026
Browse our Las Vegas area guides →
5433 Bridgehampton Avenue, Las Vegas, NV 89130
Status: Sold
$398,900 Sold Price
$292
$ / Sq Ft
1,368
Living Area
4,356 sqft
Lot Size
3
Beds
2
Baths
2000
Year Built
Search Parameters
Property Type
Status
Radius
Sold Within
Beds
Baths
Living Area (Sq Ft)
Lot Size (Sq Ft)
This comp search reflects your current search parameters — adjust the filters above as needed for a more accurate estimate.
Estimated Value
—
Average $/Sqft
—
Check one or more comps below to calculate an estimate.
Nearest 10 of 19 comparable sales and listings within 1 mile of this home. Use the filters above and press Search to refine.
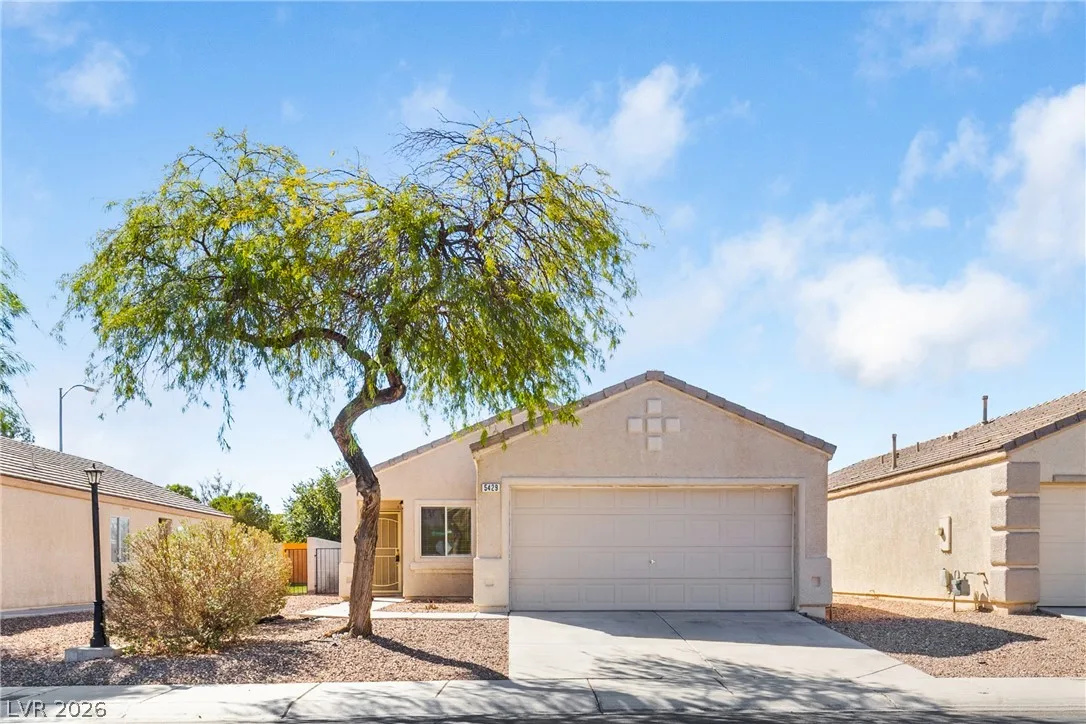
$380,0003 bd2 ba1,135 sqft$335/sqft0.01 mi1 days
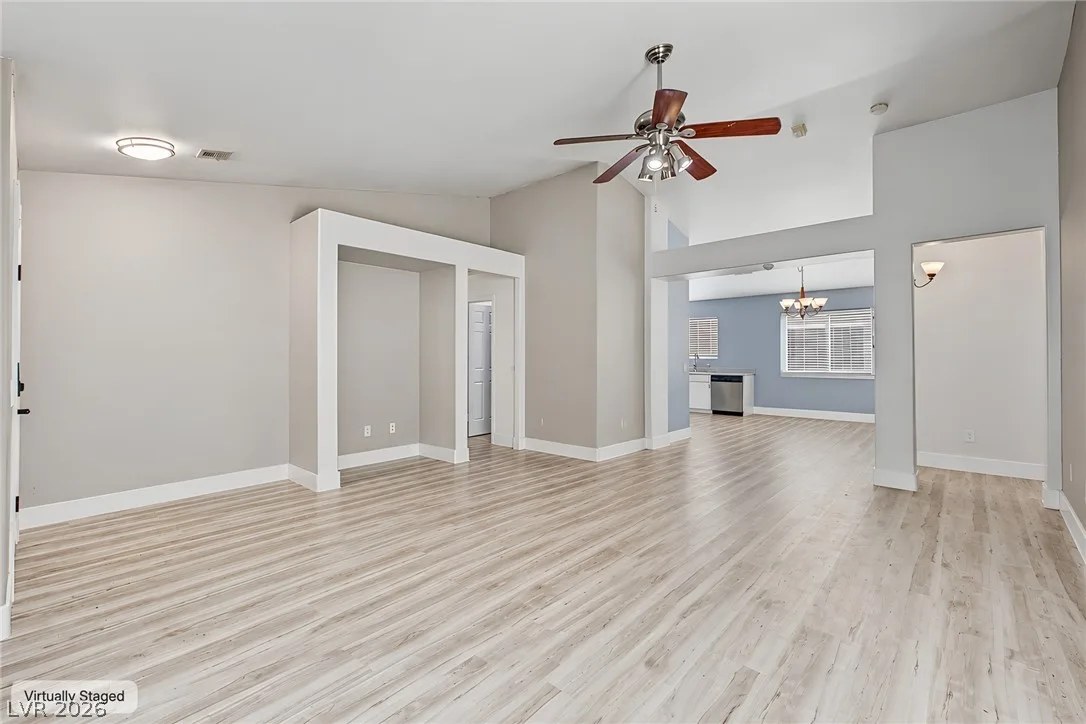
5921 Mount Auburn StreetActive
$399,9004 bd2 ba1,585 sqft$252/sqft0.08 mi0 days
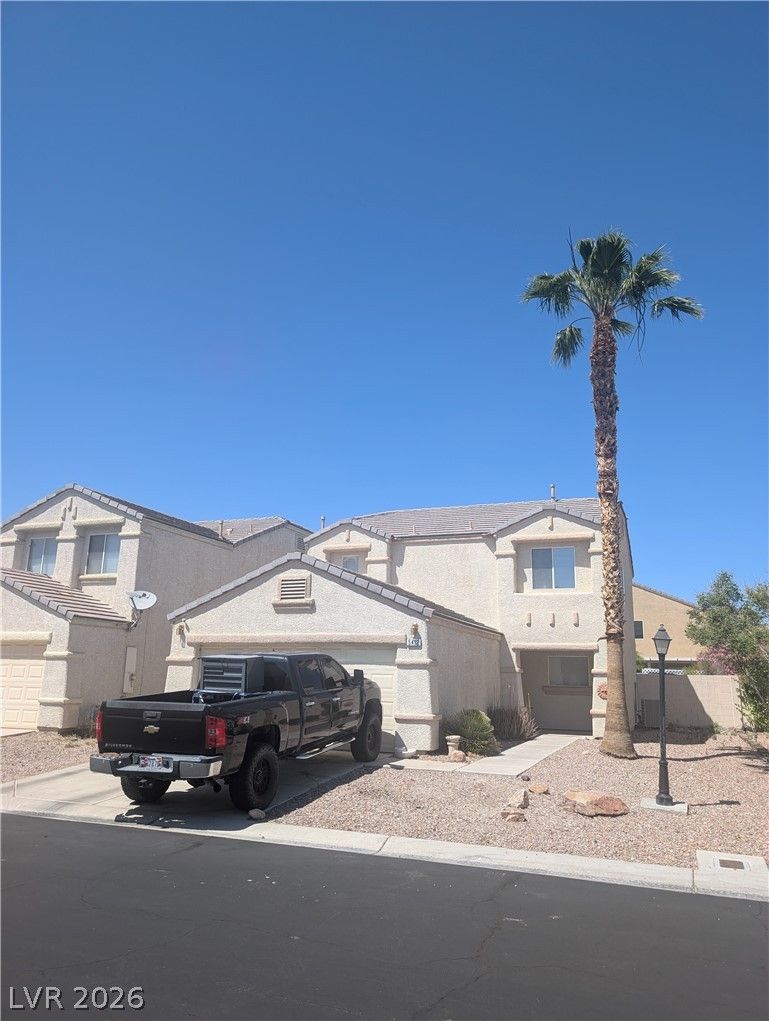
$425,0003 bd3 ba1,674 sqft$254/sqft0.23 mi9 days
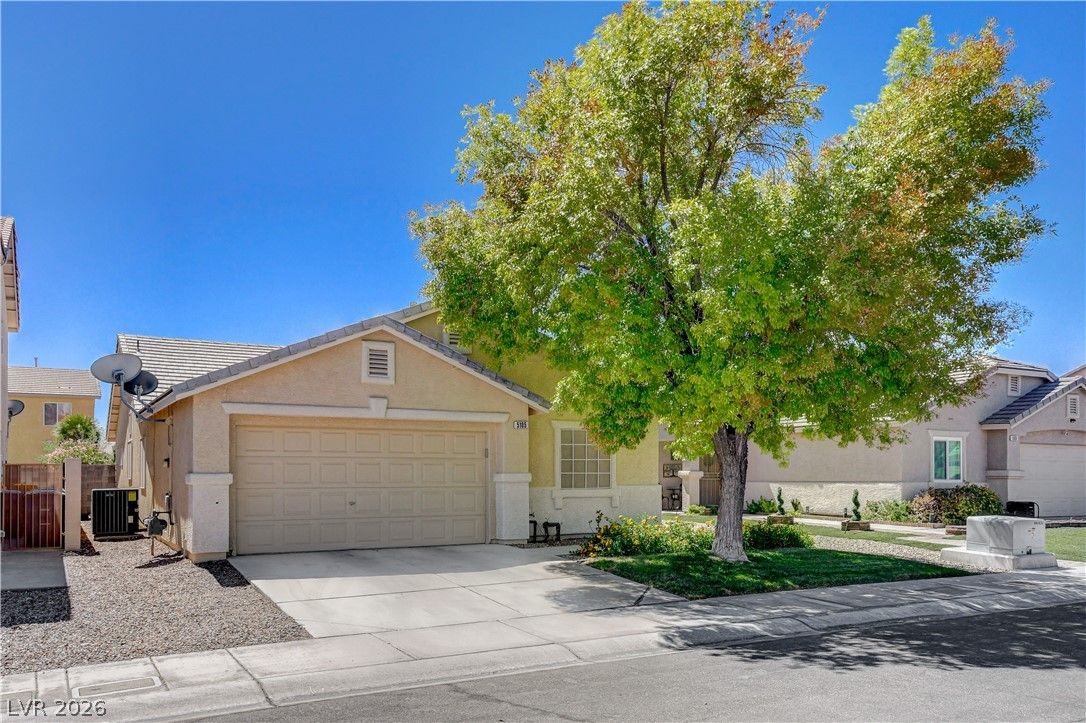
5105 Mantua CourtActive
$400,0003 bd2 ba1,593 sqft$251/sqft0.32 mi28 days
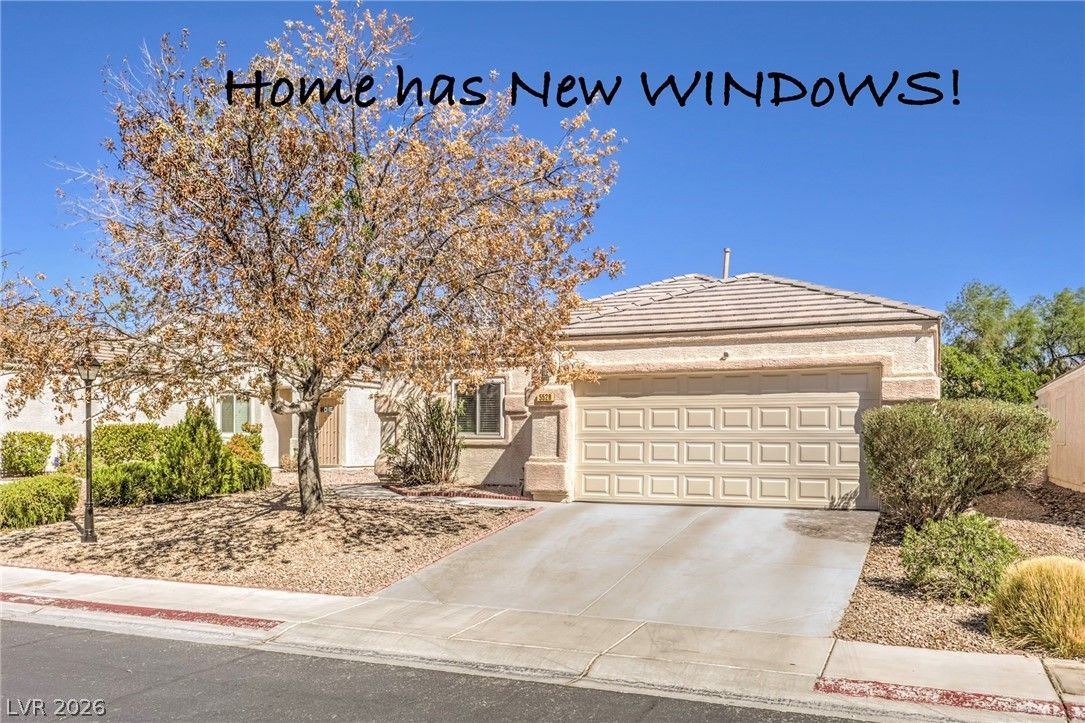
5528 Raven Creek AvenueUnder Contract
$425,0004 bd2 ba1,585 sqft$268/sqft0.42 mi24 days
$414,0004 bd2 ba1,585 sqft$261/sqft0.42 mi4 daysSold 2026-05-05
$381,0003 bd2 ba1,410 sqft$270/sqft0.48 mi117 daysSold 2026-05-11
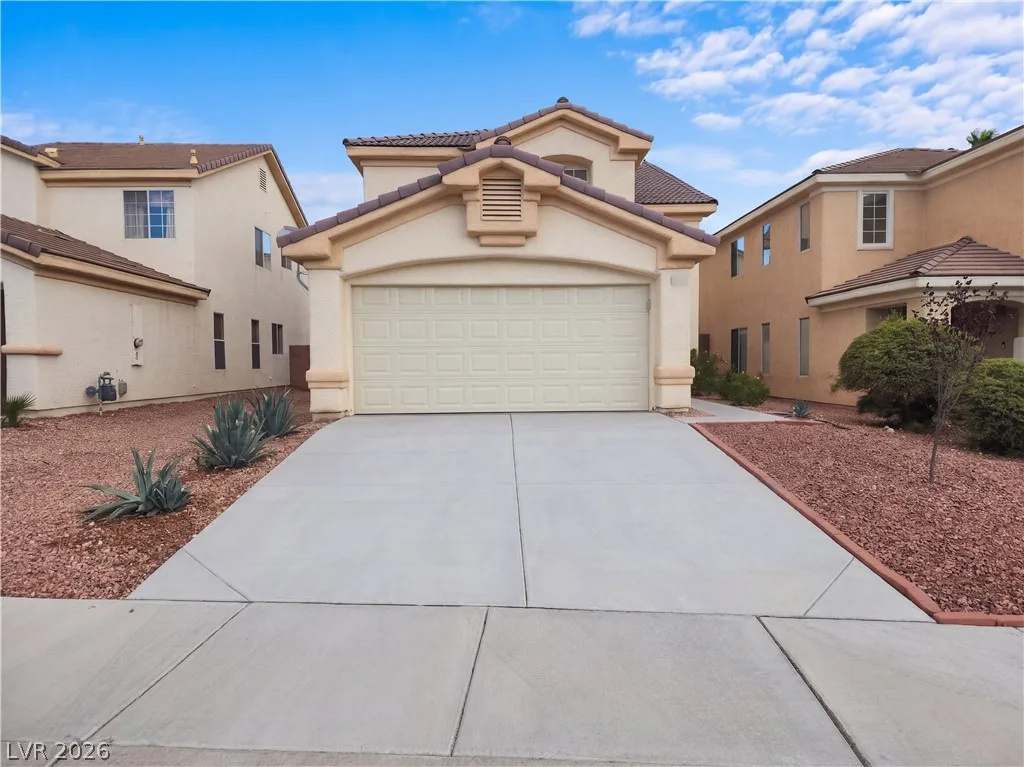
$397,0003 bd3 ba1,639 sqft$242/sqft0.50 mi5 days
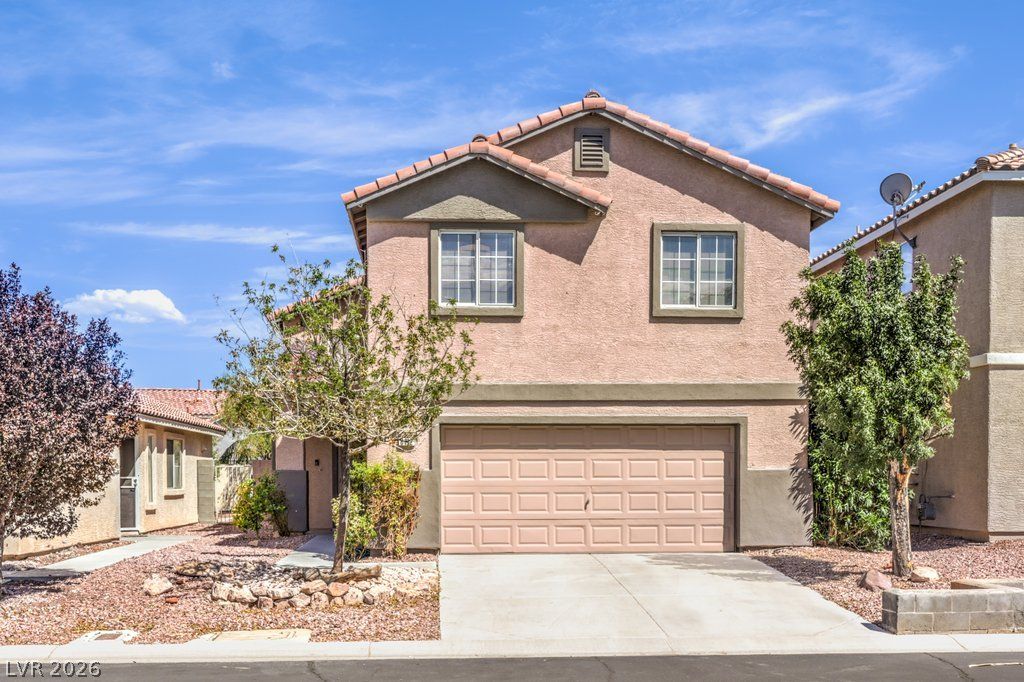
$379,9903 bd3 ba1,437 sqft$264/sqft0.50 mi44 days
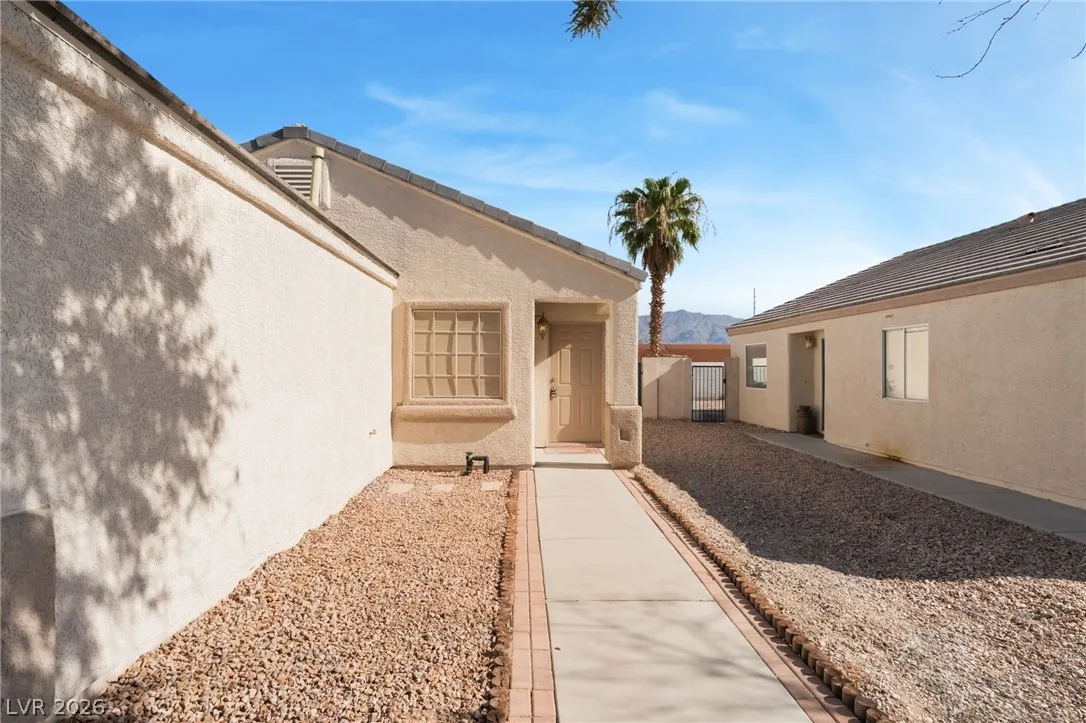
5424 Eagle Claw AvenueActive
$380,0003 bd2 ba1,135 sqft$335/sqft0.51 mi1 days
Nearest comparable sales and listings
12 comparables · median price $398,250 · range $379,990 – $425,000 · median $/sq ft $258 · average $/sq ft $269
| Address | Status | Price | $/Sq Ft | Bd / Ba | Sq Ft | Sold / market time | Distance |
|---|---|---|---|---|---|---|---|
| 5429 Bridgehampton Avenue | Active | $380,000 | $335 | 3 / 2 | 1,135 | 1 days on market | 0.01 mi |
| 5921 Mount Auburn Street | Active | $399,900 | $252 | 4 / 2 | 1,585 | 0 days on market | 0.08 mi |
| 5412 WELLS CATHEDRAL Avenue | Active | $425,000 | $254 | 3 / 3 | 1,674 | 9 days on market | 0.23 mi |
| 5105 Mantua Court | Active | $400,000 | $251 | 3 / 2 | 1,593 | 28 days on market | 0.32 mi |
| 5528 Raven Creek Avenue | Under Contract | $425,000 | $268 | 4 / 2 | 1,585 | 24 days on market | 0.42 mi |
| 5520 Raven Creek Avenue | Sold | $414,000 | $261 | 4 / 2 | 1,585 | Sold 2026-05-05 | 0.42 mi |
| 6216 Autumn Creek Drive | Sold | $381,000 | $270 | 3 / 2 | 1,410 | Sold 2026-05-11 | 0.48 mi |
| 5040 Dancing Lights Avenue | Active | $397,000 | $242 | 3 / 3 | 1,639 | 5 days on market | 0.50 mi |
| 6112 Shallow Springs Street | Active | $379,990 | $264 | 3 / 3 | 1,437 | 44 days on market | 0.50 mi |
| 5424 Eagle Claw Avenue | Active | $380,000 | $335 | 3 / 2 | 1,135 | 1 days on market | 0.51 mi |
| 4921 Sparkling Sky Avenue | Sold | $392,500 | $239 | 3 / 3 | 1,639 | Sold 2026-07-14 | 0.51 mi |
| 5460 Beach Pine Street | Under Contract | $399,500 | $251 | 3 / 2 | 1,592 | 169 days on market | 0.58 mi |


