
Comparable Sales Near 5135 Zapata Lane, North Las Vegas, NV 89031
1st Realty · Comparable sales report · 1st.estate · October 20, 2026
Read the North Las Vegas area guide →
5135 Zapata Lane, North Las Vegas, NV 89031
Status: Sold
$399,000 Sold Price
$239
$ / Sq Ft
1,668
Living Area
5,663 sqft
Lot Size
4
Beds
3
Baths
1993
Year Built
Search Parameters
Property Type
Status
Radius
Sold Within
Beds
Baths
Living Area (Sq Ft)
Lot Size (Sq Ft)
This comp search reflects your current search parameters — adjust the filters above as needed for a more accurate estimate.
Estimated Value
—
Average $/Sqft
—
Check one or more comps below to calculate an estimate.
Nearest 10 of 74 comparable sales and listings within 1 mile of this home. Use the filters above and press Search to refine.
$370,0003 bd2 ba1,304 sqft$284/sqft0.10 mi38 daysSold 2026-06-18
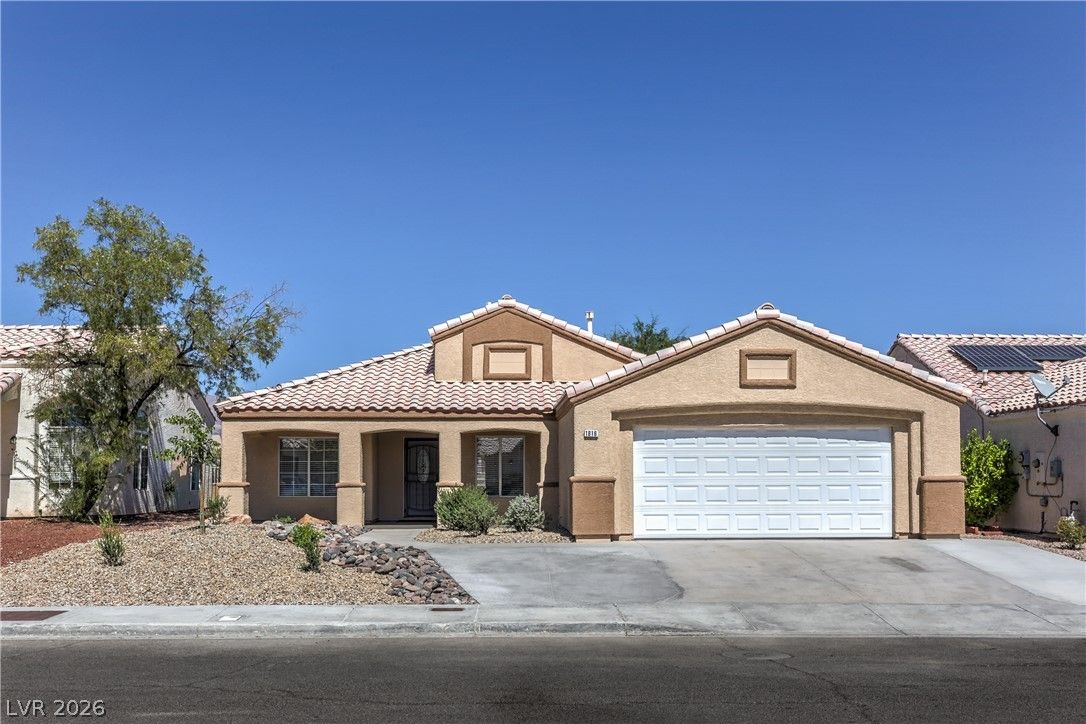
1816 Panther PlaceActive
$399,9003 bd2 ba1,467 sqft$273/sqft0.13 mi18 days
1925 Curio DriveSold
$445,0003 bd3 ba1,755 sqft$254/sqft0.16 mi35 daysSold 2026-05-22
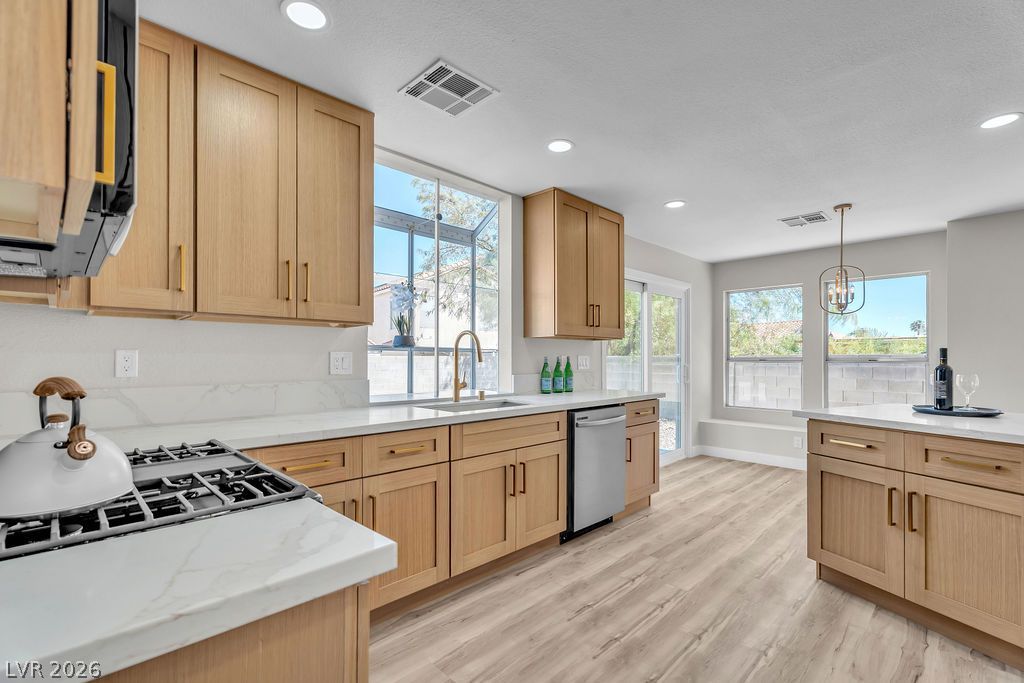
1914 Pintura CircleActive
$439,5003 bd3 ba1,850 sqft$238/sqft0.18 mi11 days
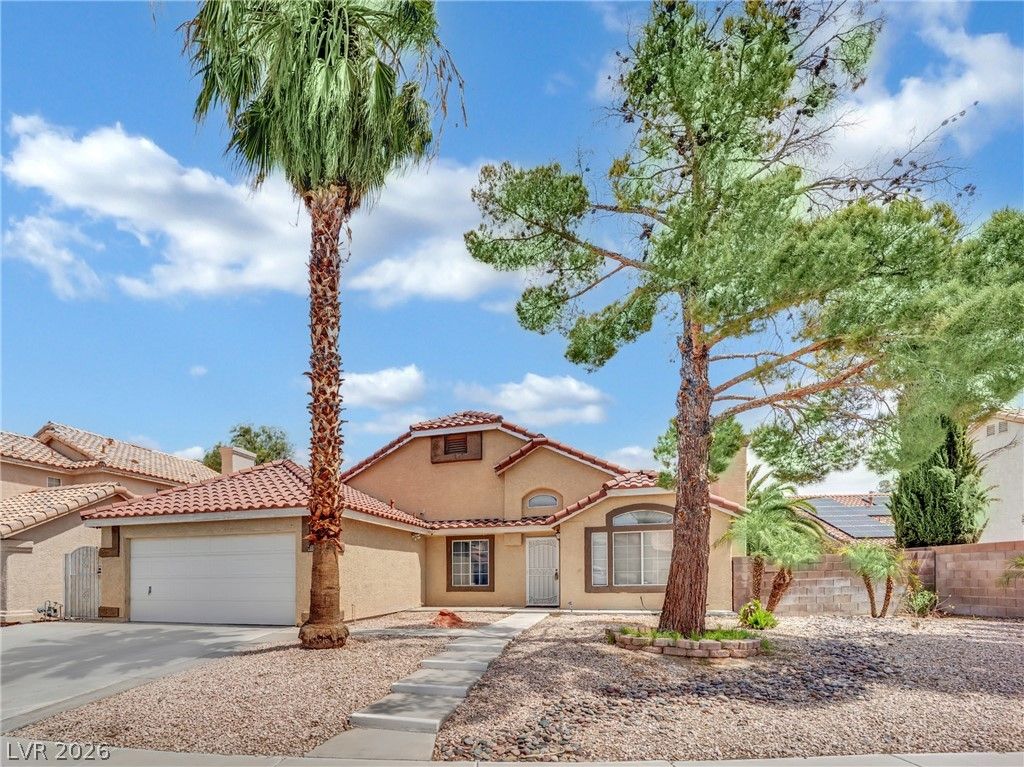
5132 El Nino LaneActive
$410,0003 bd2 ba1,458 sqft$281/sqft0.23 mi20 days
$500,0004 bd3 ba2,023 sqft$247/sqft0.24 mi67 daysSold 2026-06-30
$455,0004 bd2 ba1,719 sqft$265/sqft0.26 mi18 daysSold 2026-06-03
$395,0004 bd2 ba1,560 sqft$253/sqft0.26 mi3 daysSold 2026-06-25
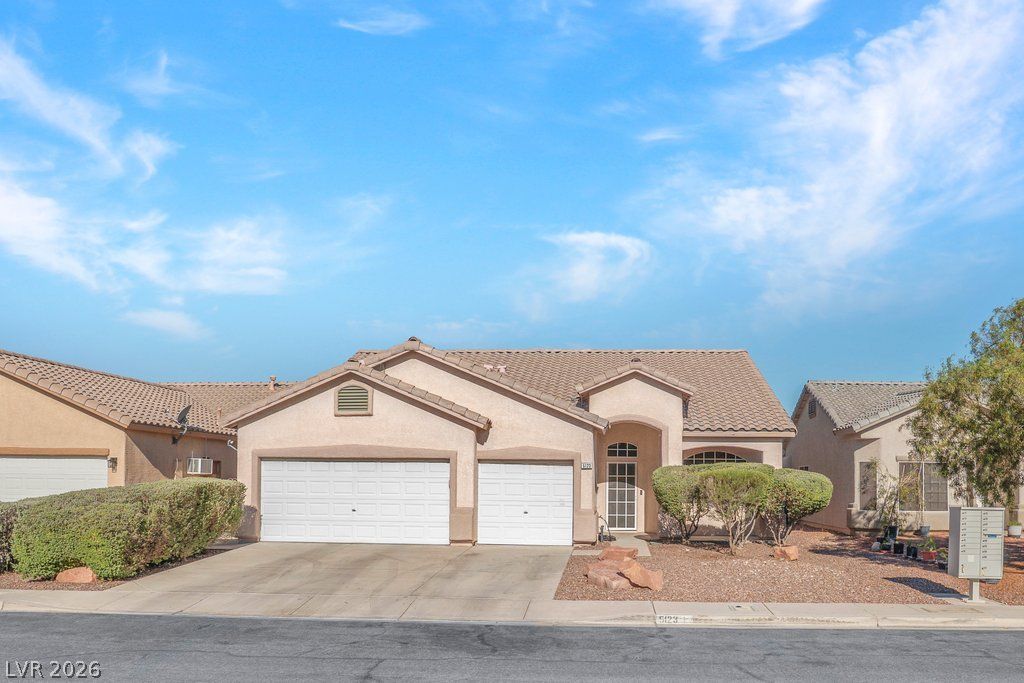
$410,0003 bd2 ba1,776 sqft$231/sqft0.27 mi25 daysSold 2026-07-31
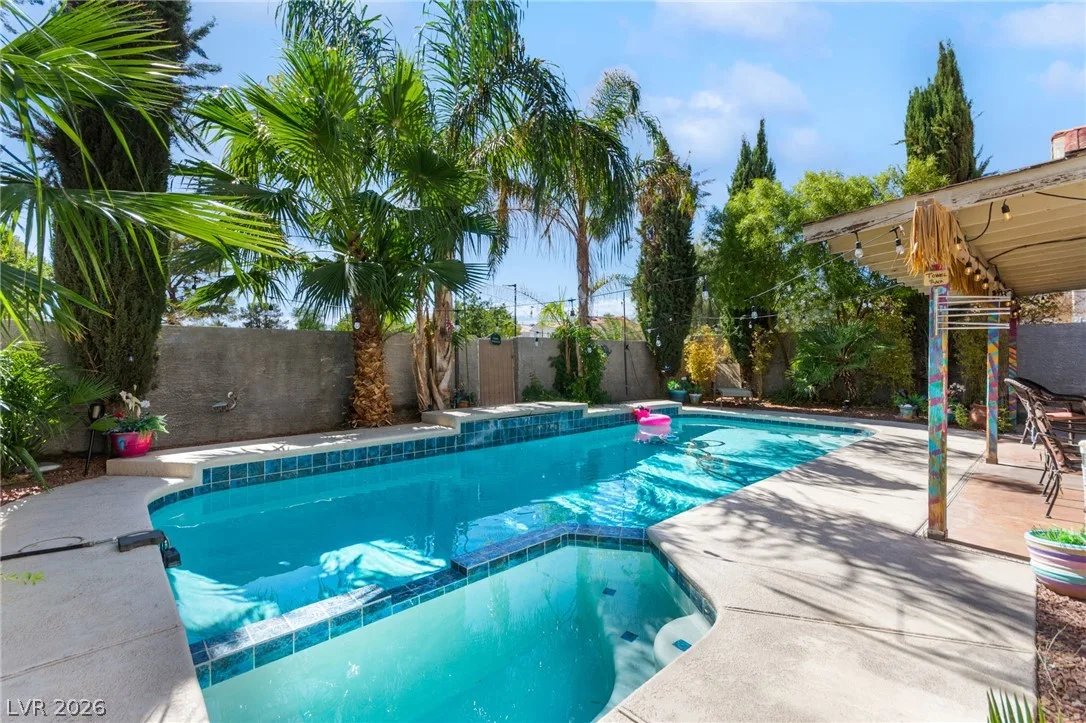
1731 Monte Alban DriveUnder Contract
$399,9003 bd3 ba1,599 sqft$250/sqft0.29 mi4 days
Nearest comparable sales and listings
12 comparables · median price $409,500 · range $370,000 – $500,000 · median $/sq ft $253 · average $/sq ft $258
| Address | Status | Price | $/Sq Ft | Bd / Ba | Sq Ft | Sold / market time | Distance |
|---|---|---|---|---|---|---|---|
| 5115 Palo Pinto Lane | Sold | $370,000 | $284 | 3 / 2 | 1,304 | Sold 2026-06-18 | 0.10 mi |
| 1816 Panther Place | Active | $399,900 | $273 | 3 / 2 | 1,467 | 18 days on market | 0.13 mi |
| 1925 Curio Drive | Sold | $445,000 | $254 | 3 / 3 | 1,755 | Sold 2026-05-22 | 0.16 mi |
| 1914 Pintura Circle | Active | $439,500 | $238 | 3 / 3 | 1,850 | 11 days on market | 0.18 mi |
| 5132 El Nino Lane | Active | $410,000 | $281 | 3 / 2 | 1,458 | 20 days on market | 0.23 mi |
| 1808 La Villa Drive | Sold | $500,000 | $247 | 4 / 3 | 2,023 | Sold 2026-06-30 | 0.24 mi |
| 1613 Santa Lucia Drive | Sold | $455,000 | $265 | 4 / 2 | 1,719 | Sold 2026-06-03 | 0.26 mi |
| 5326 Pine Bough Street | Sold | $395,000 | $253 | 4 / 2 | 1,560 | Sold 2026-06-25 | 0.26 mi |
| 5123 Fiji Island Court | Sold | $410,000 | $231 | 3 / 2 | 1,776 | Sold 2026-07-31 | 0.27 mi |
| 1731 Monte Alban Drive | Under Contract | $399,900 | $250 | 3 / 3 | 1,599 | 4 days on market | 0.29 mi |
| 2112 Panther Place | Under Contract | $409,000 | $275 | 3 / 2 | 1,486 | 11 days on market | 0.29 mi |
| 2016 Marathon Keys Avenue | Sold | $400,000 | $251 | 3 / 2 | 1,596 | Sold 2026-04-30 | 0.29 mi |


