
Comparable Sales Near 7293 Saxby Avenue, Las Vegas, NV 89113
1st Realty · Comparable sales report · 1st.estate · October 21, 2026
Read the Enterprise neighborhood guide →
7293 Saxby Avenue, Las Vegas, NV 89113
Status: Sold
$2,350 Sold Price
$1
$ / Sq Ft
2,118
Living Area
3,485 sqft
Lot Size
4
Beds
3
Baths
2023
Year Built
Search Parameters
Property Type
Status
Radius
Sold Within
Beds
Baths
Living Area (Sq Ft)
Lot Size (Sq Ft)
This comp search reflects your current search parameters — adjust the filters above as needed for a more accurate estimate.
Estimated Value
—
Average $/Sqft
—
Check one or more comps below to calculate an estimate.
Nearest 10 of 27 comparable sales and listings within 1 mile of this home. Use the filters above and press Search to refine.
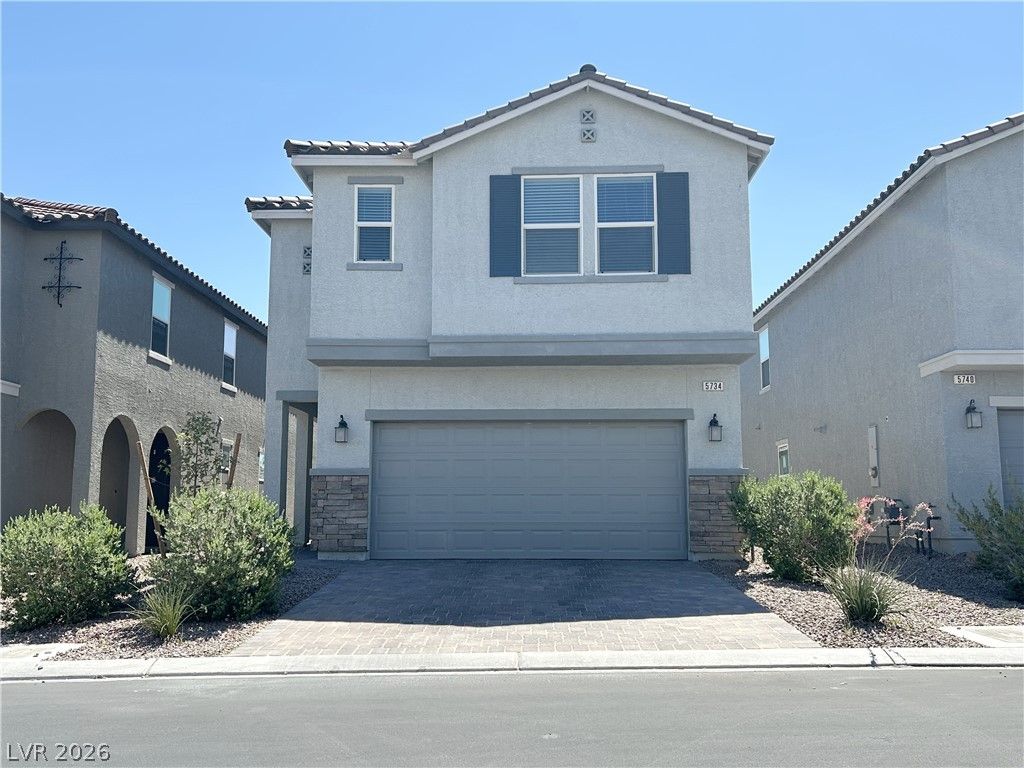
$490,0005 bd3 ba2,481 sqft$198/sqft0.04 mi69 daysSold 2026-08-26

7301 Teagan AvenueActive
$525,0004 bd3 ba2,118 sqft$248/sqft0.05 mi1 days
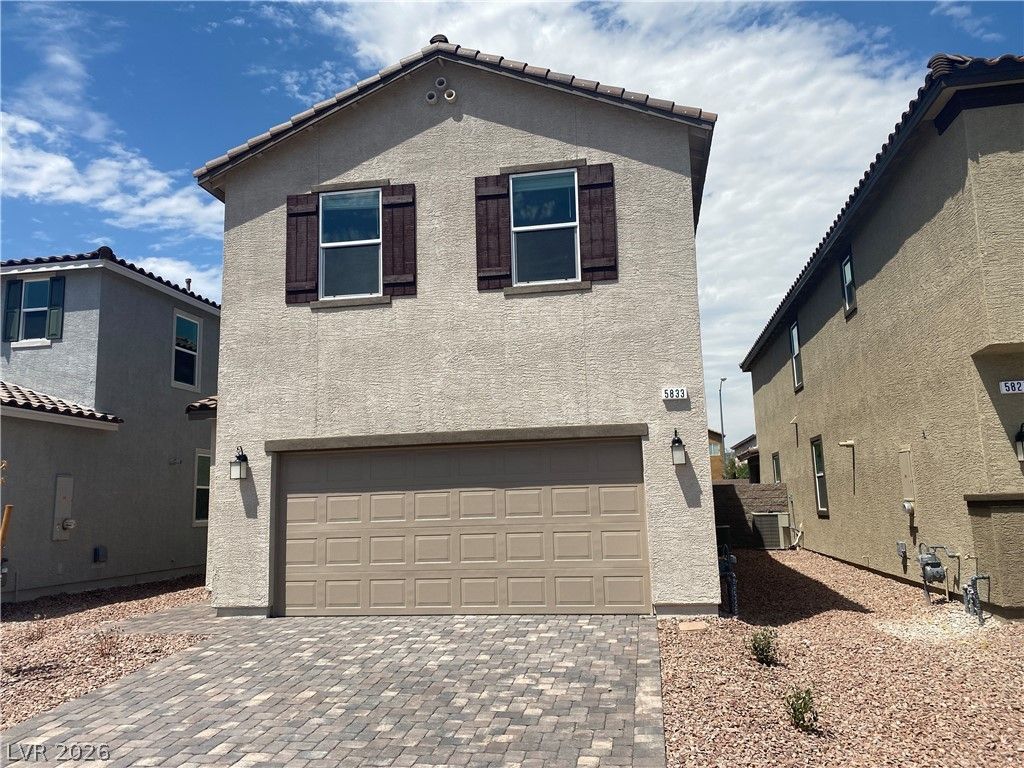
5833 Holbeche StreetActive
$485,0003 bd3 ba1,749 sqft$277/sqft0.14 mi0 days
$525,0004 bd3 ba2,118 sqft$248/sqft0.14 mi50 daysSold 2026-05-15
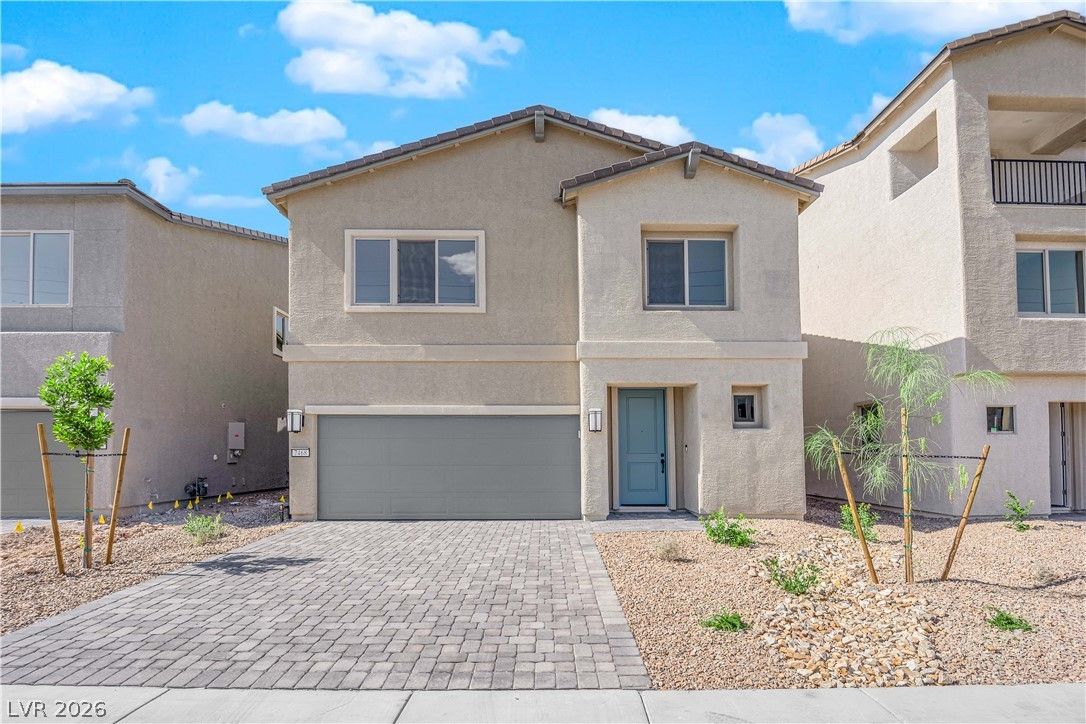
7468 Delemont AvenueActive
$538,0003 bd3 ba2,034 sqft$265/sqft0.23 mi81 days

7081 Baza AvenueActive
$469,9904 bd3 ba2,118 sqft$222/sqft0.25 mi48 days
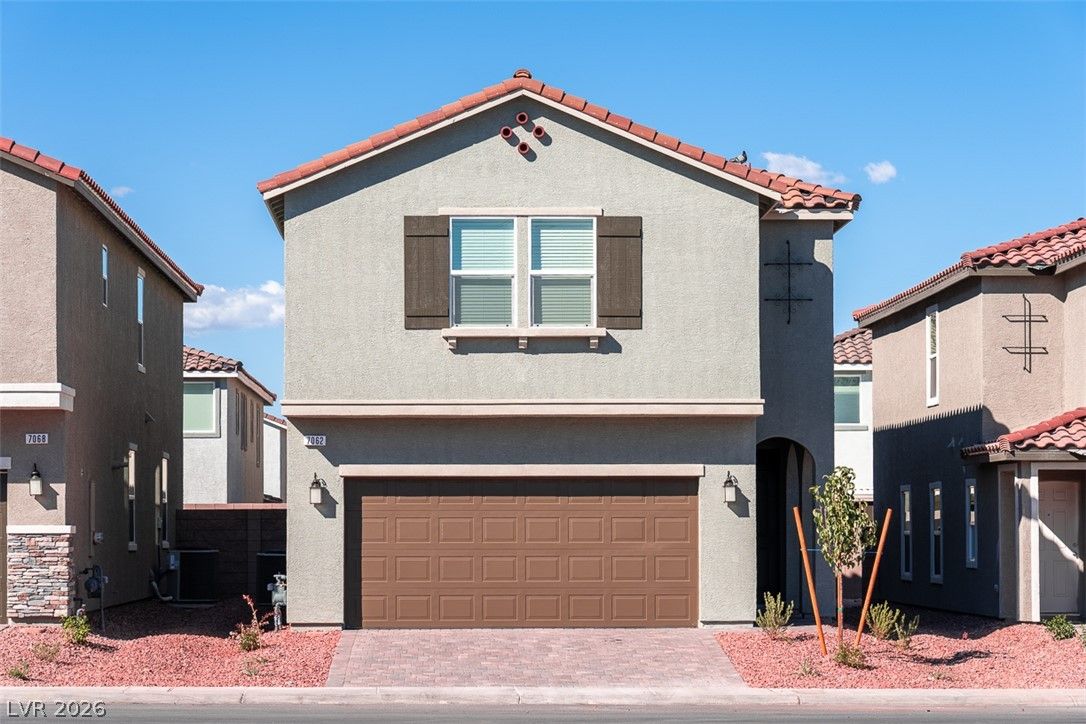
7062 Cass AvenueActive
$539,0005 bd4 ba2,466 sqft$219/sqft0.26 mi80 days
$376,0003 bd3 ba1,704 sqft$221/sqft0.28 mi685 daysSold 2026-06-15
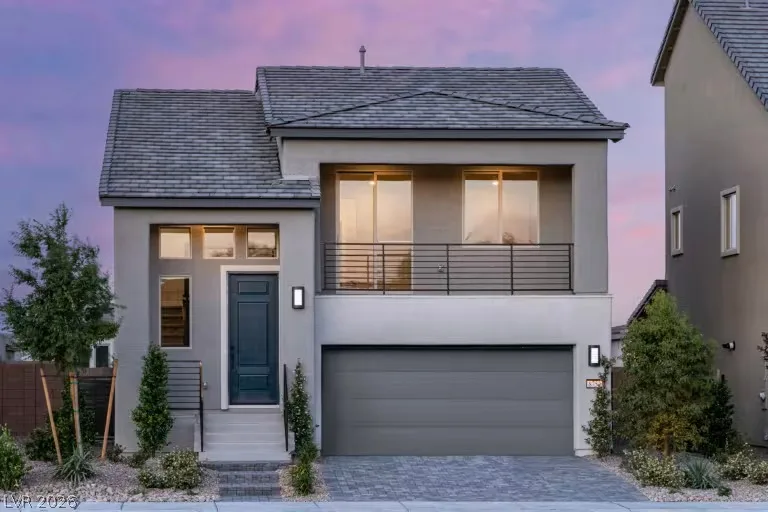
7529 Bay Leaf AvenueActive
$530,0003 bd3 ba2,043 sqft$259/sqft0.31 mi8 days
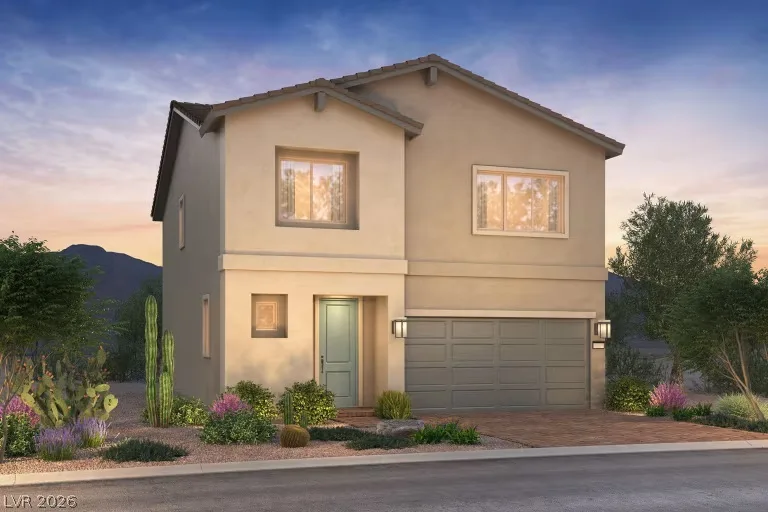
7535 Bay Leaf AvenueActive
$540,0003 bd3 ba2,034 sqft$265/sqft0.32 mi0 days
Nearest comparable sales and listings
12 comparables · median price $525,000 · range $376,000 – $540,000 · median $/sq ft $248 · average $/sq ft $245
| Address | Status | Price | $/Sq Ft | Bd / Ba | Sq Ft | Sold / market time | Distance |
|---|---|---|---|---|---|---|---|
| 5734 Prima Street | Sold | $490,000 | $198 | 5 / 3 | 2,481 | Sold 2026-08-26 | 0.04 mi |
| 7301 Teagan Avenue | Active | $525,000 | $248 | 4 / 3 | 2,118 | 1 days on market | 0.05 mi |
| 5833 Holbeche Street | Active | $485,000 | $277 | 3 / 3 | 1,749 | 0 days on market | 0.14 mi |
| 5839 Holbeche Street | Sold | $525,000 | $248 | 4 / 3 | 2,118 | Sold 2026-05-15 | 0.14 mi |
| 7468 Delemont Avenue | Active | $538,000 | $265 | 3 / 3 | 2,034 | 81 days on market | 0.23 mi |
| 7081 Baza Avenue | Active | $469,990 | $222 | 4 / 3 | 2,118 | 48 days on market | 0.25 mi |
| 7062 Cass Avenue | Active | $539,000 | $219 | 5 / 4 | 2,466 | 80 days on market | 0.26 mi |
| 5790 Native Dancer Court | Sold | $376,000 | $221 | 3 / 3 | 1,704 | Sold 2026-06-15 | 0.28 mi |
| 7529 Bay Leaf Avenue | Active | $530,000 | $259 | 3 / 3 | 2,043 | 8 days on market | 0.31 mi |
| 7535 Bay Leaf Avenue | Active | $540,000 | $265 | 3 / 3 | 2,034 | 0 days on market | 0.32 mi |
| 5890 Steinbeck Valley Street | Sold | $535,000 | $311 | 3 / 2 | 1,720 | Sold 2026-05-26 | 0.40 mi |
| 7312 West MESA VISTA Avenue | Sold | $510,000 | $206 | 5 / 3 | 2,478 | Sold 2026-05-28 | 0.43 mi |


