
Comparable Sales Near 7813 Waterfalls Avenue, Las Vegas, NV 89128
1st Realty · Comparable sales report · 1st.estate · October 20, 2026
Browse our Las Vegas area guides →
7813 Waterfalls Avenue, Las Vegas, NV 89128
Status: Sold
$685,000 Sold Price
$247
$ / Sq Ft
2,774
Living Area
10,019 sqft
Lot Size
4
Beds
4
Baths
1990
Year Built
Search Parameters
Property Type
Status
Radius
Sold Within
Beds
Baths
Living Area (Sq Ft)
Lot Size (Sq Ft)
This comp search reflects your current search parameters — adjust the filters above as needed for a more accurate estimate.
Estimated Value
—
Average $/Sqft
—
Check one or more comps below to calculate an estimate.
Nearest 10 of 24 comparable sales and listings within 1 mile of this home. Use the filters above and press Search to refine.
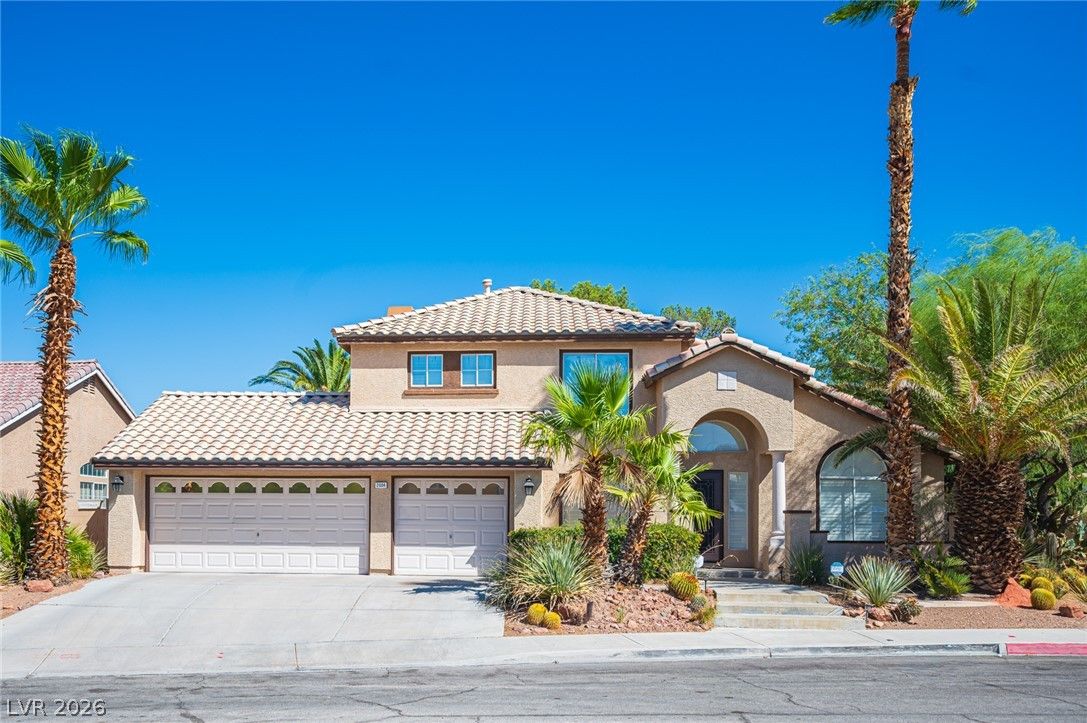
2004 Lady Lake StreetActive
$640,0004 bd5 ba3,250 sqft$197/sqft0.10 mi18 days
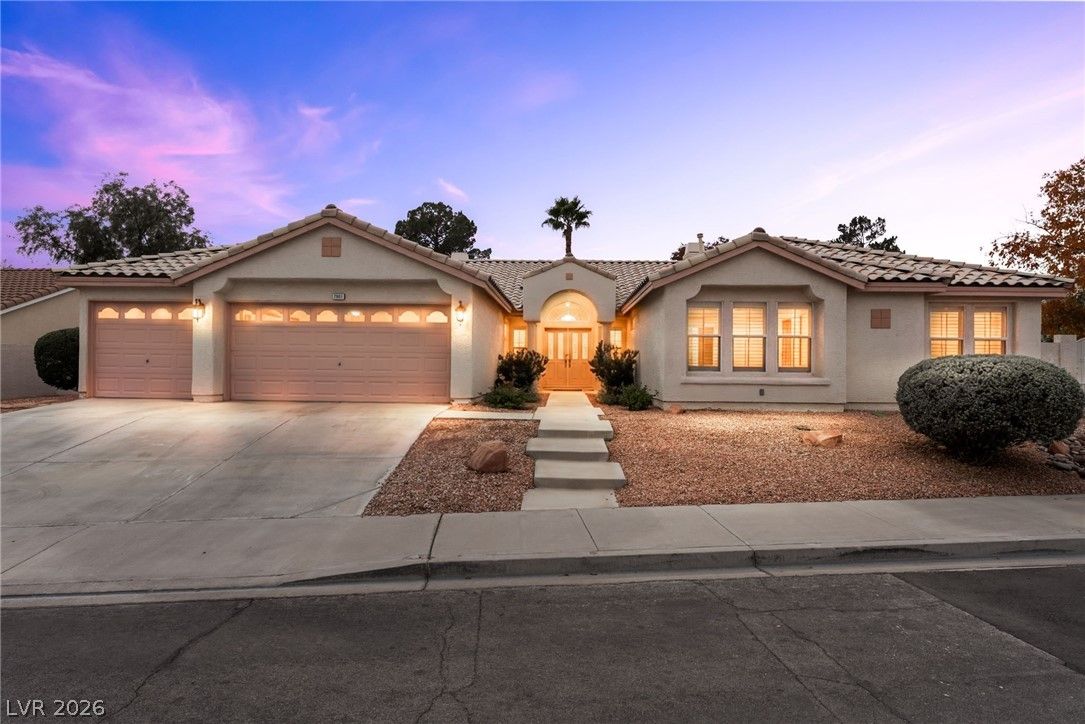
$650,0004 bd4 ba2,775 sqft$234/sqft0.10 mi74 daysSold 2026-07-27

2117 White Falls StreetUnder Contract
$624,9904 bd3 ba2,347 sqft$266/sqft0.18 mi47 days

2000 White FallsActive
$685,0004 bd5 ba3,250 sqft$211/sqft0.20 mi63 days
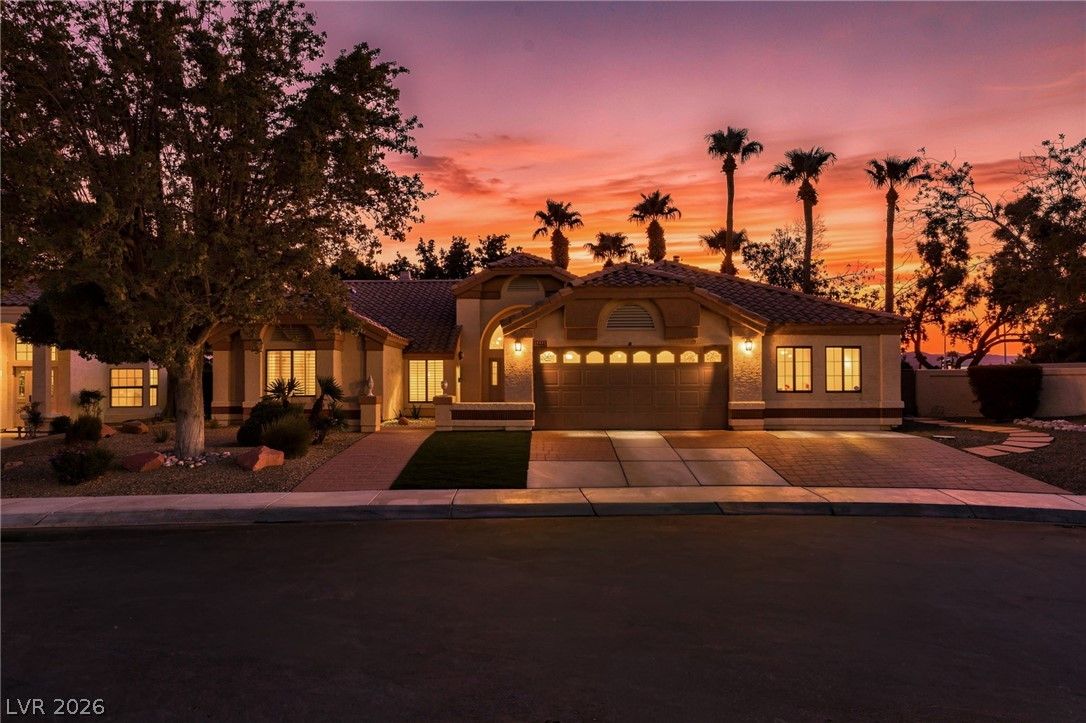
2433 Chatfield DrivePending
$634,9994 bd3 ba2,638 sqft$241/sqft0.35 mi32 days
$515,0004 bd3 ba2,347 sqft$219/sqft0.35 mi110 daysSold 2026-07-23
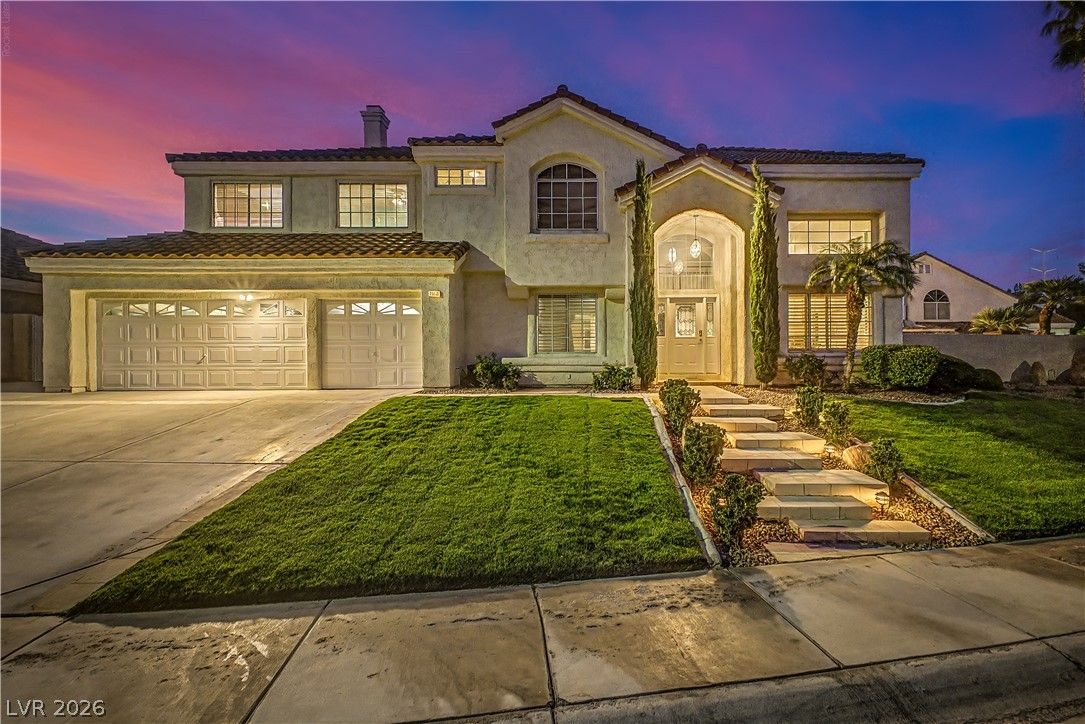
$530,0004 bd3 ba3,339 sqft$159/sqft0.52 mi0 daysSold 2026-08-21
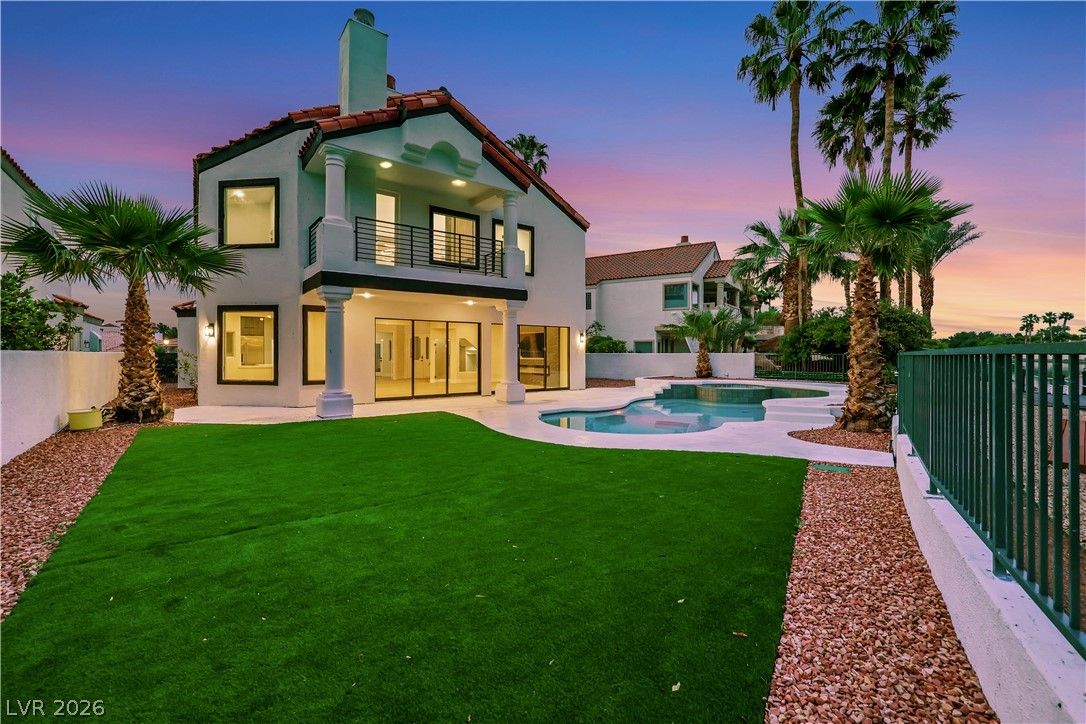
$1,325,0004 bd4 ba3,336 sqft$397/sqft0.64 mi82 daysSold 2026-10-08
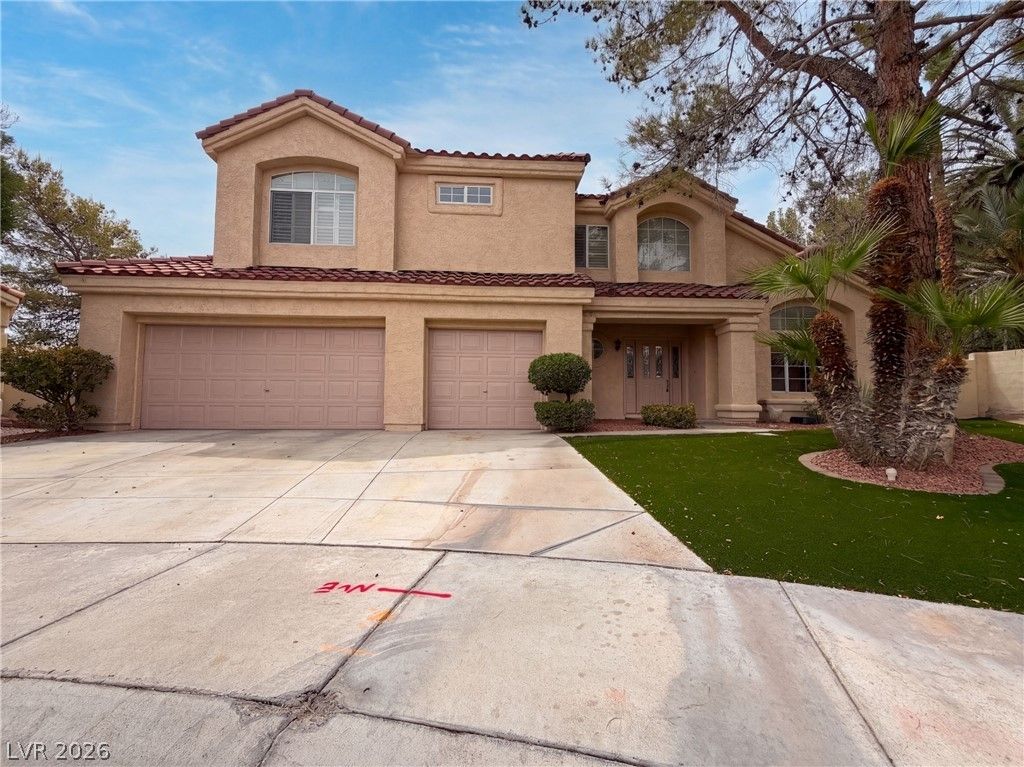
2624 Ohio CourtPending
$618,0004 bd3 ba2,491 sqft$248/sqft0.65 mi43 days

2305 Bear Valley StreetUnder Contract
$599,0003 bd3 ba2,478 sqft$242/sqft0.67 mi40 days
Nearest comparable sales and listings
12 comparables · median price $637,500 · range $515,000 – $1,325,000 · median $/sq ft $241 · average $/sq ft $249
| Address | Status | Price | $/Sq Ft | Bd / Ba | Sq Ft | Sold / market time | Distance |
|---|---|---|---|---|---|---|---|
| 2004 Lady Lake Street | Active | $640,000 | $197 | 4 / 5 | 3,250 | 18 days on market | 0.10 mi |
| 7901 Magnolia Glen Avenue | Sold | $650,000 | $234 | 4 / 4 | 2,775 | Sold 2026-07-27 | 0.10 mi |
| 2117 White Falls Street | Under Contract | $624,990 | $266 | 4 / 3 | 2,347 | 47 days on market | 0.18 mi |
| 2000 White Falls | Active | $685,000 | $211 | 4 / 5 | 3,250 | 63 days on market | 0.20 mi |
| 2433 Chatfield Drive | Pending | $634,999 | $241 | 4 / 3 | 2,638 | 32 days on market | 0.35 mi |
| 8113 Tropic Isle Circle | Sold | $515,000 | $219 | 4 / 3 | 2,347 | Sold 2026-07-23 | 0.35 mi |
| 7612 Belmondo Lane | Sold | $530,000 | $159 | 4 / 3 | 3,339 | Sold 2026-08-21 | 0.52 mi |
| 2589 Sun Reef Road | Sold | $1,325,000 | $397 | 4 / 4 | 3,336 | Sold 2026-10-08 | 0.64 mi |
| 2624 Ohio Court | Pending | $618,000 | $248 | 4 / 3 | 2,491 | 43 days on market | 0.65 mi |
| 2305 Bear Valley Street | Under Contract | $599,000 | $242 | 3 / 3 | 2,478 | 40 days on market | 0.67 mi |
| 8320 Paseo Vista Drive | Sold | $850,000 | $256 | 4 / 4 | 3,322 | Sold 2026-08-31 | 0.75 mi |
| 8125 Tiara Cove Circle | Active | $899,000 | $322 | 4 / 4 | 2,790 | 5 days on market | 0.76 mi |


