
Comparable Sales Near 428 Anchor Street, Las Vegas, NV 89110
1st Realty · Comparable sales report · 1st.estate · October 20, 2026
Browse our Las Vegas area guides →
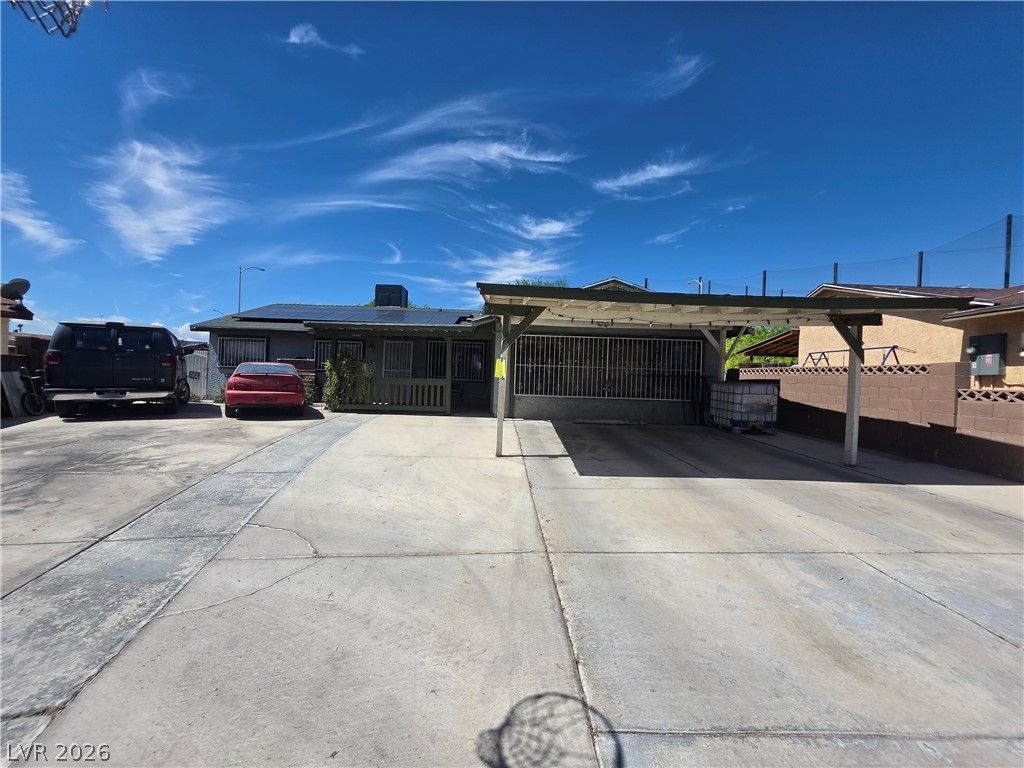
428 Anchor Street, Las Vegas, NV 89110
Status: Sold
$220,000 Sold Price
$172
$ / Sq Ft
1,278
Living Area
6,534 sqft
Lot Size
4
Beds
2
Baths
1973
Year Built
Search Parameters
Property Type
Status
Radius
Sold Within
Beds
Baths
Living Area (Sq Ft)
Lot Size (Sq Ft)
This comp search reflects your current search parameters — adjust the filters above as needed for a more accurate estimate.
Estimated Value
—
Average $/Sqft
—
Check one or more comps below to calculate an estimate.
Nearest 10 of 33 comparable sales and listings within 1 mile of this home. Use the filters above and press Search to refine.

3908 Montebello AvenueActive
$419,9003 bd2 ba1,184 sqft$355/sqft0.04 mi0 days
$375,0003 bd2 ba1,278 sqft$293/sqft0.16 mi109 daysSold 2026-05-12

$365,0003 bd2 ba1,119 sqft$326/sqft0.23 mi5 daysSold 2026-10-09
$385,0004 bd2 ba1,272 sqft$303/sqft0.24 mi8 daysSold 2026-05-12
$355,0004 bd2 ba1,272 sqft$279/sqft0.28 mi108 daysSold 2026-04-29
$349,9993 bd2 ba1,000 sqft$350/sqft0.29 mi83 daysSold 2026-05-27
500 Kuilima RoadActive
$359,0004 bd3 ba1,542 sqft$233/sqft0.30 mi0 days
$420,0004 bd2 ba1,289 sqft$326/sqft0.44 mi8 daysSold 2026-04-24

4102 East Ogden AvenueUnder Contract
$278,8883 bd2 ba1,168 sqft$239/sqft0.48 mi11 days
$348,0003 bd2 ba1,204 sqft$289/sqft0.49 mi8 daysSold 2026-05-22
Nearest comparable sales and listings
12 comparables · median price $362,000 · range $278,888 – $420,000 · median $/sq ft $298 · average $/sq ft $293
| Address | Status | Price | $/Sq Ft | Bd / Ba | Sq Ft | Sold / market time | Distance |
|---|---|---|---|---|---|---|---|
| 3908 Montebello Avenue | Active | $419,900 | $355 | 3 / 2 | 1,184 | 0 days on market | 0.04 mi |
| 3905 Centura Avenue | Sold | $375,000 | $293 | 3 / 2 | 1,278 | Sold 2026-05-12 | 0.16 mi |
| 409 Lehman Street | Sold | $365,000 | $326 | 3 / 2 | 1,119 | Sold 2026-10-09 | 0.23 mi |
| 329 Lehman Street | Sold | $385,000 | $303 | 4 / 2 | 1,272 | Sold 2026-05-12 | 0.24 mi |
| 4013 Alameda Avenue | Sold | $355,000 | $279 | 4 / 2 | 1,272 | Sold 2026-04-29 | 0.28 mi |
| 3978 Saguaro Lane | Sold | $349,999 | $350 | 3 / 2 | 1,000 | Sold 2026-05-27 | 0.29 mi |
| 500 Kuilima Road | Active | $359,000 | $233 | 4 / 3 | 1,542 | 0 days on market | 0.30 mi |
| 3979 Midas Street | Sold | $420,000 | $326 | 4 / 2 | 1,289 | Sold 2026-04-24 | 0.44 mi |
| 4102 East Ogden Avenue | Under Contract | $278,888 | $239 | 3 / 2 | 1,168 | 11 days on market | 0.48 mi |
| 3709 Sunrise Avenue | Sold | $348,000 | $289 | 3 / 2 | 1,204 | Sold 2026-05-22 | 0.49 mi |
| 41 Del Amo Drive | Sold | $403,000 | $317 | 4 / 2 | 1,272 | Sold 2026-05-29 | 0.62 mi |
| 34 Del Amo Drive | Sold | $295,113 | $207 | 3 / 2 | 1,424 | Sold 2026-06-02 | 0.66 mi |


