
Comparable Sales Near 8807 Tangerine Sky Avenue, Las Vegas, NV 89178
1st Realty · Comparable sales report · 1st.estate · October 20, 2026
Read the Enterprise neighborhood guide →
8807 Tangerine Sky Avenue, Las Vegas, NV 89178
Status: Sold
$680,000 Sold Price
$264
$ / Sq Ft
2,576
Living Area
7,841 sqft
Lot Size
4
Beds
3
Baths
2004
Year Built
Search Parameters
Property Type
Status
Radius
Sold Within
Beds
Baths
Living Area (Sq Ft)
Lot Size (Sq Ft)
This comp search reflects your current search parameters — adjust the filters above as needed for a more accurate estimate.
Estimated Value
—
Average $/Sqft
—
Check one or more comps below to calculate an estimate.
Nearest 10 of 35 comparable sales and listings within 1 mile of this home. Use the filters above and press Search to refine.
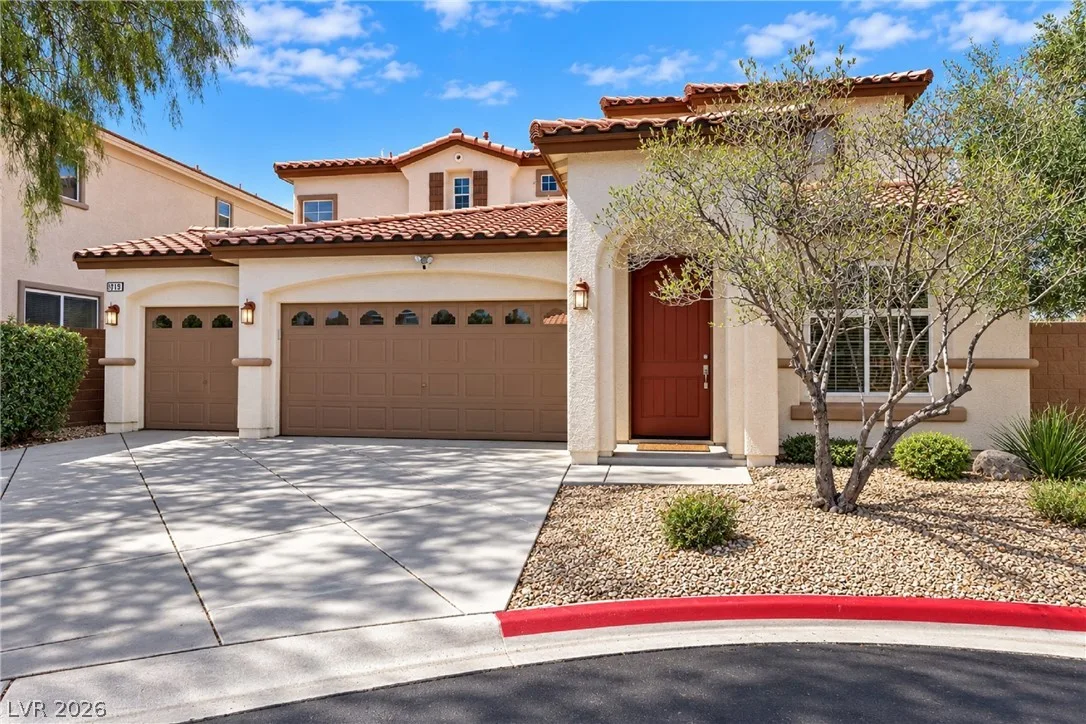
9709 Mount Lompoc CourtActive
$560,0004 bd3 ba2,572 sqft$218/sqft0.05 mi0 days
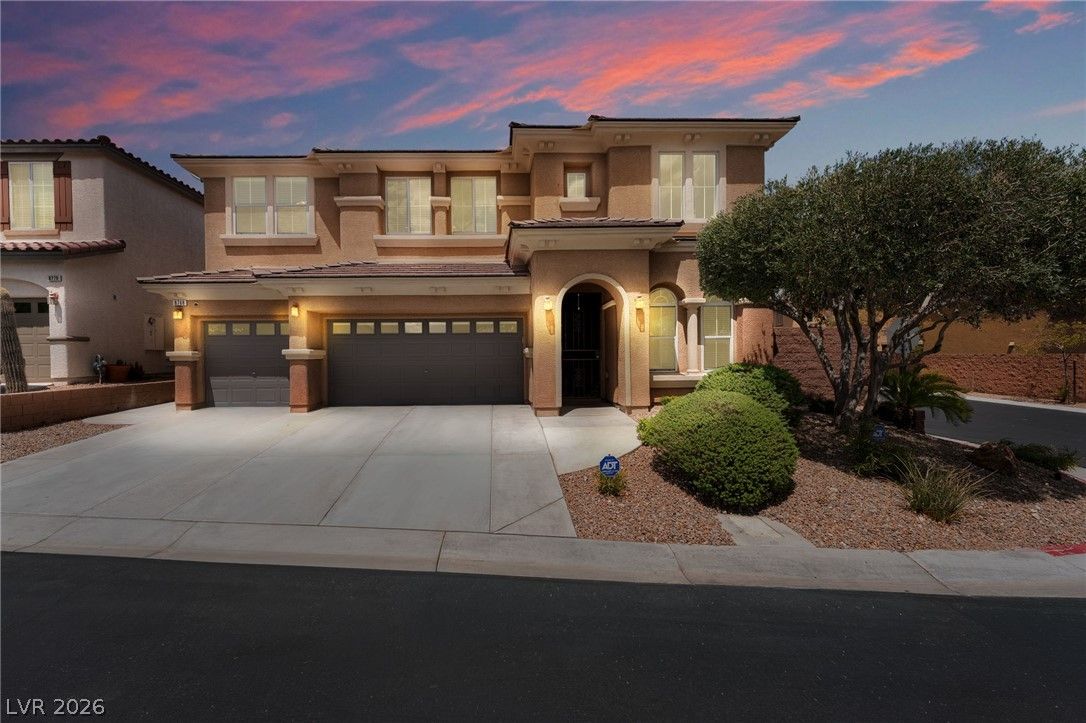
$724,8885 bd3 ba3,132 sqft$231/sqft0.14 mi34 days
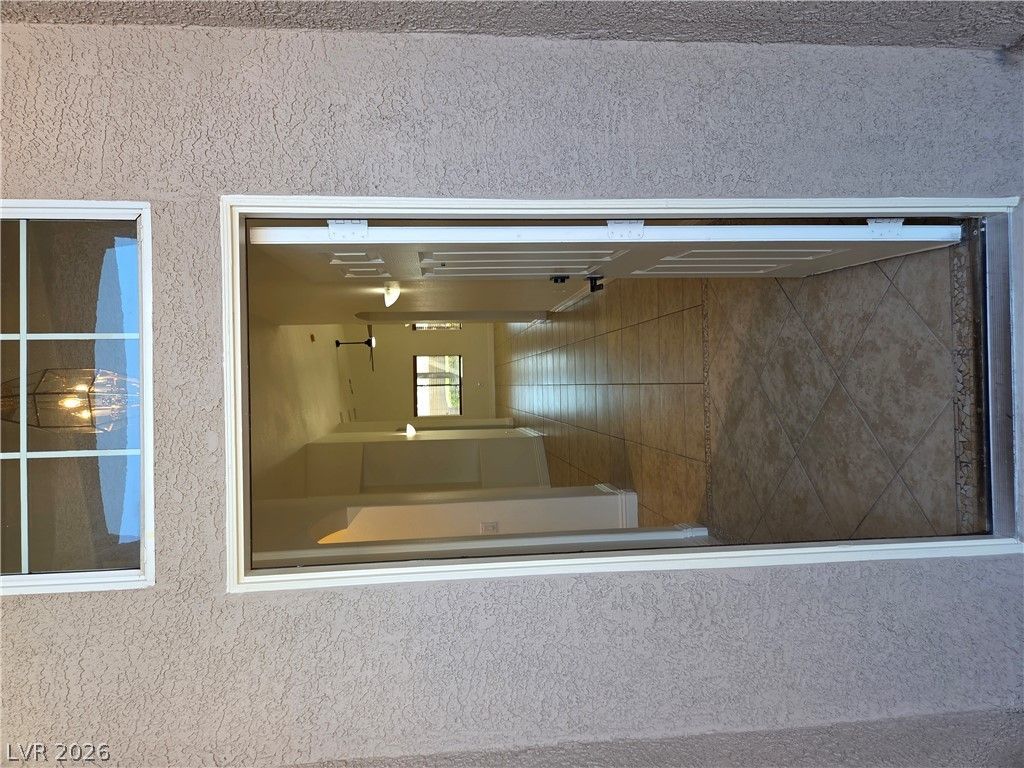
$565,0004 bd3 ba2,362 sqft$239/sqft0.16 mi14 daysSold 2026-09-30
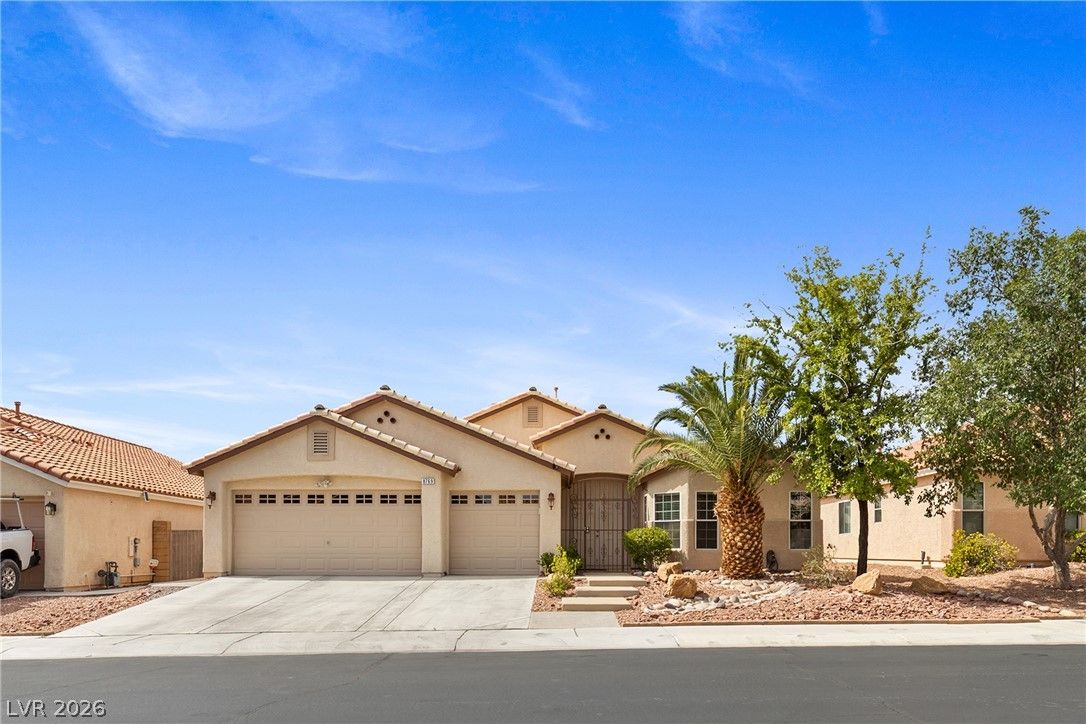
$555,0004 bd2 ba2,182 sqft$254/sqft0.17 mi35 daysSold 2026-08-11
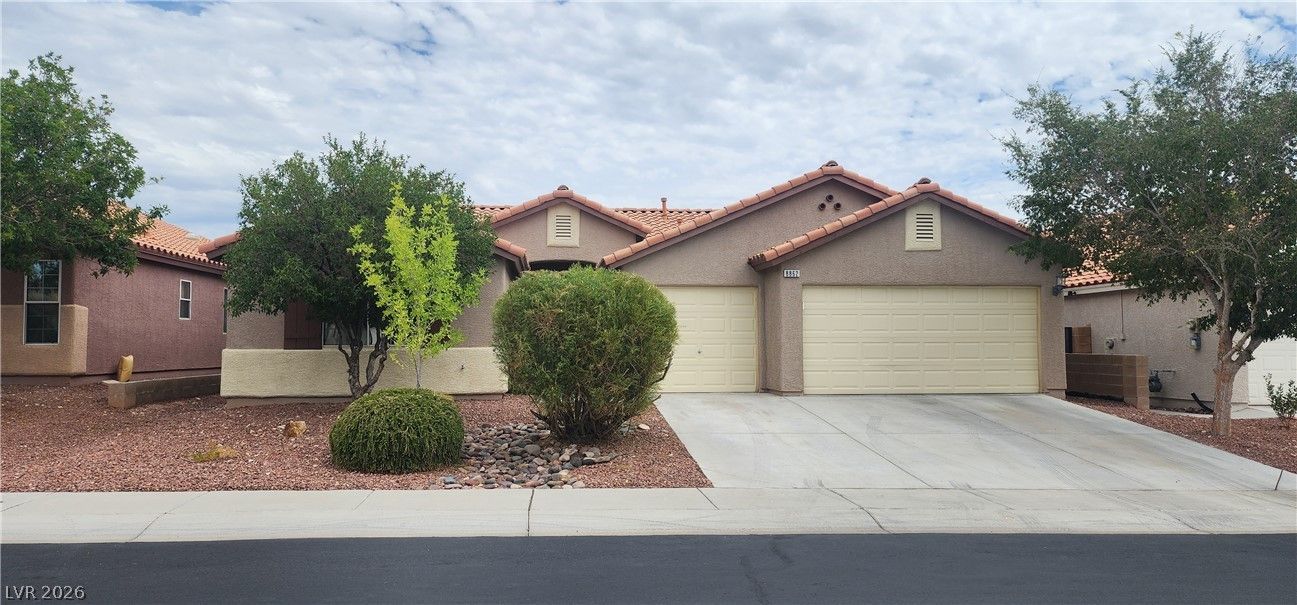
$505,0004 bd2 ba1,970 sqft$256/sqft0.18 mi26 daysSold 2026-09-04
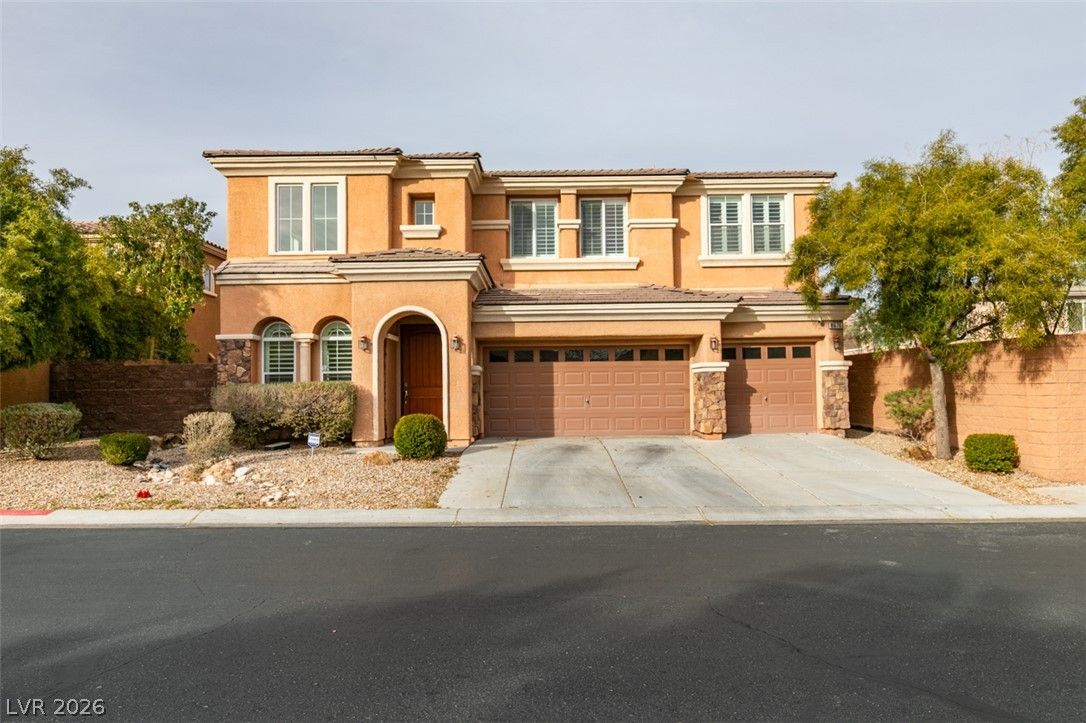
8676 Moreno Mountain AvenuePending
$585,0005 bd3 ba3,132 sqft$187/sqft0.19 mi46 days
$610,0003 bd2 ba1,984 sqft$307/sqft0.19 mi2 daysSold 2026-04-29
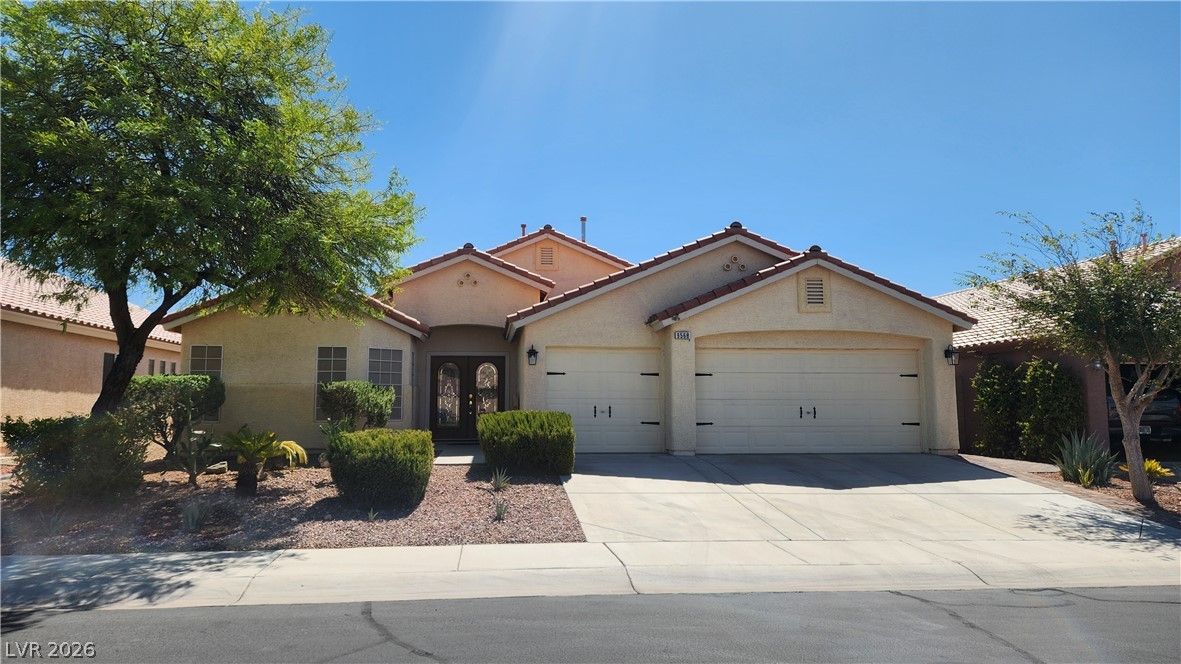
$545,0004 bd2 ba2,052 sqft$266/sqft0.20 mi2 daysSold 2026-08-31
$458,0004 bd2 ba1,984 sqft$231/sqft0.21 mi43 daysSold 2026-08-03
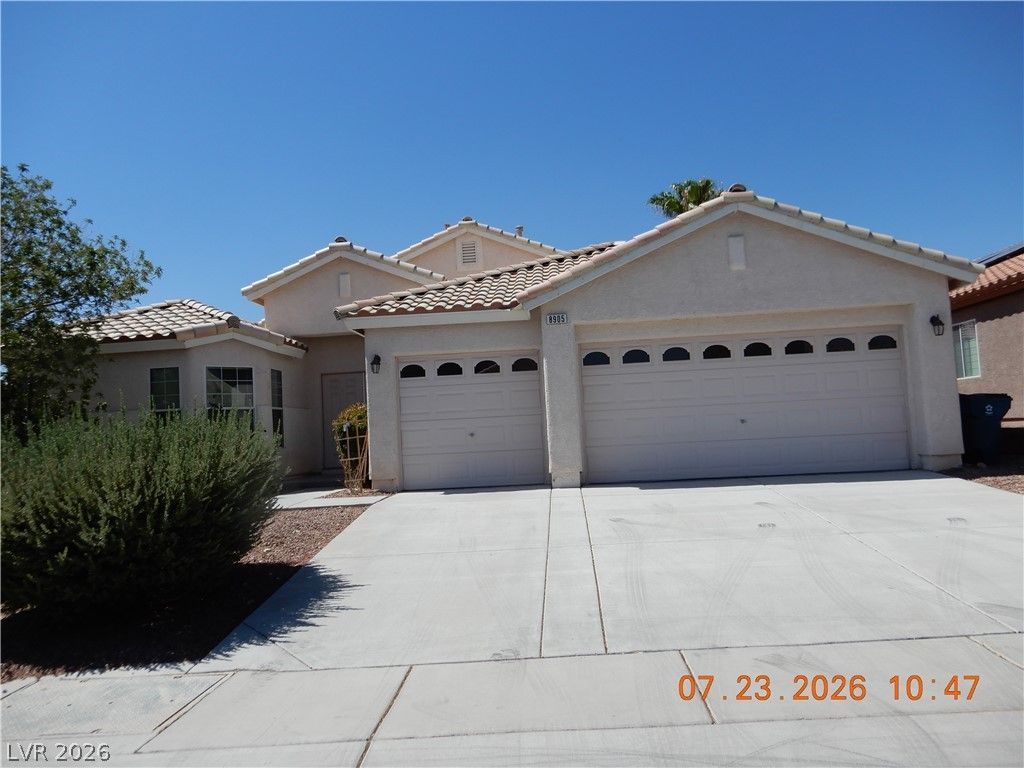
$445,0004 bd2 ba2,212 sqft$201/sqft0.23 mi5 daysSold 2026-08-27
Nearest comparable sales and listings
12 comparables · median price $557,500 · range $445,000 – $724,888 · median $/sq ft $239 · average $/sq ft $242
| Address | Status | Price | $/Sq Ft | Bd / Ba | Sq Ft | Sold / market time | Distance |
|---|---|---|---|---|---|---|---|
| 9709 Mount Lompoc Court | Active | $560,000 | $218 | 4 / 3 | 2,572 | 0 days on market | 0.05 mi |
| 8768 MORENO MOUNTAIN Avenue | Active | $724,888 | $231 | 5 / 3 | 3,132 | 34 days on market | 0.14 mi |
| 9580 Tyler Rose Street | Sold | $565,000 | $239 | 4 / 3 | 2,362 | Sold 2026-09-30 | 0.16 mi |
| 8769 Frasure Falls Avenue | Sold | $555,000 | $254 | 4 / 2 | 2,182 | Sold 2026-08-11 | 0.17 mi |
| 8862 RIO GRANDE FALLS | Sold | $505,000 | $256 | 4 / 2 | 1,970 | Sold 2026-09-04 | 0.18 mi |
| 8676 Moreno Mountain Avenue | Pending | $585,000 | $187 | 5 / 3 | 3,132 | 46 days on market | 0.19 mi |
| 9596 Iris Flat Court | Sold | $610,000 | $307 | 3 / 2 | 1,984 | Sold 2026-04-29 | 0.19 mi |
| 9568 Iris Flat Court | Sold | $545,000 | $266 | 4 / 2 | 2,052 | Sold 2026-08-31 | 0.20 mi |
| 8846 Frasure Falls Avenue | Sold | $458,000 | $231 | 4 / 2 | 1,984 | Sold 2026-08-03 | 0.21 mi |
| 8905 Frasure Falls | Sold | $445,000 | $201 | 4 / 2 | 2,212 | Sold 2026-08-27 | 0.23 mi |
| 9621 Dancing Pond Way | Active | $649,000 | $238 | 4 / 3 | 2,728 | 80 days on market | 0.27 mi |
| 8954 Frasure Falls Avenue | Active | $534,999 | $270 | 3 / 2 | 1,984 | 105 days on market | 0.30 mi |


