
Comparable Sales Near 7418 Apple Bluff Avenue, Las Vegas, NV 89178
1st Realty · Comparable sales report · 1st.estate · October 21, 2026
Read the Enterprise neighborhood guide →
7418 Apple Bluff Avenue, Las Vegas, NV 89178
Status: Sold
$1,475,000 Sold Price
$359
$ / Sq Ft
4,108
Living Area
23,958 sqft
Lot Size
4
Beds
4
Baths
2019
Year Built
Search Parameters
Property Type
Status
Radius
Sold Within
Beds
Baths
Living Area (Sq Ft)
Lot Size (Sq Ft)
This comp search reflects your current search parameters — adjust the filters above as needed for a more accurate estimate.
Estimated Value
—
Average $/Sqft
—
Check one or more comps below to calculate an estimate.
Nearest 10 of 13 comparable sales and listings within 1 mile of this home. Use the filters above and press Search to refine.
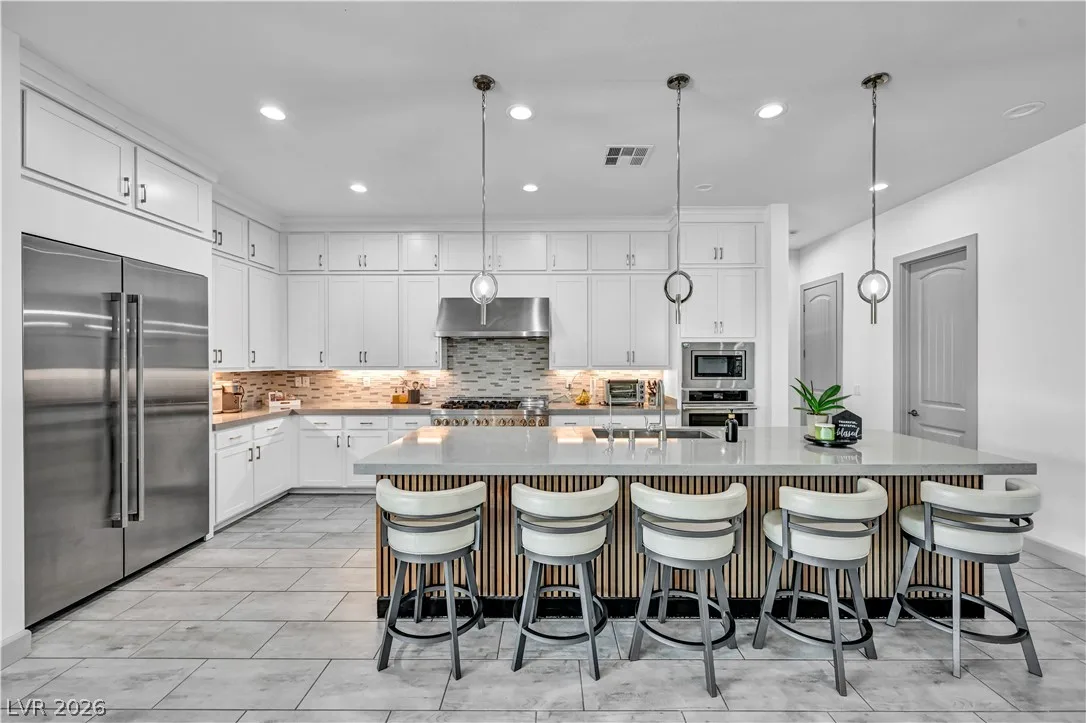
9712 South Tenaya WayActive
$1,325,0004 bd5 ba3,336 sqft$397/sqft0.13 mi0 days

$1,364,9504 bd4 ba3,470 sqft$393/sqft0.66 mi175 days
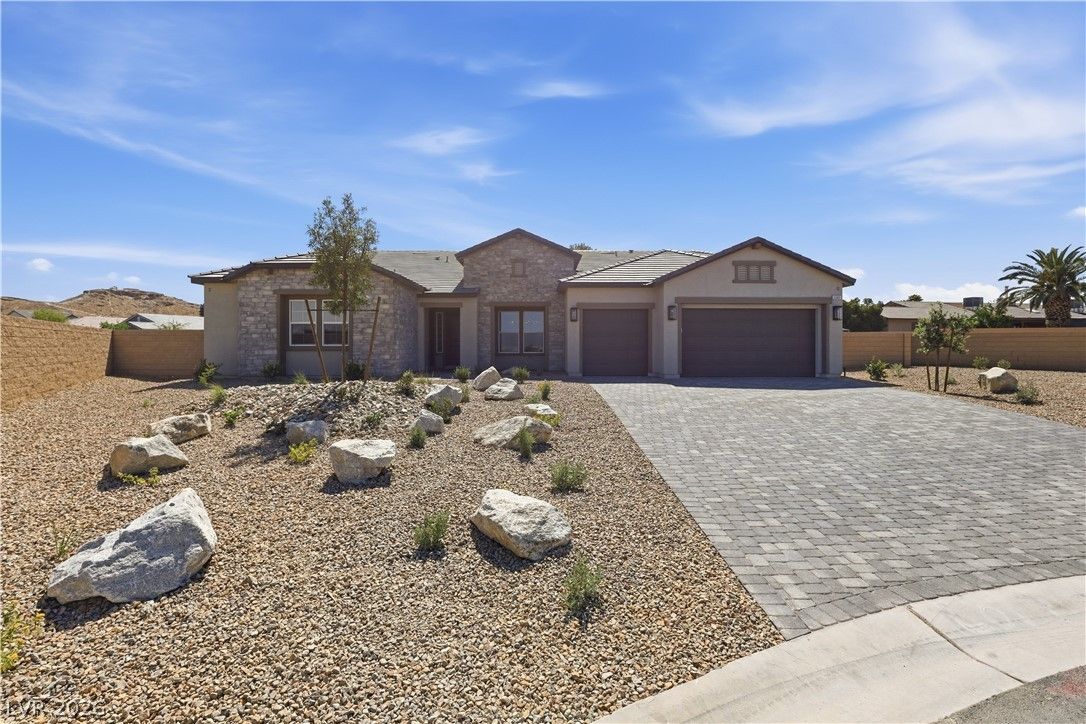
$1,449,9505 bd5 ba4,010 sqft$362/sqft0.66 mi93 daysSold 2026-08-03
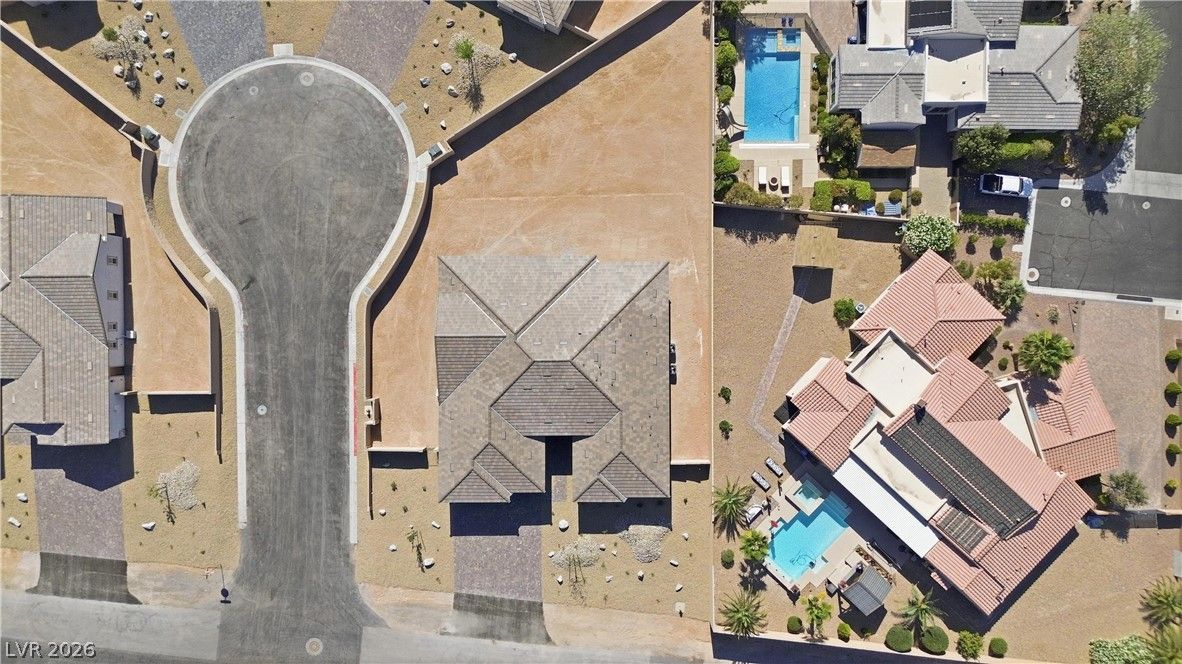
$1,344,9504 bd4 ba3,470 sqft$388/sqft0.69 mi174 days
$1,469,9505 bd5 ba4,010 sqft$367/sqft0.69 mi92 daysSold 2026-07-17

8985 South Tenaya WayActive
$969,9004 bd4 ba3,264 sqft$297/sqft0.78 mi0 days
$1,110,0004 bd4 ba3,878 sqft$286/sqft0.83 mi34 daysSold 2026-06-15

7585 West Pebble RoadActive
$1,599,9504 bd4 ba4,010 sqft$399/sqft0.86 mi214 days

7615 West Pebble RoadActive
$1,479,9504 bd5 ba3,690 sqft$401/sqft0.87 mi154 days

7590 Sky Horse AvenueActive
$2,450,0004 bd4 ba4,325 sqft$566/sqft0.93 mi316 days
Nearest comparable sales and listings
12 comparables · median price $1,459,950 · range $969,900 – $2,450,000 · median $/sq ft $395 · average $/sq ft $399
| Address | Status | Price | $/Sq Ft | Bd / Ba | Sq Ft | Sold / market time | Distance |
|---|---|---|---|---|---|---|---|
| 9712 South Tenaya Way | Active | $1,325,000 | $397 | 4 / 5 | 3,336 | 0 days on market | 0.13 mi |
| 9095 South Monte Cristo Way | Active | $1,364,950 | $393 | 4 / 4 | 3,470 | 175 days on market | 0.66 mi |
| 9085 South Monte Cristo Way | Sold | $1,449,950 | $362 | 5 / 5 | 4,010 | Sold 2026-08-03 | 0.66 mi |
| 9065 South Monte Cristo Way | Active | $1,344,950 | $388 | 4 / 4 | 3,470 | 174 days on market | 0.69 mi |
| 9075 South Monte Cristo Way | Sold | $1,469,950 | $367 | 5 / 5 | 4,010 | Sold 2026-07-17 | 0.69 mi |
| 8985 South Tenaya Way | Active | $969,900 | $297 | 4 / 4 | 3,264 | 0 days on market | 0.78 mi |
| 7670 Frittata Avenue | Sold | $1,110,000 | $286 | 4 / 4 | 3,878 | Sold 2026-06-15 | 0.83 mi |
| 7585 West Pebble Road | Active | $1,599,950 | $399 | 4 / 4 | 4,010 | 214 days on market | 0.86 mi |
| 7615 West Pebble Road | Active | $1,479,950 | $401 | 4 / 5 | 3,690 | 154 days on market | 0.87 mi |
| 7590 Sky Horse Avenue | Active | $2,450,000 | $566 | 4 / 4 | 4,325 | 316 days on market | 0.93 mi |
| 8860 Sweet Magnolia Court | Active | $1,795,000 | $487 | 4 / 4 | 3,683 | 38 days on market | 0.93 mi |
| 8866 Harvest Sunset Street | Sold | $1,620,000 | $440 | 4 / 4 | 3,683 | Sold 2026-08-18 | 0.94 mi |


