
Comparable Sales Near 4136 Tully Avenue, Las Vegas, NV 89110
1st Realty · Comparable sales report · 1st.estate · October 20, 2026
Browse our Las Vegas area guides →
4136 Tully Avenue, Las Vegas, NV 89110
Status: Sold
$355,000 Sold Price
$249
$ / Sq Ft
1,423
Living Area
3,920 sqft
Lot Size
3
Beds
3
Baths
1988
Year Built
Search Parameters
Property Type
Status
Radius
Sold Within
Beds
Baths
Living Area (Sq Ft)
Lot Size (Sq Ft)
This comp search reflects your current search parameters — adjust the filters above as needed for a more accurate estimate.
Estimated Value
—
Average $/Sqft
—
Check one or more comps below to calculate an estimate.
Nearest 10 of 15 comparable sales and listings within 1 mile of this home. Use the filters above and press Search to refine.
$343,0002 bd2 ba1,095 sqft$313/sqft0.22 mi6 daysSold 2026-04-27
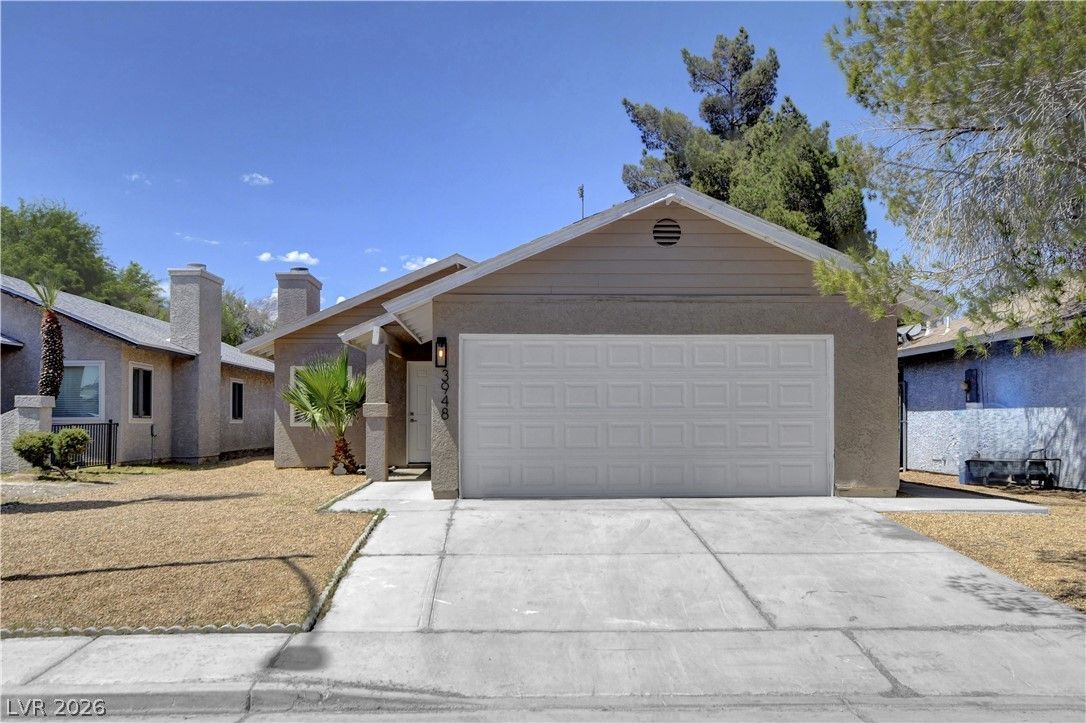
$360,0003 bd2 ba1,152 sqft$313/sqft0.23 mi50 daysSold 2026-09-09
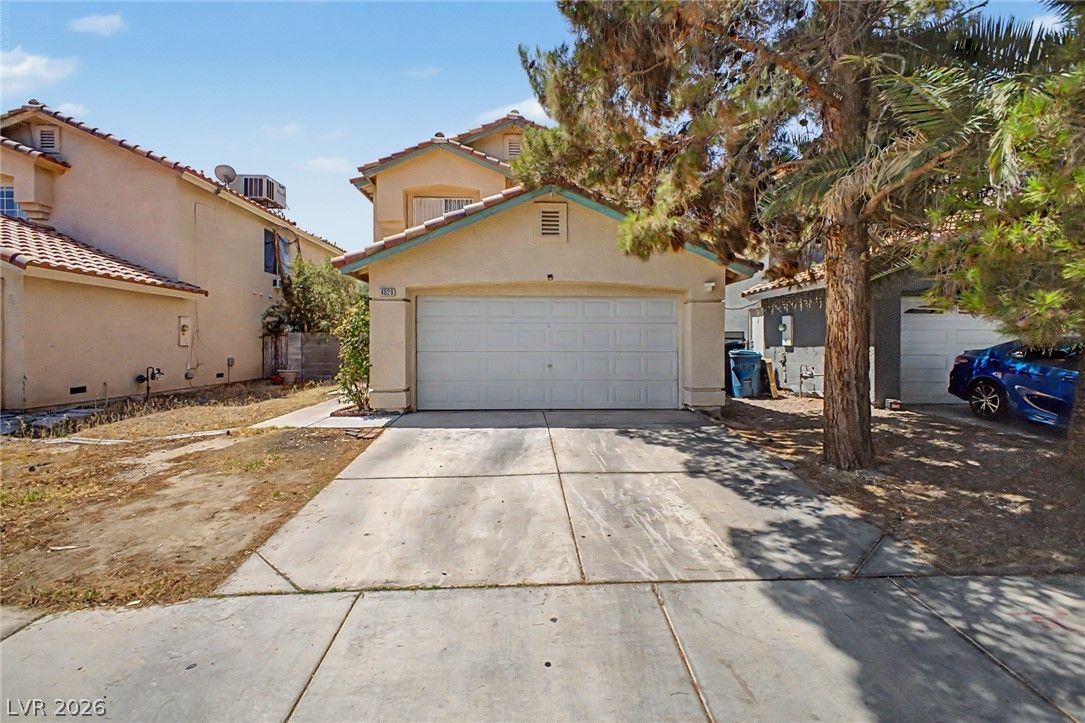
$345,0004 bd3 ba1,479 sqft$233/sqft0.27 mi24 daysSold 2026-09-14

$318,0003 bd2 ba1,072 sqft$297/sqft0.40 mi58 daysSold 2026-10-08
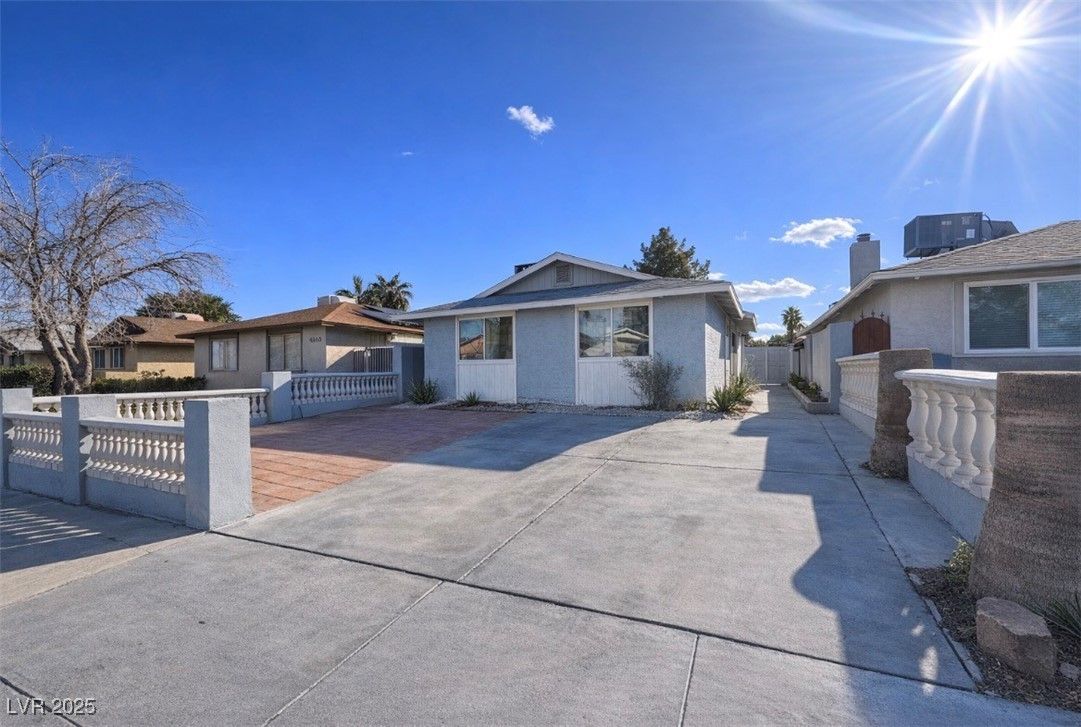
$325,0003 bd2 ba1,378 sqft$236/sqft0.50 mi159 daysSold 2026-08-25
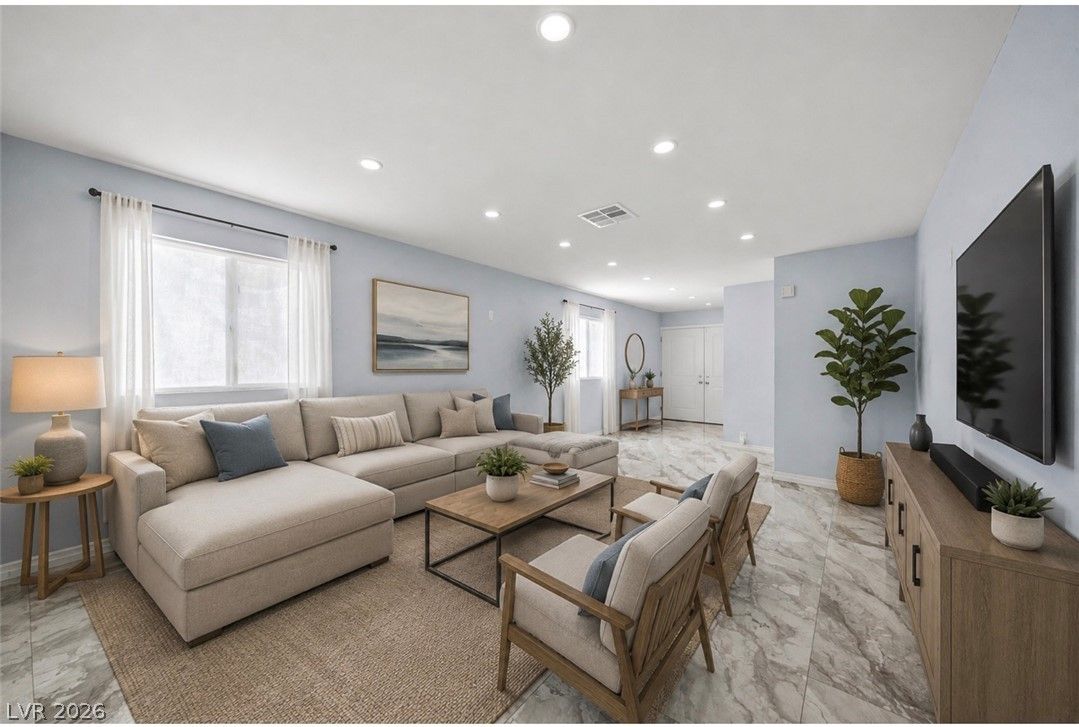
$382,0003 bd2 ba1,236 sqft$309/sqft0.57 mi14 daysSold 2026-09-02
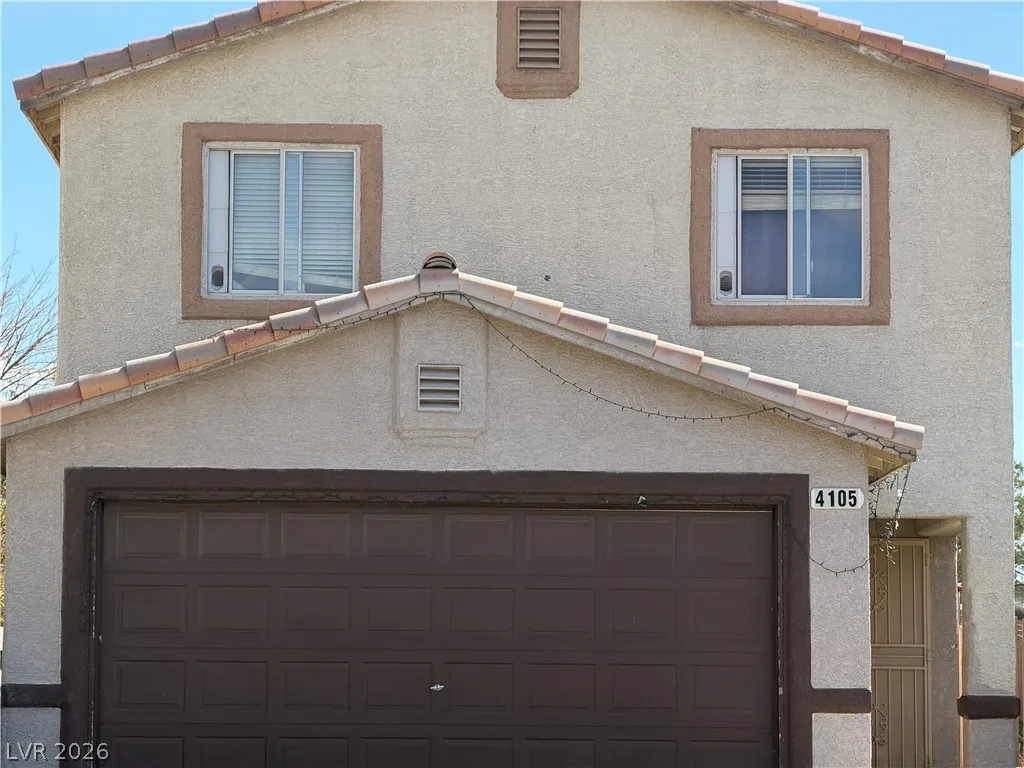
4105 Talavera CourtActive
$375,0004 bd3 ba1,406 sqft$267/sqft0.64 mi0 days
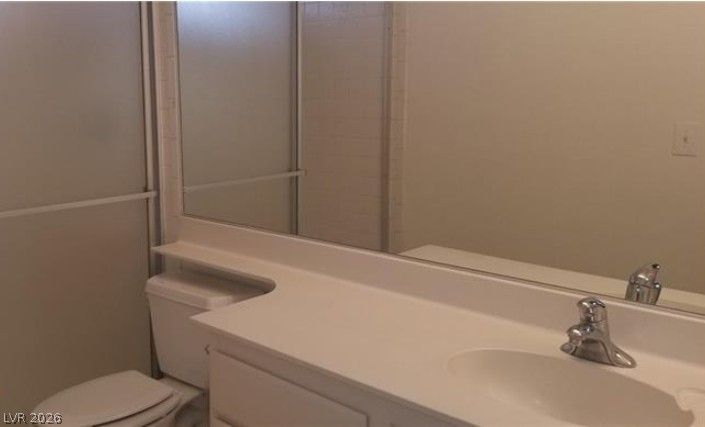
4037 Pelham CourtActive
$319,9993 bd2 ba1,151 sqft$278/sqft0.67 mi1 days
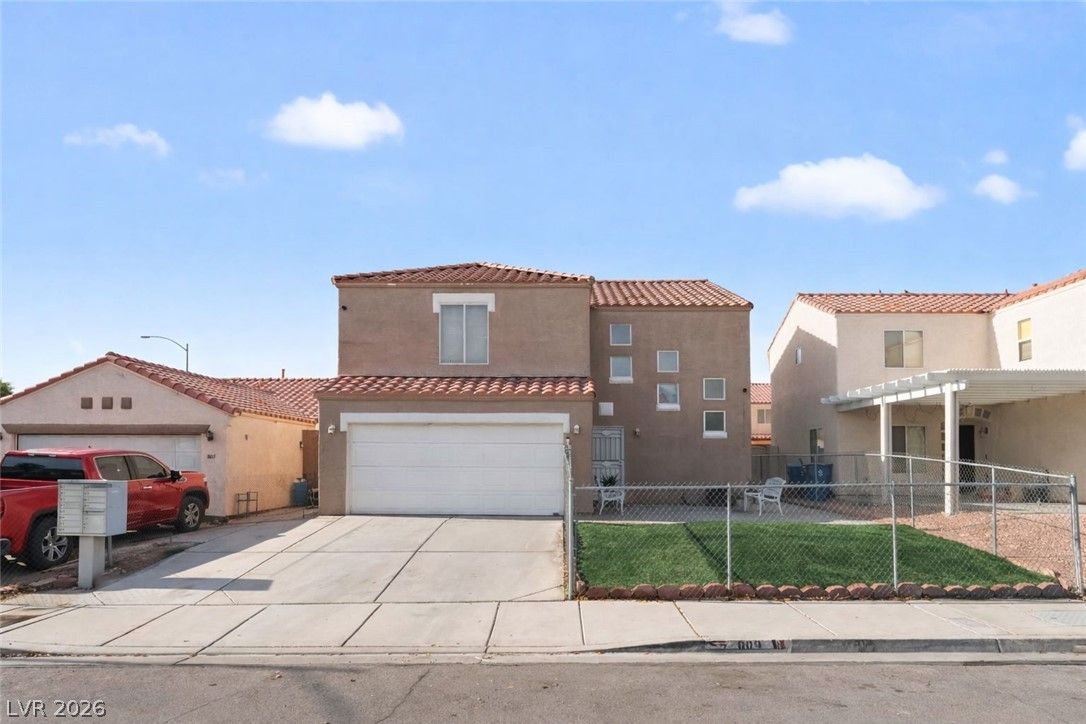
$395,0004 bd3 ba1,765 sqft$224/sqft0.71 mi6 daysSold 2026-08-31
556 Croft WaySold
$375,0003 bd2 ba1,470 sqft$255/sqft0.88 mi71 daysSold 2026-06-26
Nearest comparable sales and listings
12 comparables · median price $354,995 · range $318,000 – $435,000 · median $/sq ft $263 · average $/sq ft $267
| Address | Status | Price | $/Sq Ft | Bd / Ba | Sq Ft | Sold / market time | Distance |
|---|---|---|---|---|---|---|---|
| 653 Lineshack Lane | Sold | $343,000 | $313 | 2 / 2 | 1,095 | Sold 2026-04-27 | 0.22 mi |
| 3948 New Hope Way | Sold | $360,000 | $313 | 3 / 2 | 1,152 | Sold 2026-09-09 | 0.23 mi |
| 4029 Posse Avenue | Sold | $345,000 | $233 | 4 / 3 | 1,479 | Sold 2026-09-14 | 0.27 mi |
| 4021 Lighthouse Avenue | Sold | $318,000 | $297 | 3 / 2 | 1,072 | Sold 2026-10-08 | 0.40 mi |
| 4539 Bingham Avenue | Sold | $325,000 | $236 | 3 / 2 | 1,378 | Sold 2026-08-25 | 0.50 mi |
| 3609 Park Oliver Drive | Sold | $382,000 | $309 | 3 / 2 | 1,236 | Sold 2026-09-02 | 0.57 mi |
| 4105 Talavera Court | Active | $375,000 | $267 | 4 / 3 | 1,406 | 0 days on market | 0.64 mi |
| 4037 Pelham Court | Active | $319,999 | $278 | 3 / 2 | 1,151 | 1 days on market | 0.67 mi |
| 809 Bladensburg Street | Sold | $395,000 | $224 | 4 / 3 | 1,765 | Sold 2026-08-31 | 0.71 mi |
| 556 Croft Way | Sold | $375,000 | $255 | 3 / 2 | 1,470 | Sold 2026-06-26 | 0.88 mi |
| 4802 Osborn Court | Active | $435,000 | $259 | 4 / 4 | 1,679 | 53 days on market | 0.92 mi |
| 1620 Legato Falls Street | Under Contract | $349,990 | $226 | 4 / 3 | 1,550 | 18 days on market | 0.92 mi |


