
Comparable Sales Near 4111 Rancho Crossing Street, Las Vegas, NV 89130
1st Realty · Comparable sales report · 1st.estate · October 20, 2026
Browse our Las Vegas area guides →
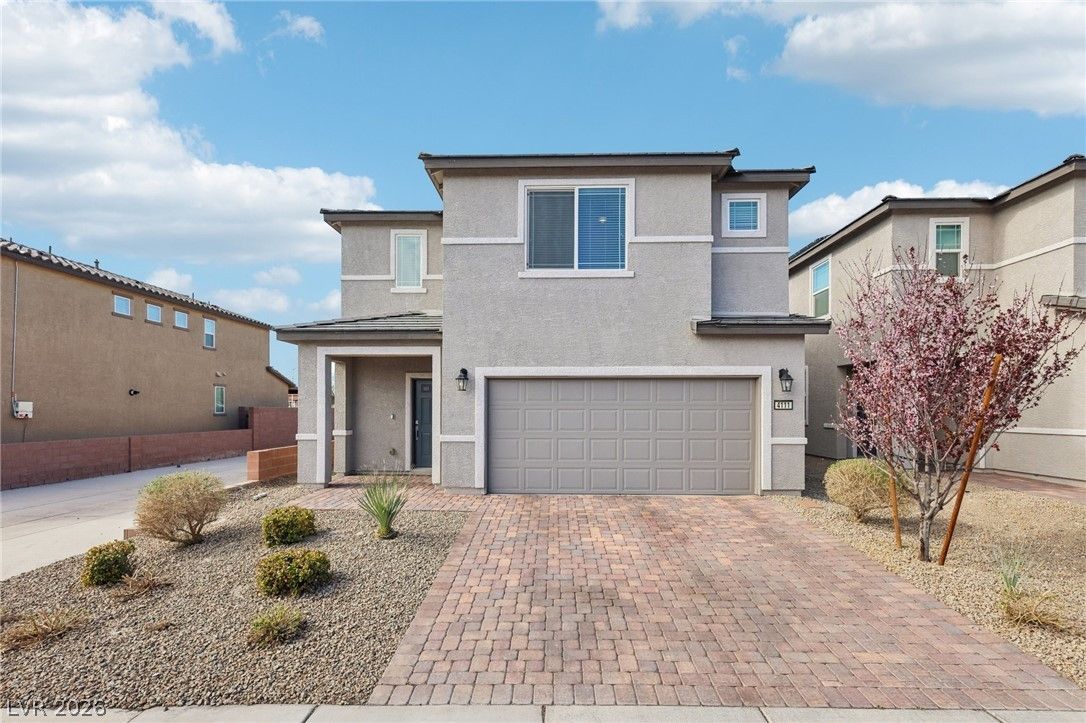
4111 Rancho Crossing Street, Las Vegas, NV 89130
Status: Sold
$2,750 Sold Price
$1
$ / Sq Ft
2,526
Living Area
3,920 sqft
Lot Size
4
Beds
3
Baths
2022
Year Built
Search Parameters
Property Type
Status
Radius
Sold Within
Beds
Baths
Living Area (Sq Ft)
Lot Size (Sq Ft)
This comp search reflects your current search parameters — adjust the filters above as needed for a more accurate estimate.
Estimated Value
—
Average $/Sqft
—
Check one or more comps below to calculate an estimate.
Nearest 10 of 12 comparable sales and listings within 1 mile of this home. Use the filters above and press Search to refine.
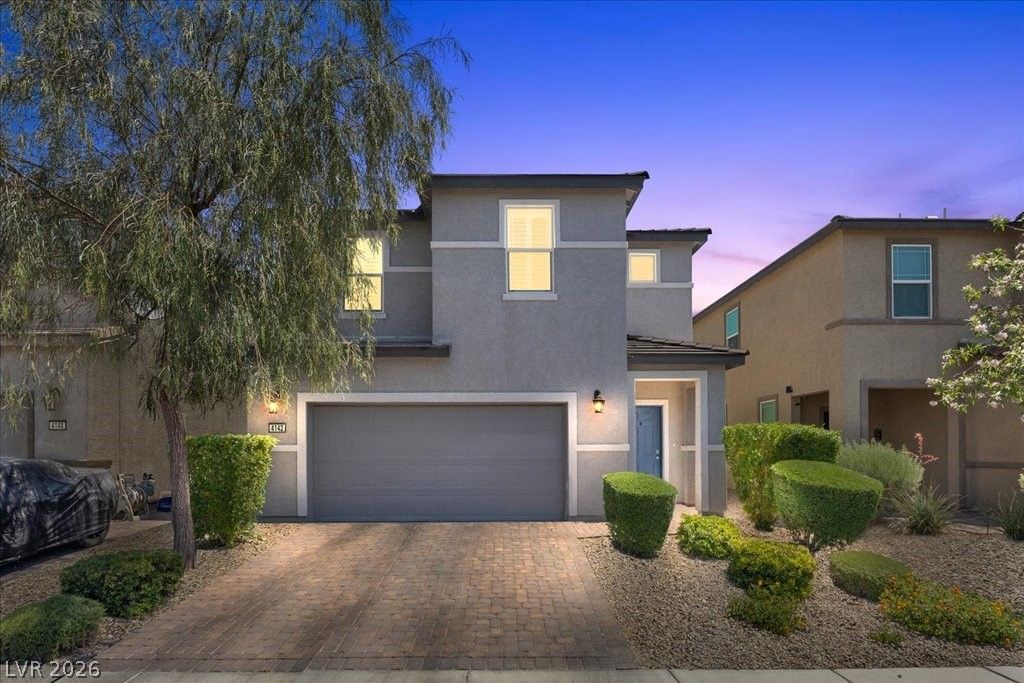
$450,0003 bd3 ba2,040 sqft$221/sqft0.05 mi52 daysSold 2026-08-03
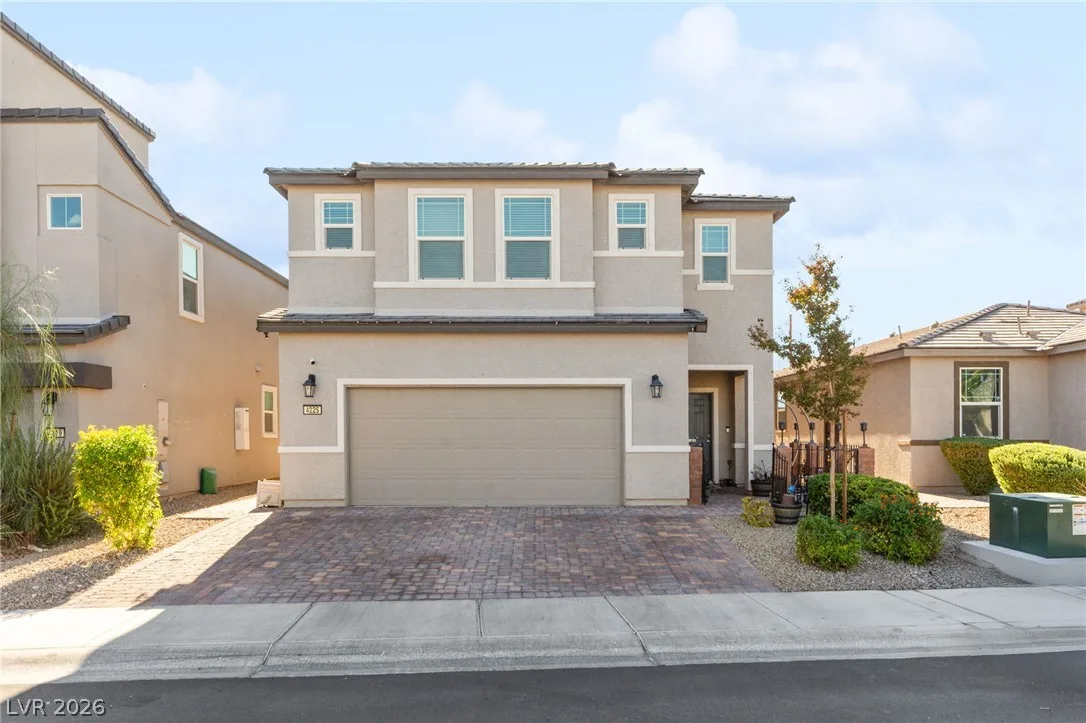
$450,0005 bd4 ba2,718 sqft$166/sqft0.14 mi0 days
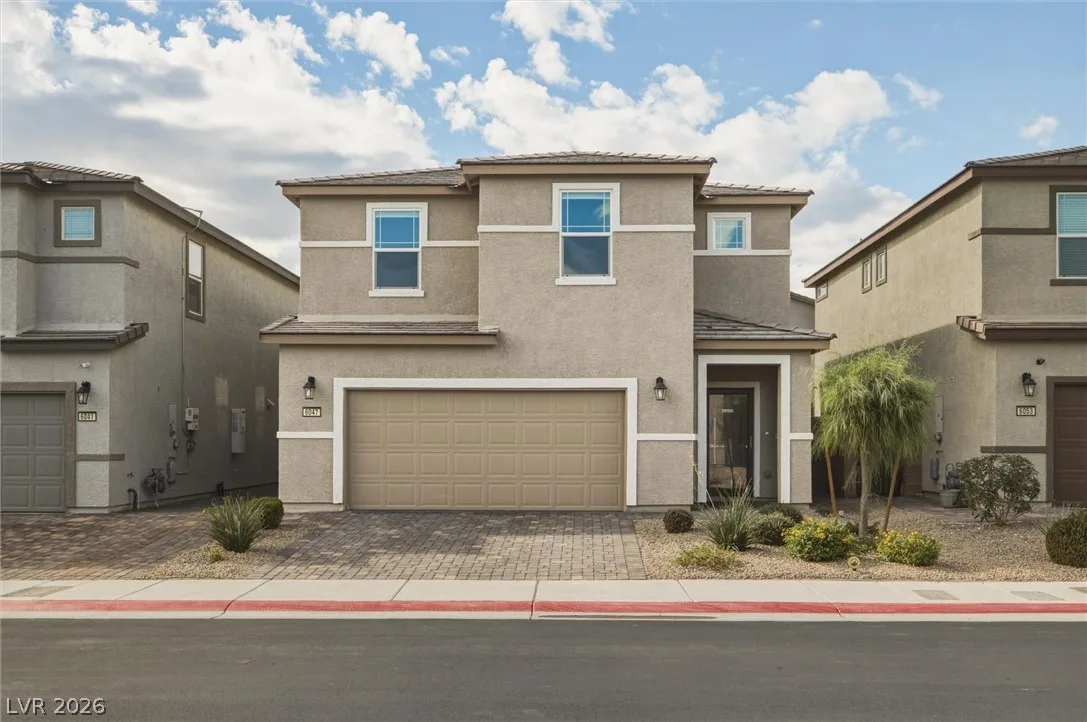
$465,0003 bd3 ba2,040 sqft$228/sqft0.14 mi1 days
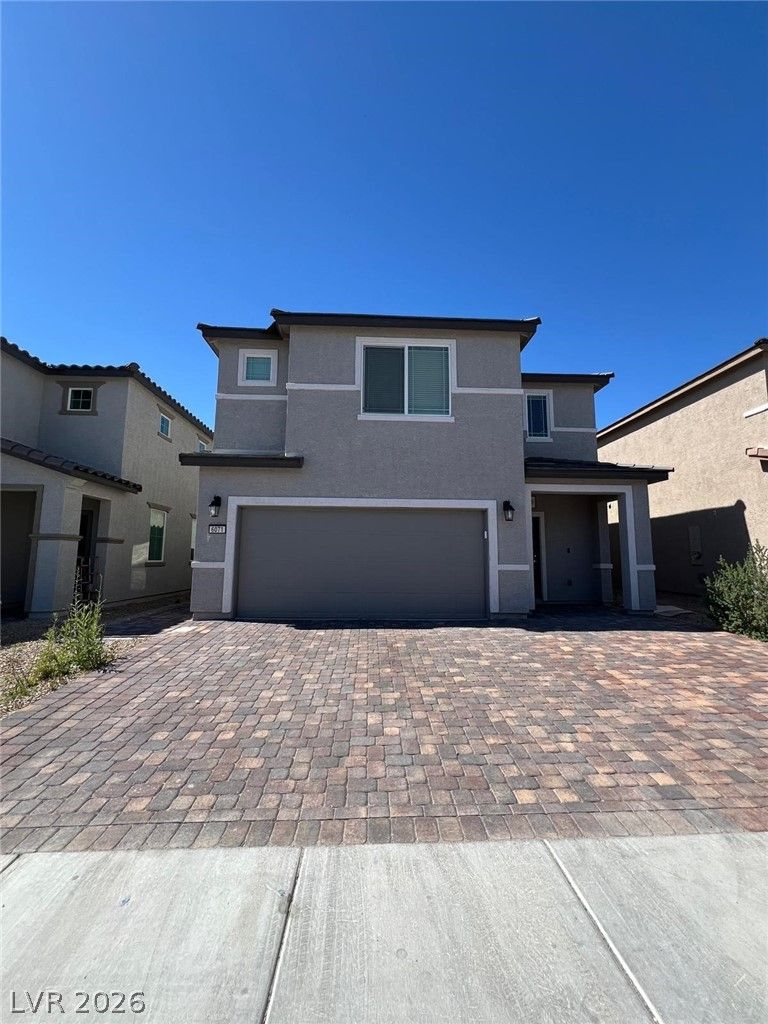
$490,0004 bd3 ba2,526 sqft$194/sqft0.14 mi170 days
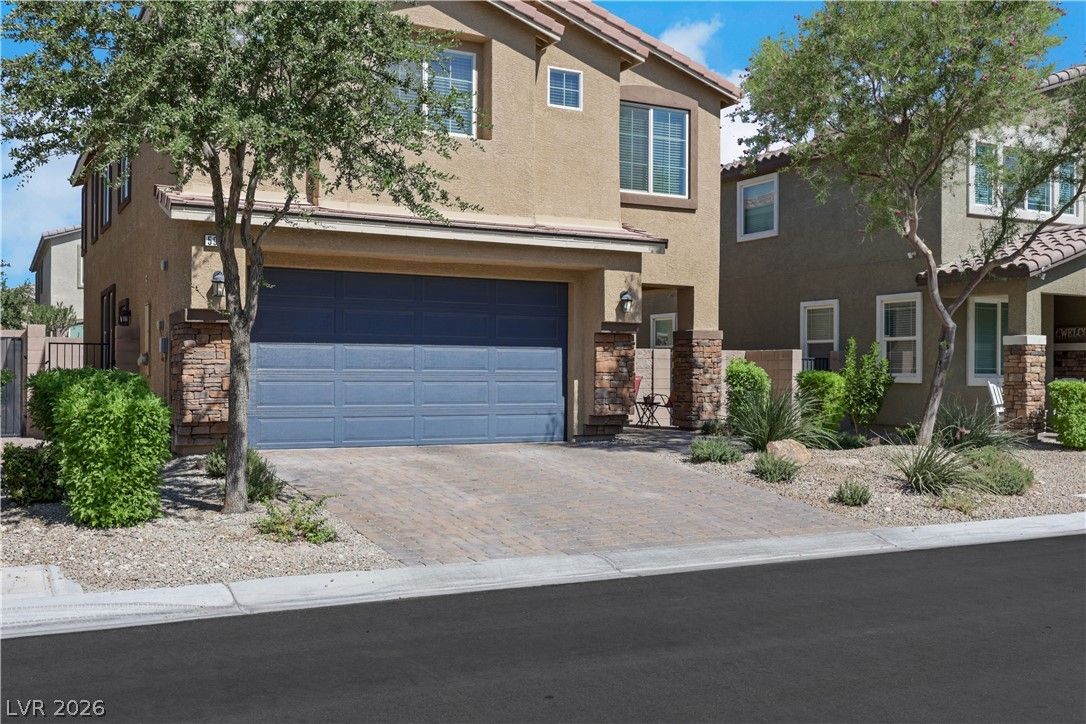
$499,0004 bd3 ba2,424 sqft$206/sqft0.16 mi1 days
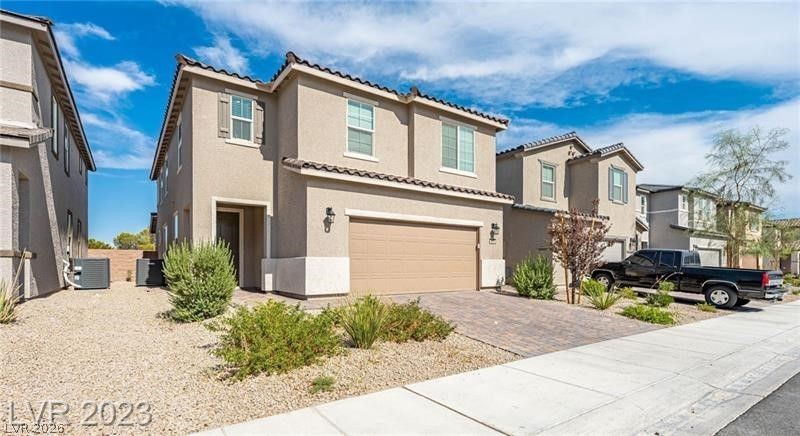
4278 Eagle IslandActive
$475,0005 bd4 ba2,718 sqft$175/sqft0.16 mi0 days
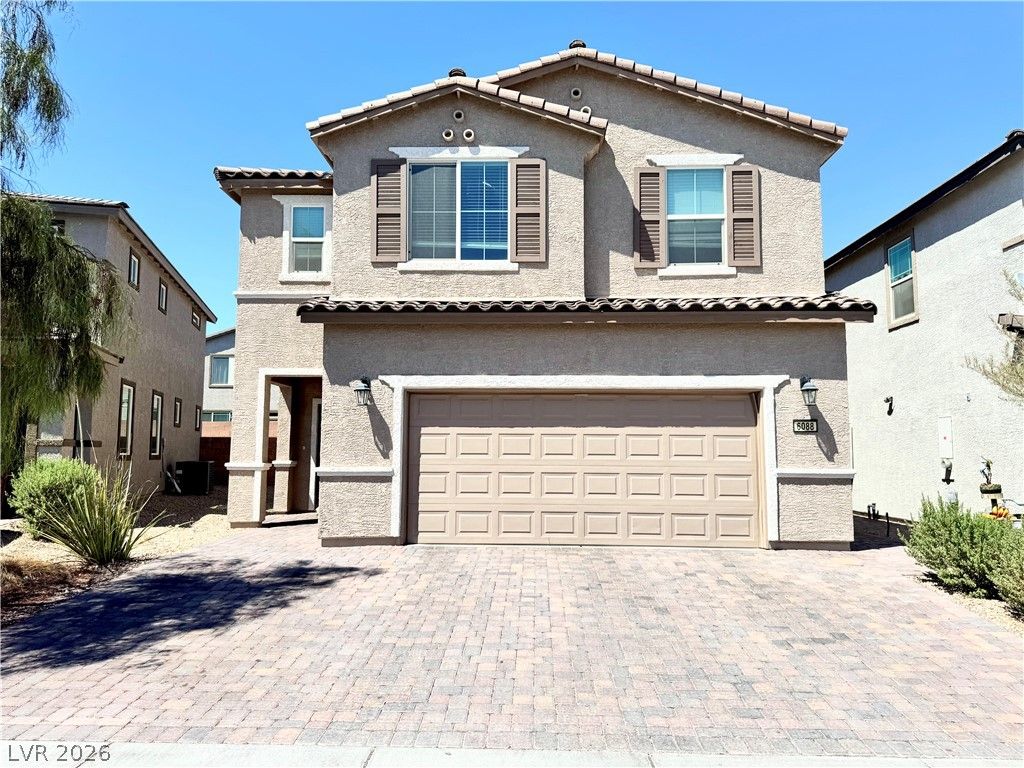
$499,0005 bd4 ba2,718 sqft$184/sqft0.17 mi0 days
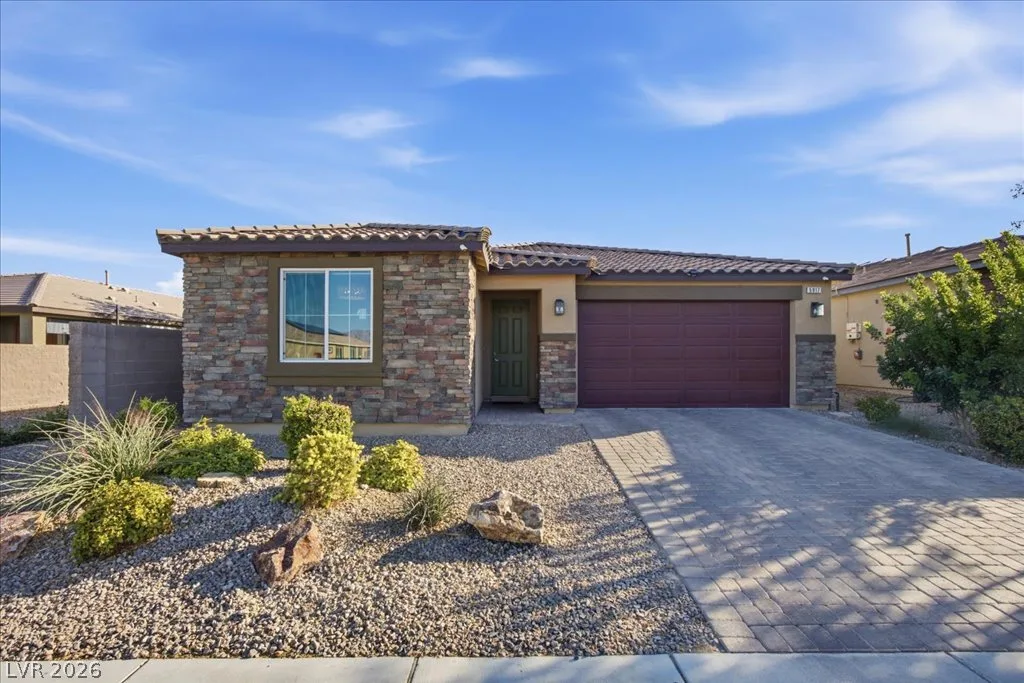
$520,0004 bd3 ba2,044 sqft$254/sqft0.18 mi10 days
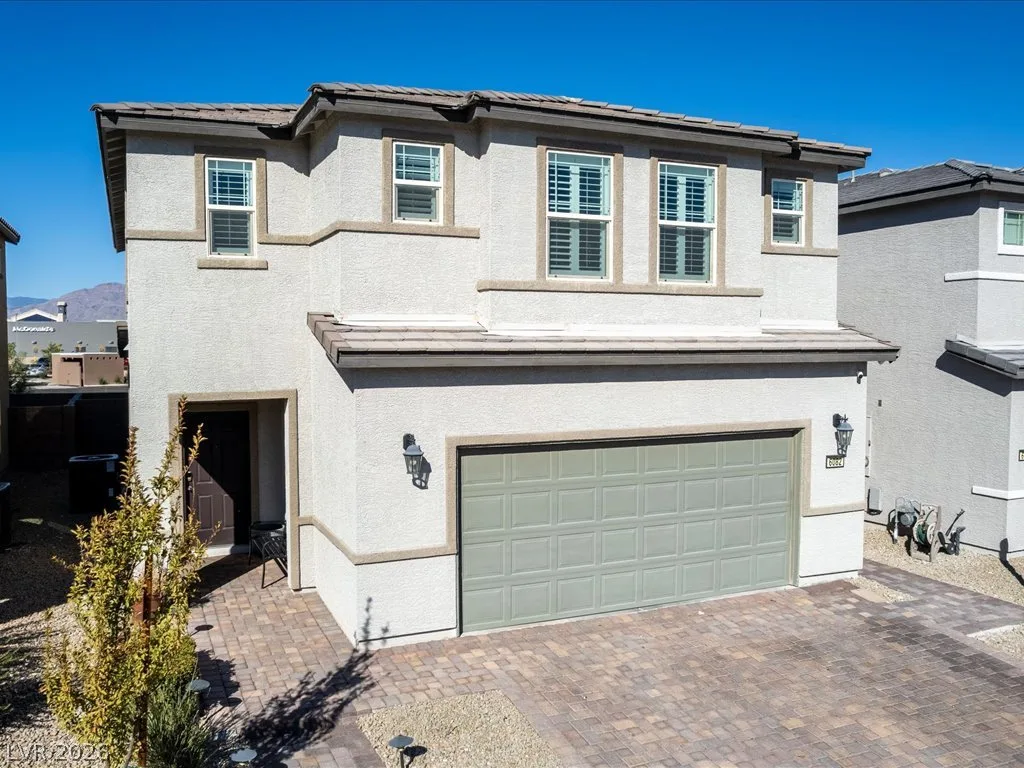
6082 Rose Springs AvenueActive
$485,0005 bd4 ba2,718 sqft$178/sqft0.21 mi0 days
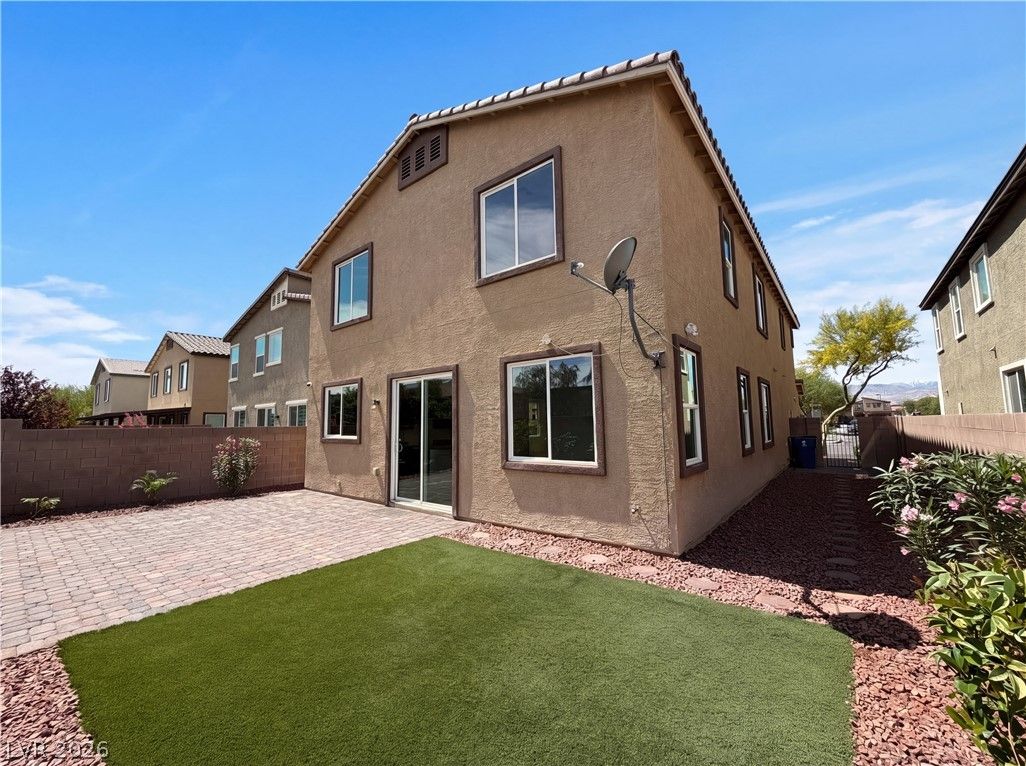
4036 White Opal StreetPending
$488,0005 bd3 ba2,956 sqft$165/sqft0.22 mi162 days
Nearest comparable sales and listings
12 comparables · median price $480,000 · range $399,900 – $520,000 · median $/sq ft $194 · average $/sq ft $197
| Address | Status | Price | $/Sq Ft | Bd / Ba | Sq Ft | Sold / market time | Distance |
|---|---|---|---|---|---|---|---|
| 4142 Rancho Crossing Street | Sold | $450,000 | $221 | 3 / 3 | 2,040 | Sold 2026-08-03 | 0.05 mi |
| 4225 Rancho Crossing Street | Active | $450,000 | $166 | 5 / 4 | 2,718 | 0 days on market | 0.14 mi |
| 6047 Castle Gardens Avenue | Active | $465,000 | $228 | 3 / 3 | 2,040 | 1 days on market | 0.14 mi |
| 6071 Castle Gardens Avenue | Active | $490,000 | $194 | 4 / 3 | 2,526 | 170 days on market | 0.14 mi |
| 5966 Juniper Falls Avenue | Active | $499,000 | $206 | 4 / 3 | 2,424 | 1 days on market | 0.16 mi |
| 4278 Eagle Island | Active | $475,000 | $175 | 5 / 4 | 2,718 | 0 days on market | 0.16 mi |
| 6088 Castle Gardens Avenue | Active | $499,000 | $184 | 5 / 4 | 2,718 | 0 days on market | 0.17 mi |
| 5917 Peridot Falls Avenue | Active | $520,000 | $254 | 4 / 3 | 2,044 | 10 days on market | 0.18 mi |
| 6082 Rose Springs Avenue | Active | $485,000 | $178 | 5 / 4 | 2,718 | 0 days on market | 0.21 mi |
| 4036 White Opal Street | Pending | $488,000 | $165 | 5 / 3 | 2,956 | 162 days on market | 0.22 mi |
| 3613 Rainy River Road | Sold | $399,900 | $196 | 3 / 3 | 2,038 | Sold 2026-05-05 | 0.88 mi |
| 6549 West Pepperidge Way | Sold | $424,900 | $194 | 4 / 3 | 2,186 | Sold 2026-08-21 | 0.91 mi |


