
Comparable Sales Near 808 Pirates Cave Court, North Las Vegas, NV 89032
1st Realty · Comparable sales report · 1st.estate · October 20, 2026
Read the North Las Vegas area guide →
808 Pirates Cave Court, North Las Vegas, NV 89032
Status: Sold
$400,000 Sold Price
$220
$ / Sq Ft
1,815
Living Area
6,098 sqft
Lot Size
3
Beds
2
Baths
2005
Year Built
Search Parameters
Property Type
Status
Radius
Sold Within
Beds
Baths
Living Area (Sq Ft)
Lot Size (Sq Ft)
This comp search reflects your current search parameters — adjust the filters above as needed for a more accurate estimate.
Estimated Value
—
Average $/Sqft
—
Check one or more comps below to calculate an estimate.
Nearest 10 of 52 comparable sales and listings within 1 mile of this home. Use the filters above and press Search to refine.
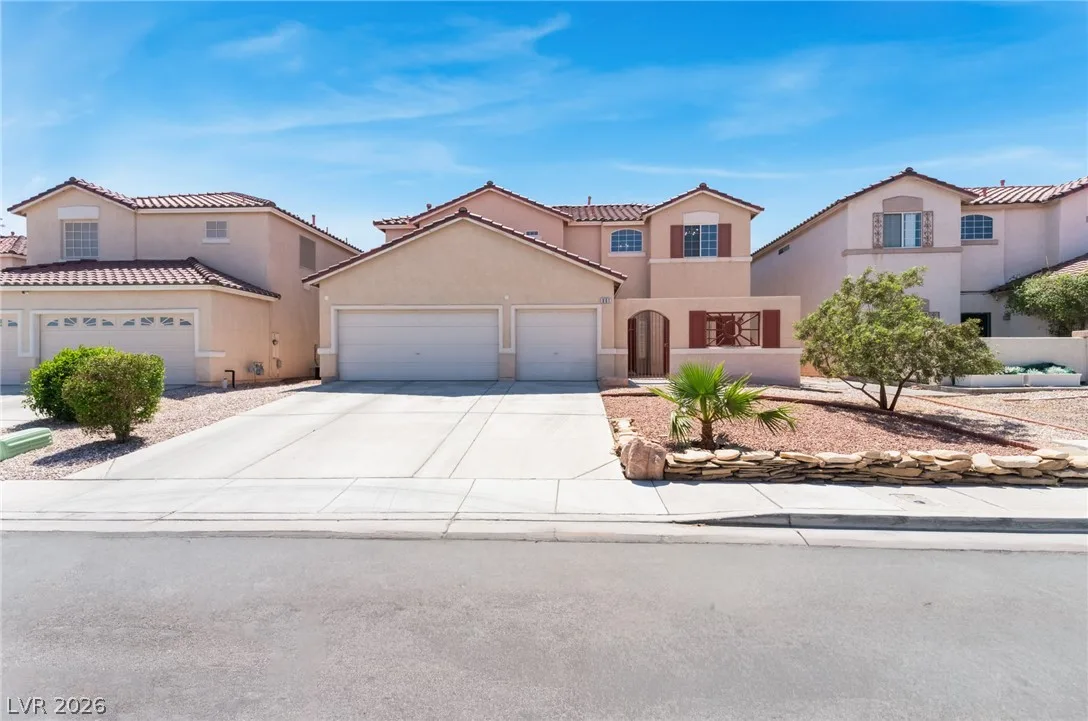
$475,0004 bd3 ba2,259 sqft$210/sqft0.05 mi7 days
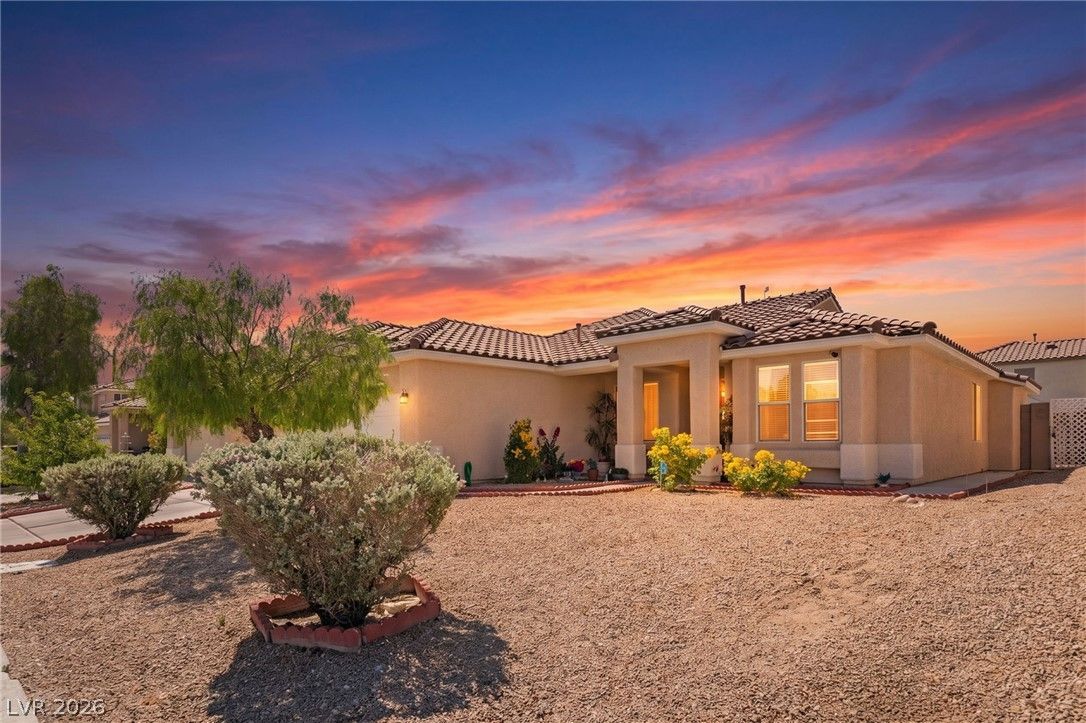
$400,0003 bd2 ba1,815 sqft$220/sqft0.12 mi90 daysSold 2026-10-08
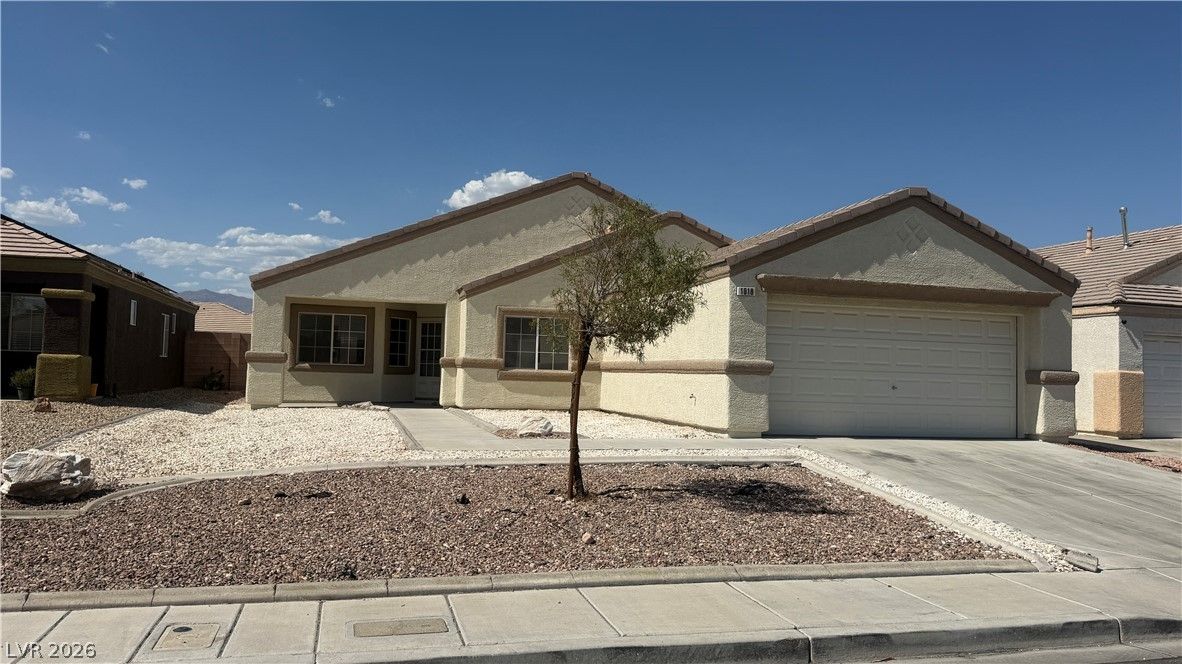
1018 Elliot Park AvenueActive
$425,0003 bd2 ba1,637 sqft$260/sqft0.17 mi2 days
$500,0004 bd3 ba2,259 sqft$221/sqft0.22 mi31 daysSold 2026-05-13
$403,5003 bd2 ba1,637 sqft$246/sqft0.23 mi7 daysSold 2026-06-03
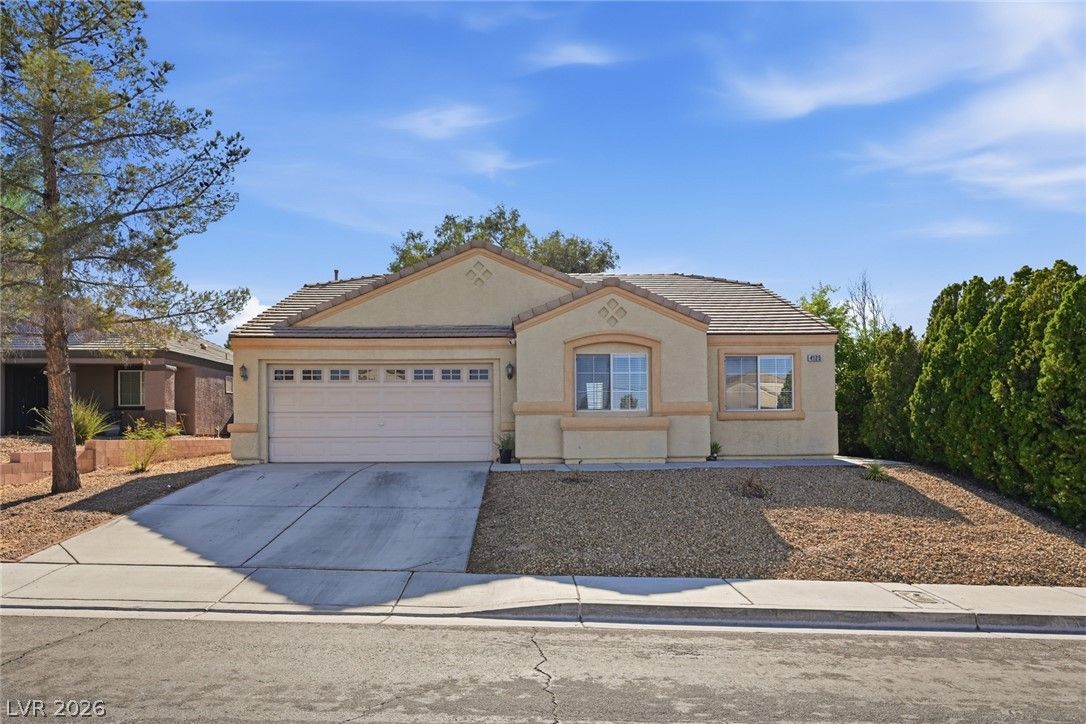
$408,0003 bd2 ba1,574 sqft$259/sqft0.23 mi9 daysSold 2026-07-31
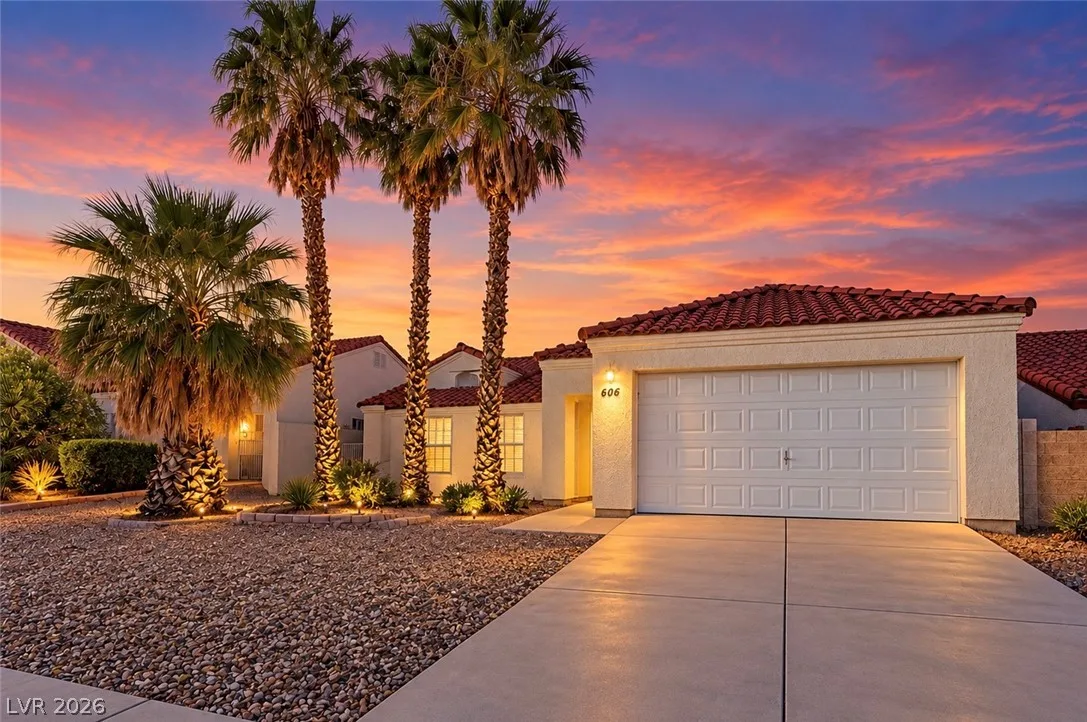
$399,0003 bd2 ba1,539 sqft$259/sqft0.25 mi0 days
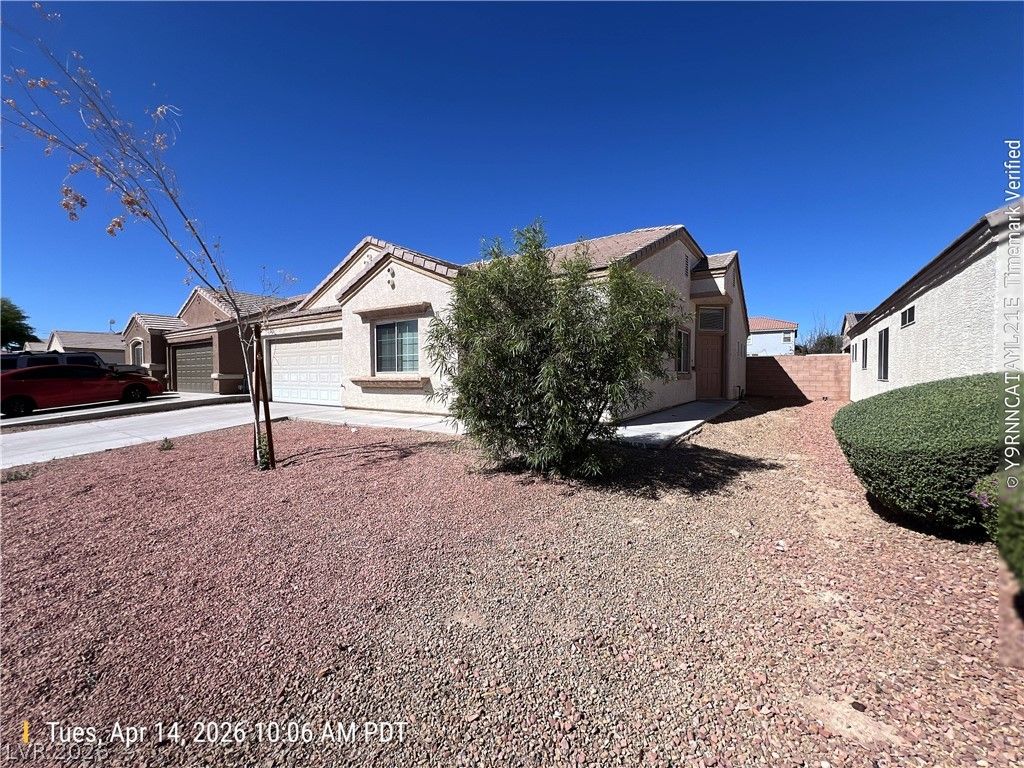
$365,0004 bd2 ba1,574 sqft$232/sqft0.28 mi49 daysSold 2026-08-21
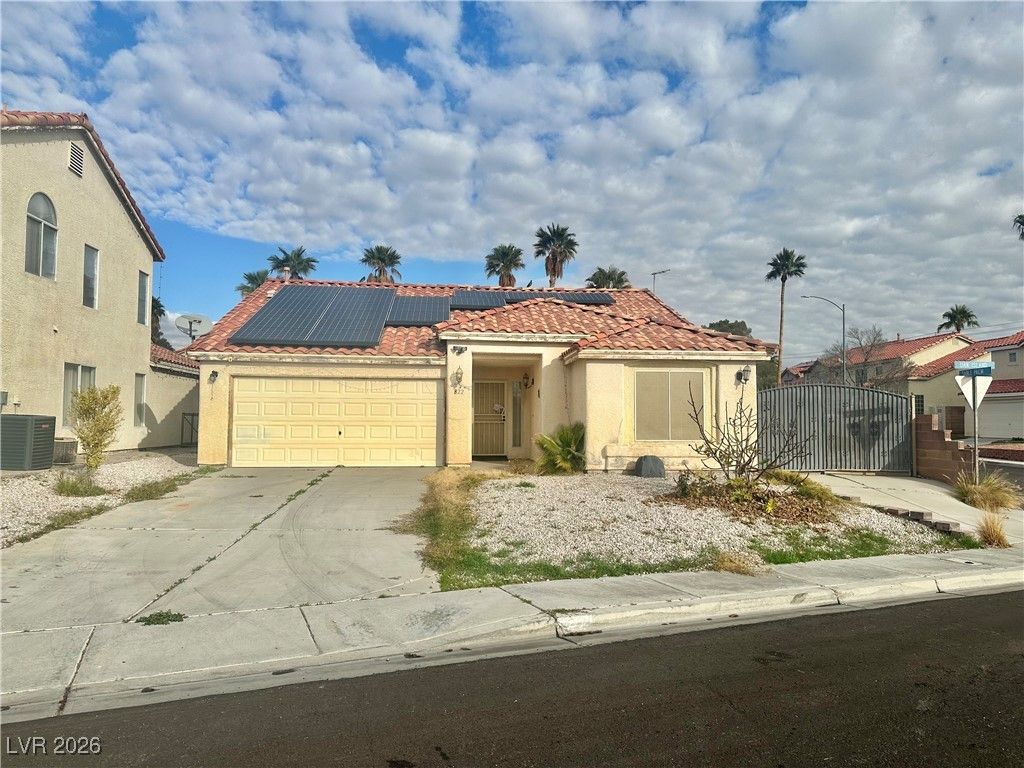
$340,0002 bd2 ba1,576 sqft$216/sqft0.29 mi85 daysSold 2026-05-27
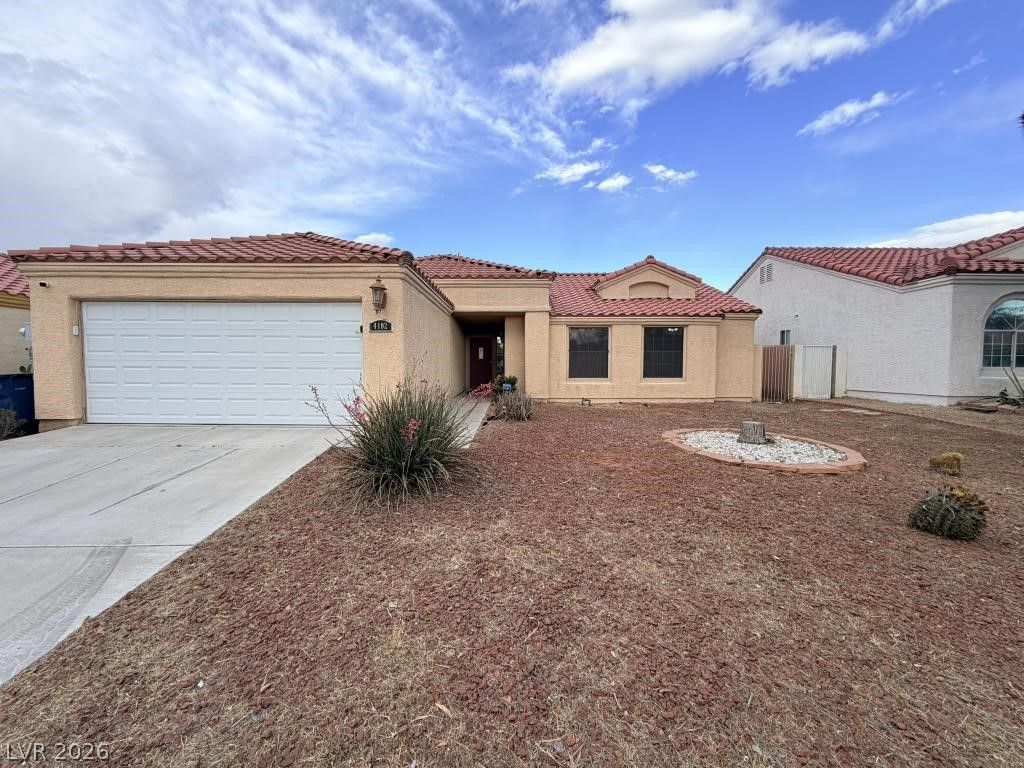
$325,0002 bd2 ba1,539 sqft$211/sqft0.31 mi19 daysSold 2026-08-31
Nearest comparable sales and listings
12 comparables · median price $401,750 · range $325,000 – $500,000 · median $/sq ft $228 · average $/sq ft $233
| Address | Status | Price | $/Sq Ft | Bd / Ba | Sq Ft | Sold / market time | Distance |
|---|---|---|---|---|---|---|---|
| 901 North Elliot Park Avenue | Active | $475,000 | $210 | 4 / 3 | 2,259 | 7 days on market | 0.05 mi |
| 817 Bolivar Avenue | Sold | $400,000 | $220 | 3 / 2 | 1,815 | Sold 2026-10-08 | 0.12 mi |
| 1018 Elliot Park Avenue | Active | $425,000 | $260 | 3 / 2 | 1,637 | 2 days on market | 0.17 mi |
| 4114 Jessica Marie Street | Sold | $500,000 | $221 | 4 / 3 | 2,259 | Sold 2026-05-13 | 0.22 mi |
| 1116 Christopher View Avenue | Sold | $403,500 | $246 | 3 / 2 | 1,637 | Sold 2026-06-03 | 0.23 mi |
| 4125 Allyson Rae Street | Sold | $408,000 | $259 | 3 / 2 | 1,574 | Sold 2026-07-31 | 0.23 mi |
| 606 Heartland Point Avenue | Active | $399,000 | $259 | 3 / 2 | 1,539 | 0 days on market | 0.25 mi |
| 4045 Aaron Scott Street | Sold | $365,000 | $232 | 4 / 2 | 1,574 | Sold 2026-08-21 | 0.28 mi |
| 822 Oak Island Drive | Sold | $340,000 | $216 | 2 / 2 | 1,576 | Sold 2026-05-27 | 0.29 mi |
| 4102 Hemphill Street | Sold | $325,000 | $211 | 2 / 2 | 1,539 | Sold 2026-08-31 | 0.31 mi |
| 832 Quicksand Lane | Sold | $475,000 | $239 | 4 / 3 | 1,987 | Sold 2026-09-24 | 0.36 mi |
| 3721 Penny Cross Drive | Sold | $385,000 | $223 | 3 / 3 | 1,723 | Sold 2026-09-16 | 0.36 mi |


