
Comparable Sales Near 7625 Belmondo Lane, Las Vegas, NV 89128
1st Realty · Comparable sales report · 1st.estate · October 21, 2026
Read the Desert Shores neighborhood guide →
7625 Belmondo Lane, Las Vegas, NV 89128
Status: Sold
$2,600 Sold Price
$1
$ / Sq Ft
1,920
Living Area
6,970 sqft
Lot Size
2
Beds
2
Baths
1992
Year Built
Search Parameters
Property Type
Status
Radius
Sold Within
Beds
Baths
Living Area (Sq Ft)
Lot Size (Sq Ft)
This comp search reflects your current search parameters — adjust the filters above as needed for a more accurate estimate.
Estimated Value
—
Average $/Sqft
—
Check one or more comps below to calculate an estimate.
Nearest 10 of 27 comparable sales and listings within 1 mile of this home. Use the filters above and press Search to refine.
$430,0002 bd3 ba1,968 sqft$218/sqft0.17 mi5 daysSold 2026-06-25
$861,5003 bd3 ba1,968 sqft$438/sqft0.18 mi16 daysSold 2026-06-26

2901 Channel Bay DriveActive
$850,0003 bd2 ba1,627 sqft$522/sqft0.55 mi36 days
$457,0003 bd2 ba1,627 sqft$281/sqft0.55 mi16 daysSold 2026-05-18
$560,0003 bd2 ba2,082 sqft$269/sqft0.55 mi8 daysSold 2026-06-15

2524 Sunset Beach LaneActive
$656,0003 bd2 ba2,393 sqft$274/sqft0.62 mi159 days
$510,0003 bd2 ba2,316 sqft$220/sqft0.63 mi38 daysSold 2026-07-21
$575,0003 bd2 ba1,925 sqft$299/sqft0.64 mi54 daysSold 2026-06-04
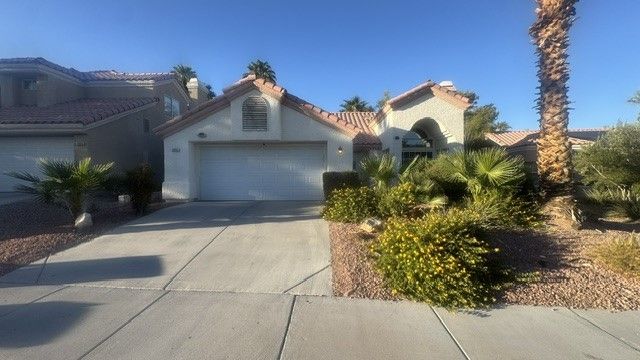
2952 Cape Verde LaneActive
$500,0003 bd2 ba1,627 sqft$307/sqft0.67 mi22 days

8245 Aqua Spray AvenueUnder Contract
$515,0003 bd2 ba2,033 sqft$253/sqft0.69 mi87 days
Nearest comparable sales and listings
12 comparables · median price $512,500 · range $430,000 – $861,500 · median $/sq ft $281 · average $/sq ft $307
| Address | Status | Price | $/Sq Ft | Bd / Ba | Sq Ft | Sold / market time | Distance |
|---|---|---|---|---|---|---|---|
| 2536 Seascape Drive | Sold | $430,000 | $218 | 2 / 3 | 1,968 | Sold 2026-06-25 | 0.17 mi |
| 7912 Abalone Cove Drive | Sold | $861,500 | $438 | 3 / 3 | 1,968 | Sold 2026-06-26 | 0.18 mi |
| 2901 Channel Bay Drive | Active | $850,000 | $522 | 3 / 2 | 1,627 | 36 days on market | 0.55 mi |
| 2900 Channel Bay Drive | Sold | $457,000 | $281 | 3 / 2 | 1,627 | Sold 2026-05-18 | 0.55 mi |
| 8213 Arch Bay Lane | Sold | $560,000 | $269 | 3 / 2 | 2,082 | Sold 2026-06-15 | 0.55 mi |
| 2524 Sunset Beach Lane | Active | $656,000 | $274 | 3 / 2 | 2,393 | 159 days on market | 0.62 mi |
| 8109 Pacific Cove Drive | Sold | $510,000 | $220 | 3 / 2 | 2,316 | Sold 2026-07-21 | 0.63 mi |
| 8245 Arch Bay Lane | Sold | $575,000 | $299 | 3 / 2 | 1,925 | Sold 2026-06-04 | 0.64 mi |
| 2952 Cape Verde Lane | Active | $500,000 | $307 | 3 / 2 | 1,627 | 22 days on market | 0.67 mi |
| 8245 Aqua Spray Avenue | Under Contract | $515,000 | $253 | 3 / 2 | 2,033 | 87 days on market | 0.69 mi |
| 2528 Huber Heights Drive | Active | $509,000 | $281 | 3 / 2 | 1,814 | 48 days on market | 0.70 mi |
| 2324 Florissant Drive | Sold | $480,000 | $316 | 3 / 2 | 1,521 | Sold 2026-05-08 | 0.70 mi |


