
Comparable Sales Near 6117 Riverwalk Falls Street, North Las Vegas, NV 89031
1st Realty · Comparable sales report · 1st.estate · October 21, 2026
Read the North Las Vegas area guide →
6117 Riverwalk Falls Street, North Las Vegas, NV 89031
Status: Sold
$1,950 Sold Price
$1
$ / Sq Ft
1,759
Living Area
5,663 sqft
Lot Size
3
Beds
2
Baths
2010
Year Built
Search Parameters
Property Type
Status
Radius
Sold Within
Beds
Baths
Living Area (Sq Ft)
Lot Size (Sq Ft)
This comp search reflects your current search parameters — adjust the filters above as needed for a more accurate estimate.
Estimated Value
—
Average $/Sqft
—
Check one or more comps below to calculate an estimate.
Nearest 10 of 100 comparable sales and listings within 1 mile of this home. Use the filters above and press Search to refine.
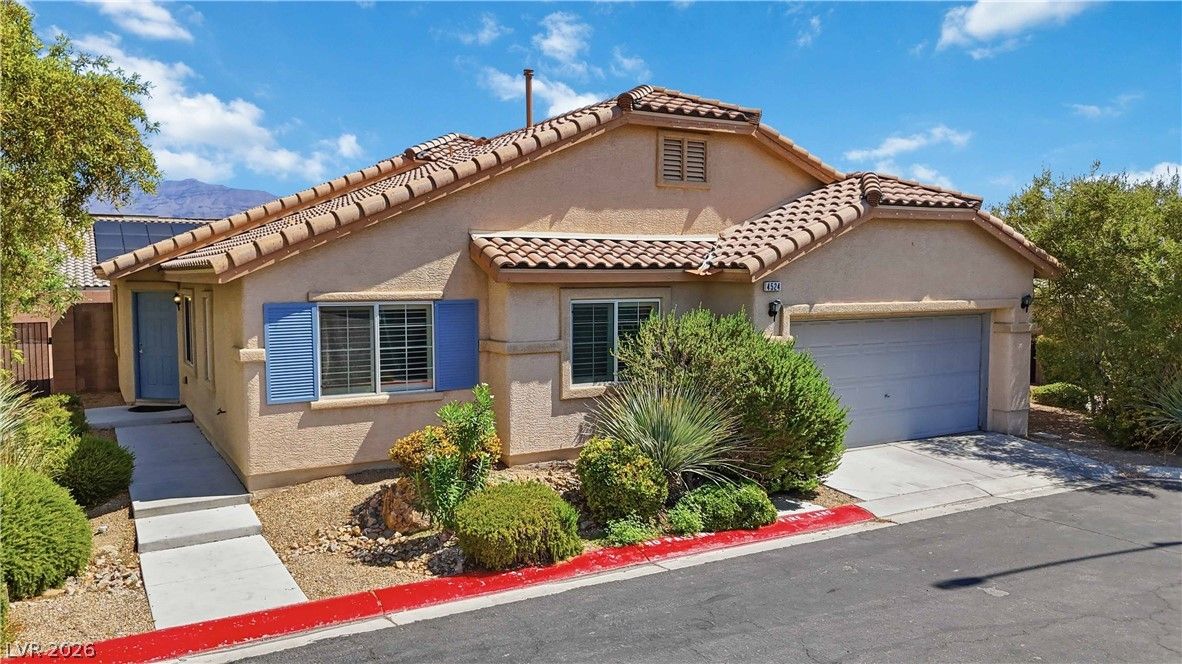
4524 Lower Deck CourtActive
$394,9994 bd2 ba1,628 sqft$243/sqft0.04 mi57 days
$425,0003 bd3 ba1,793 sqft$237/sqft0.14 mi28 daysSold 2026-07-01
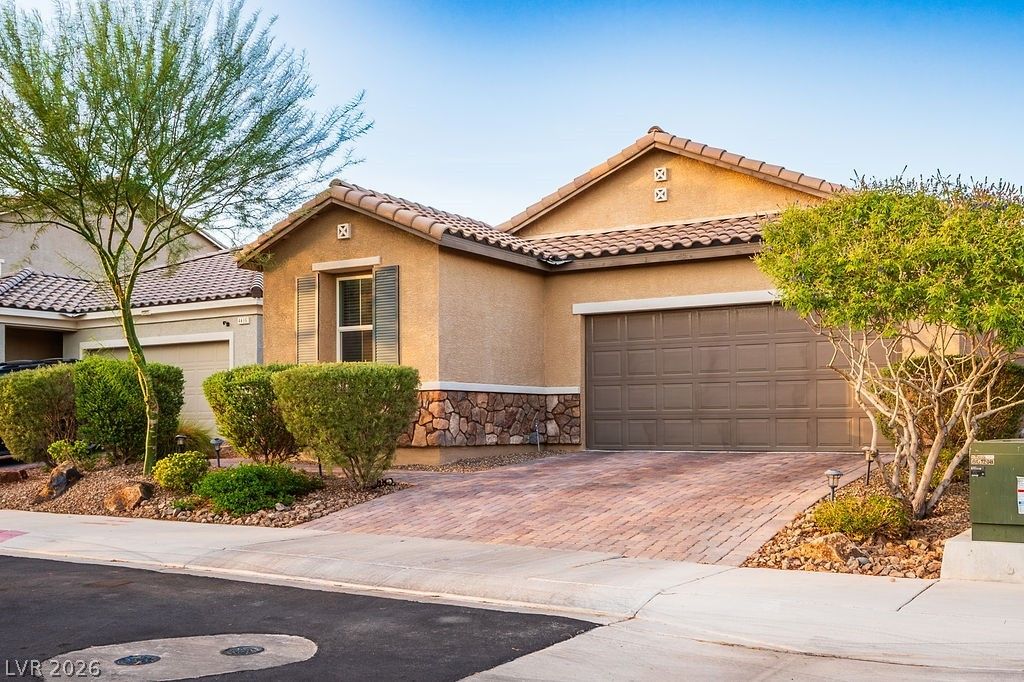
4482 Brasada Ranch CourtActive
$450,0003 bd3 ba1,845 sqft$244/sqft0.18 mi1 days

6221 Silver Bank StreetUnder Contract
$440,0003 bd3 ba1,867 sqft$236/sqft0.24 mi20 days
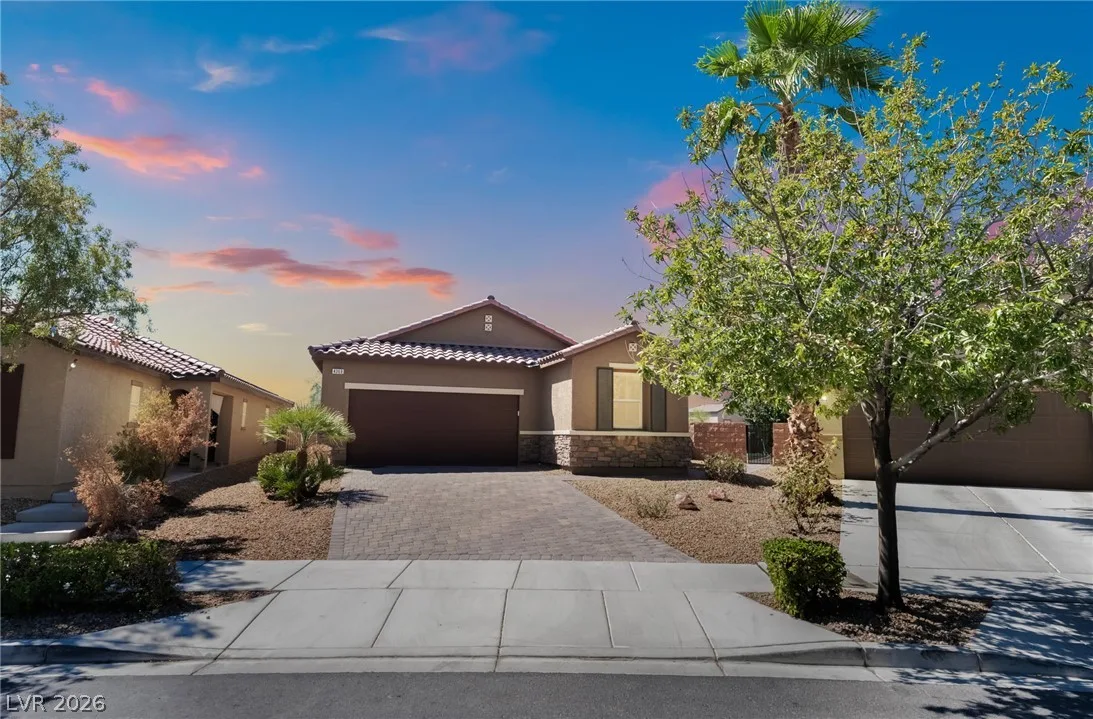
4369 Shady River AvenueActive
$519,9993 bd3 ba1,867 sqft$279/sqft0.26 mi15 days
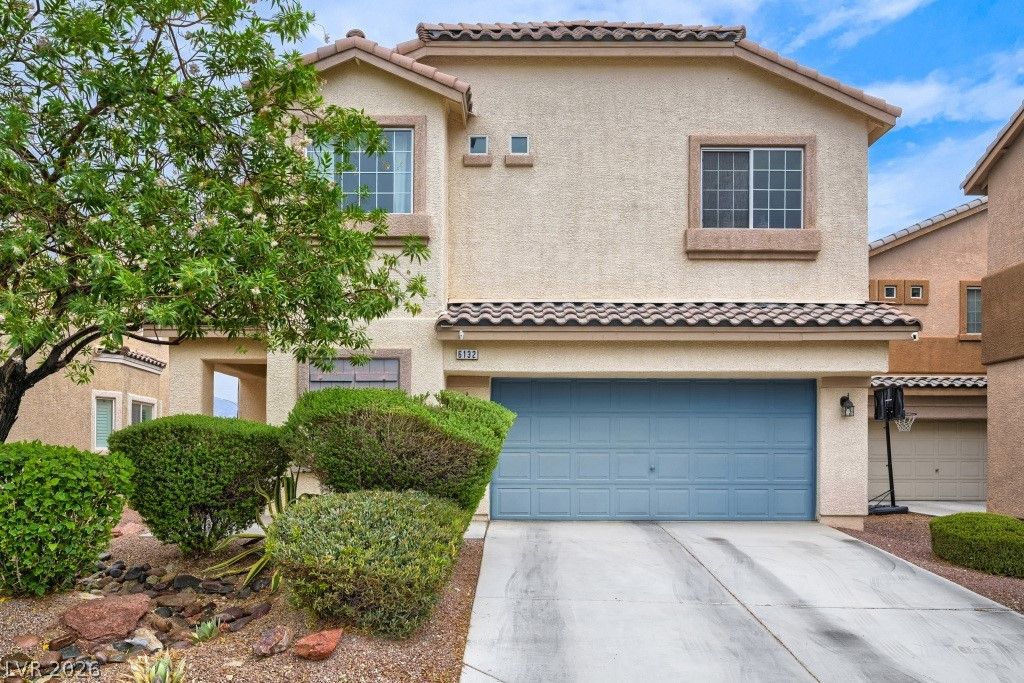
6132 Riverbelle StreetActive
$420,0003 bd3 ba1,793 sqft$234/sqft0.27 mi63 days
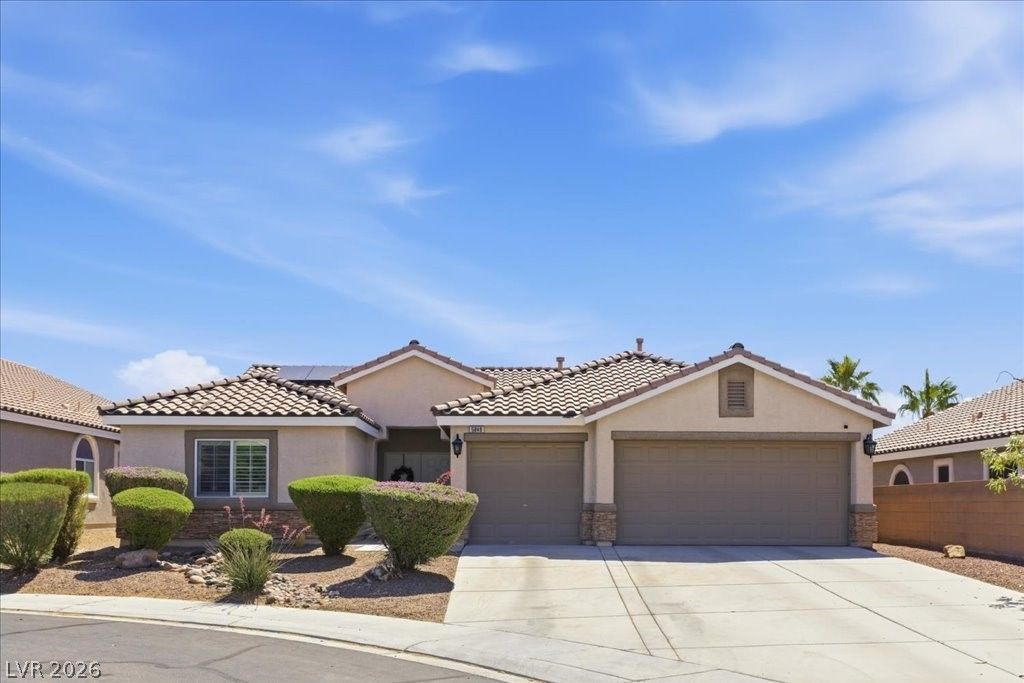
$600,0003 bd2 ba1,975 sqft$304/sqft0.32 mi48 daysSold 2026-08-06
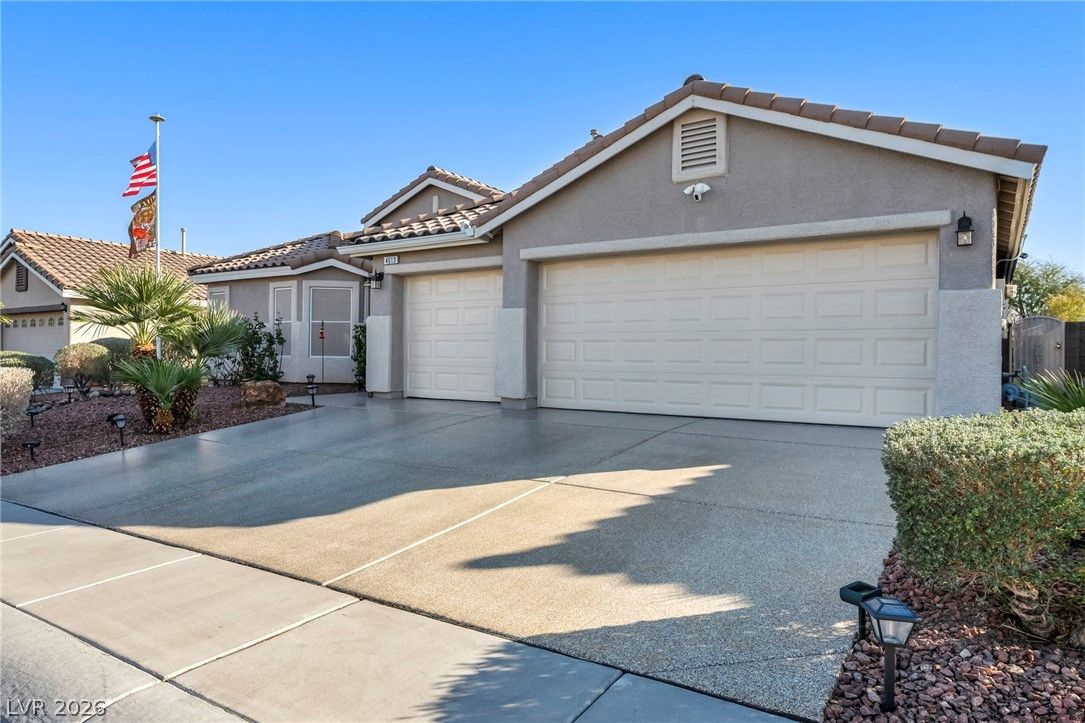
4613 Mohawk River AvenueActive
$570,0004 bd2 ba2,178 sqft$262/sqft0.41 mi54 days
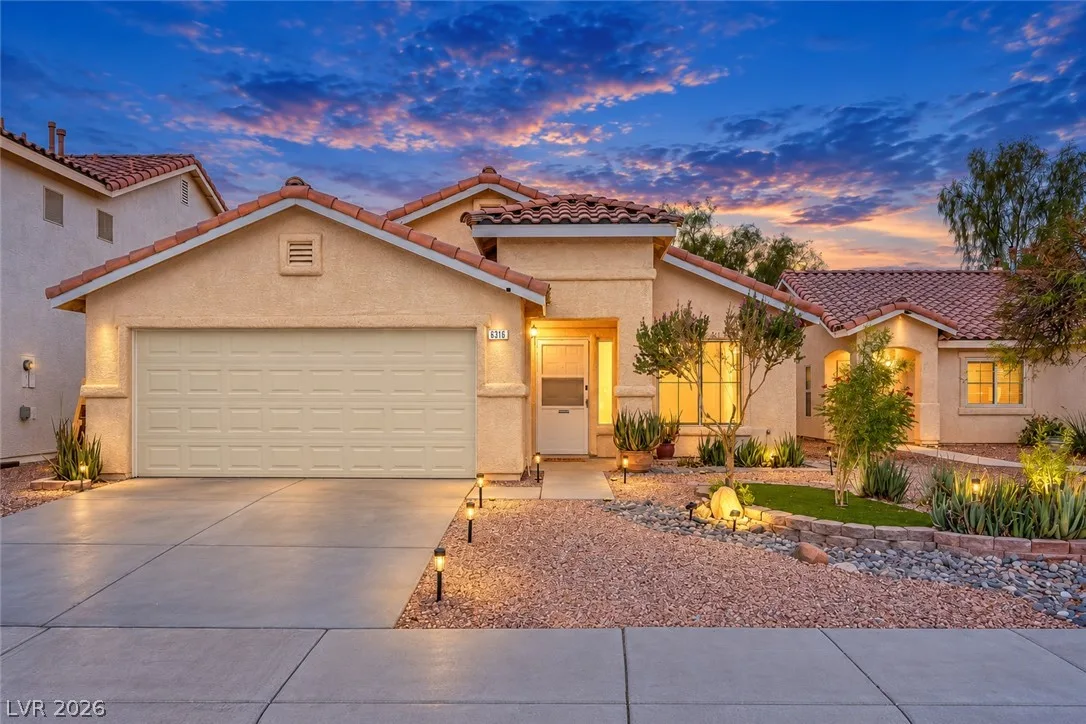
$438,8003 bd2 ba1,410 sqft$311/sqft0.41 mi2 days
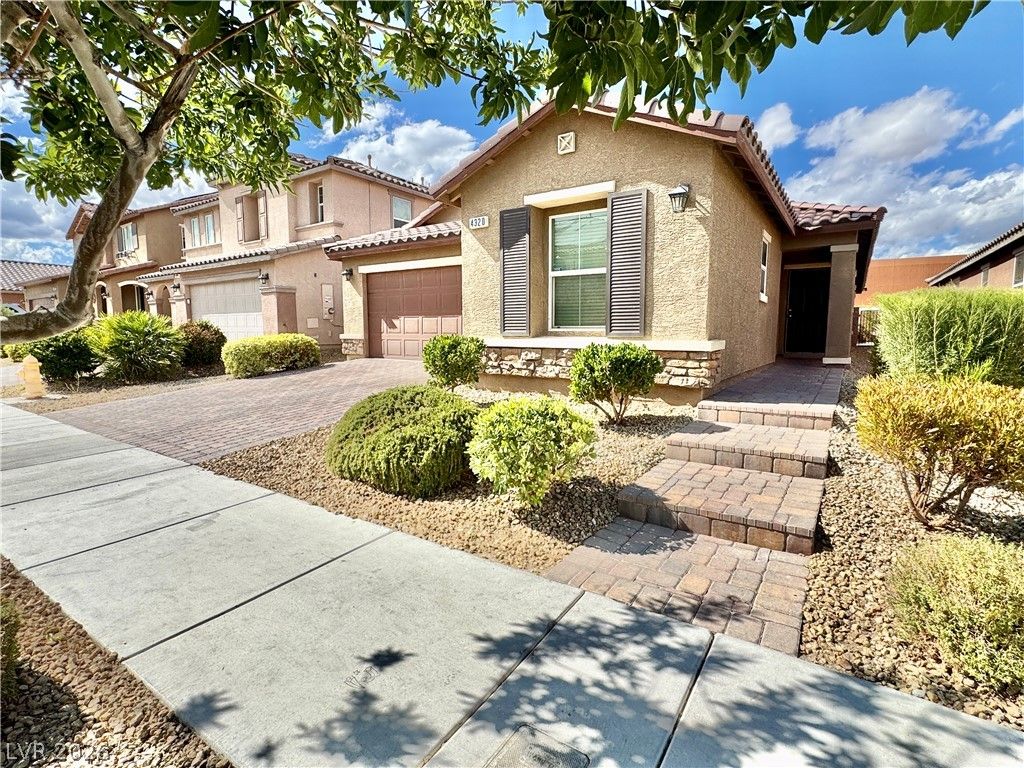
4320 Hatch Bend AvenueActive
$417,0003 bd2 ba1,867 sqft$223/sqft0.42 mi27 days
Nearest comparable sales and listings
12 comparables · median price $439,400 · range $394,999 – $600,000 · median $/sq ft $248 · average $/sq ft $259
| Address | Status | Price | $/Sq Ft | Bd / Ba | Sq Ft | Sold / market time | Distance |
|---|---|---|---|---|---|---|---|
| 4524 Lower Deck Court | Active | $394,999 | $243 | 4 / 2 | 1,628 | 57 days on market | 0.04 mi |
| 6053 Sea Cliff Cove Street | Sold | $425,000 | $237 | 3 / 3 | 1,793 | Sold 2026-07-01 | 0.14 mi |
| 4482 Brasada Ranch Court | Active | $450,000 | $244 | 3 / 3 | 1,845 | 1 days on market | 0.18 mi |
| 6221 Silver Bank Street | Under Contract | $440,000 | $236 | 3 / 3 | 1,867 | 20 days on market | 0.24 mi |
| 4369 Shady River Avenue | Active | $519,999 | $279 | 3 / 3 | 1,867 | 15 days on market | 0.26 mi |
| 6132 Riverbelle Street | Active | $420,000 | $234 | 3 / 3 | 1,793 | 63 days on market | 0.27 mi |
| 5848 Outraker Court | Sold | $600,000 | $304 | 3 / 2 | 1,975 | Sold 2026-08-06 | 0.32 mi |
| 4613 Mohawk River Avenue | Active | $570,000 | $262 | 4 / 2 | 2,178 | 54 days on market | 0.41 mi |
| 6316 Monarch Creek Street | Active | $438,800 | $311 | 3 / 2 | 1,410 | 2 days on market | 0.41 mi |
| 4320 Hatch Bend Avenue | Active | $417,000 | $223 | 3 / 2 | 1,867 | 27 days on market | 0.42 mi |
| 4209 Fairywren Drive | Active | $440,000 | $252 | 3 / 2 | 1,748 | 4 days on market | 0.43 mi |
| 6313 Monarch Creek Street | Sold | $407,000 | $289 | 3 / 2 | 1,410 | Sold 2026-06-25 | 0.44 mi |


