
Comparable Sales Near 5709 Compton Drive, Las Vegas, NV 89108
1st Realty · Comparable sales report · 1st.estate · October 20, 2026
Browse our Las Vegas area guides →
5709 Compton Drive, Las Vegas, NV 89108
Status: Sold
$418,000 Sold Price
$243
$ / Sq Ft
1,718
Living Area
6,970 sqft
Lot Size
3
Beds
2
Baths
1993
Year Built
Search Parameters
Property Type
Status
Radius
Sold Within
Beds
Baths
Living Area (Sq Ft)
Lot Size (Sq Ft)
This comp search reflects your current search parameters — adjust the filters above as needed for a more accurate estimate.
Estimated Value
—
Average $/Sqft
—
Check one or more comps below to calculate an estimate.
Nearest 10 of 50 comparable sales and listings within 1 mile of this home. Use the filters above and press Search to refine.
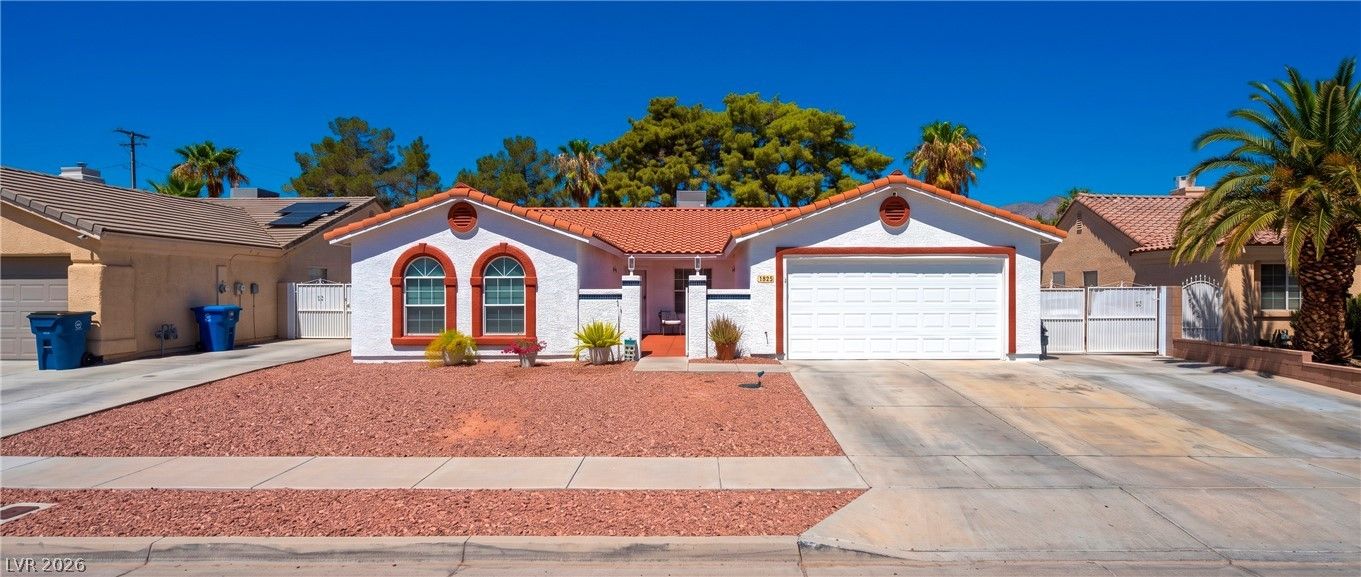
1825 Stonington PlacePending
$500,0004 bd3 ba2,148 sqft$233/sqft0.06 mi95 days
$340,0003 bd2 ba1,838 sqft$185/sqft0.07 mi104 daysSold 2026-04-30
$445,0003 bd2 ba1,314 sqft$339/sqft0.11 mi11 daysSold 2026-06-30
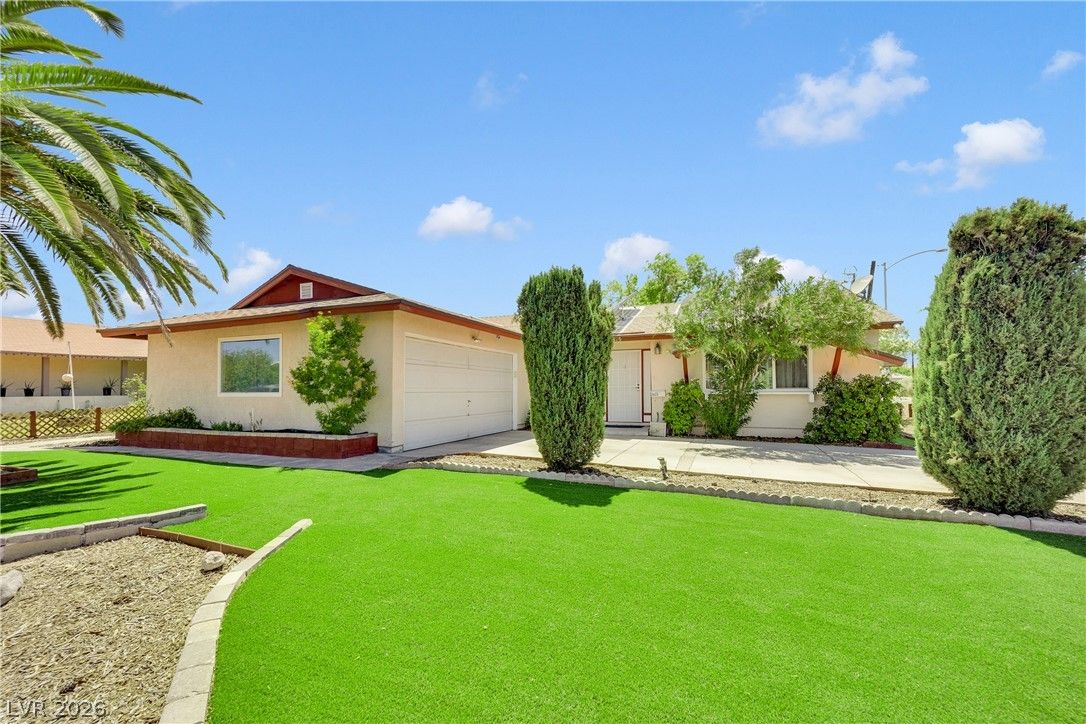
$380,0003 bd2 ba1,530 sqft$248/sqft0.14 mi65 daysSold 2026-10-15
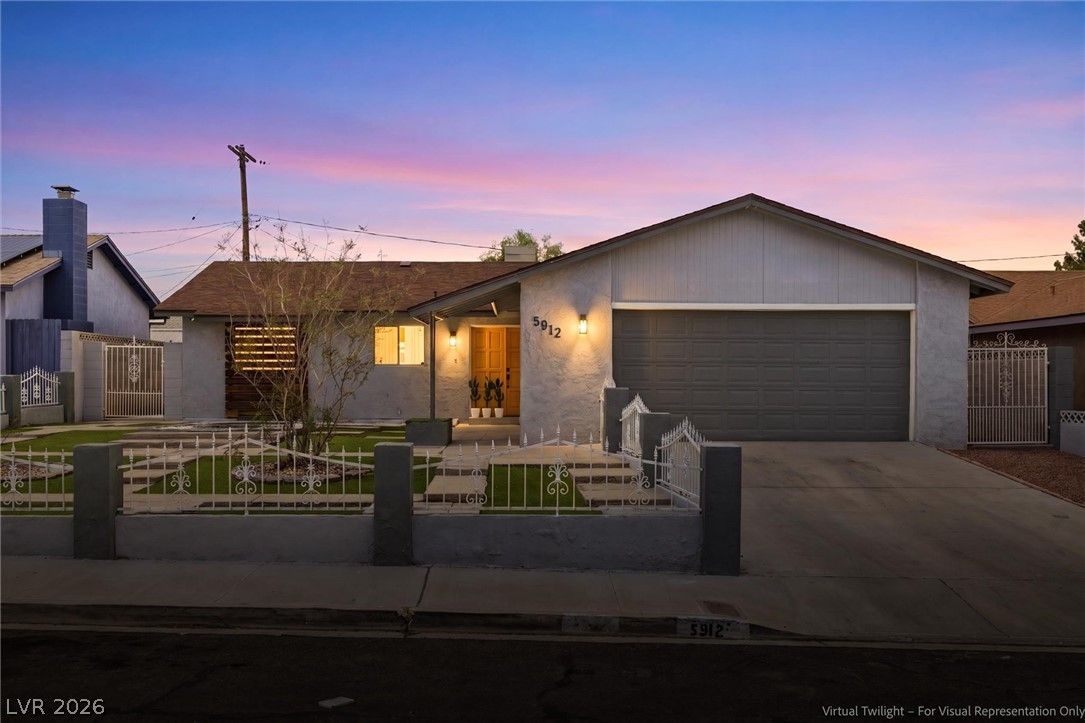
$379,0003 bd2 ba1,372 sqft$276/sqft0.23 mi68 daysSold 2026-10-06
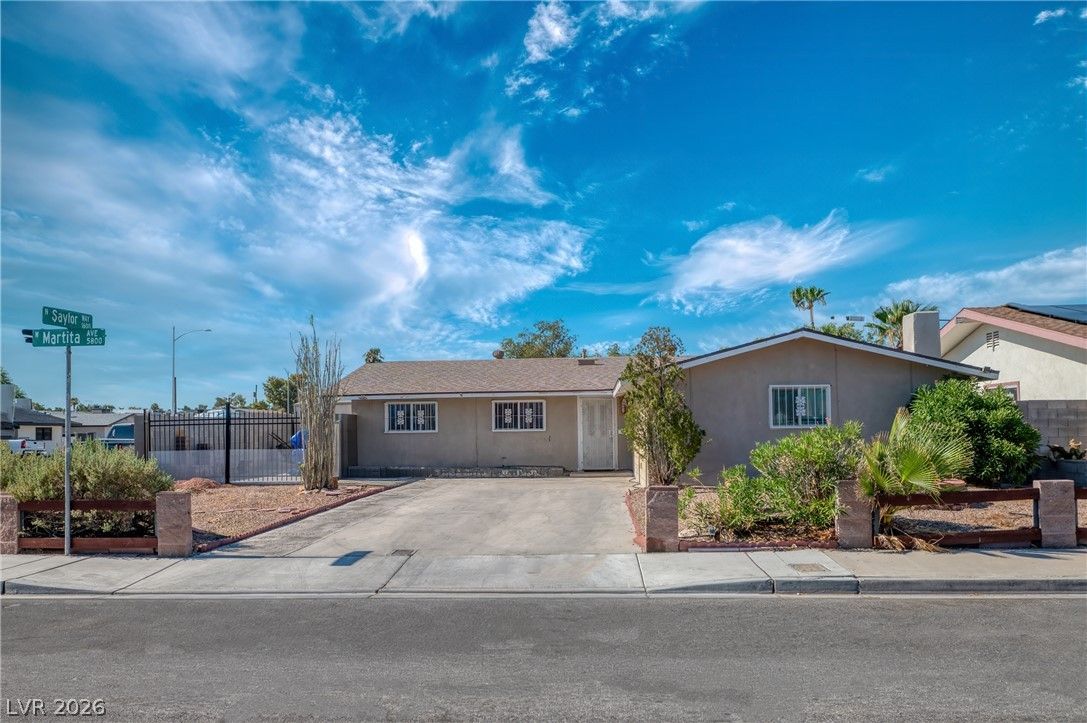
$417,9004 bd2 ba1,833 sqft$228/sqft0.26 mi8 daysSold 2026-09-09
$380,0004 bd3 ba1,652 sqft$230/sqft0.31 mi20 daysSold 2026-07-20

1528 Saylor WayActive
$409,0003 bd2 ba1,683 sqft$243/sqft0.32 mi61 days
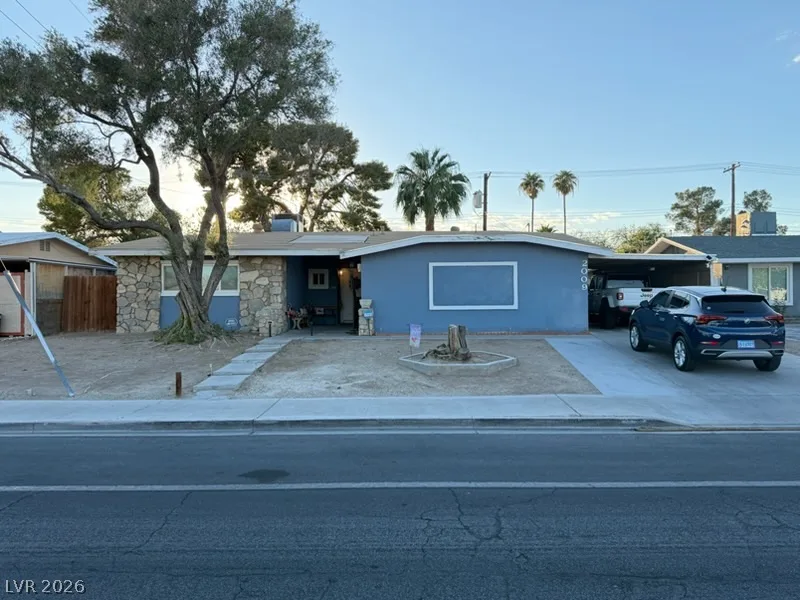
2009 North Michael WayActive
$400,0003 bd2 ba1,894 sqft$211/sqft0.32 mi8 days
$350,0003 bd2 ba1,874 sqft$187/sqft0.32 mi29 daysSold 2026-05-05
Nearest comparable sales and listings
12 comparables · median price $404,500 · range $340,000 – $500,000 · median $/sq ft $231 · average $/sq ft $237
| Address | Status | Price | $/Sq Ft | Bd / Ba | Sq Ft | Sold / market time | Distance |
|---|---|---|---|---|---|---|---|
| 1825 Stonington Place | Pending | $500,000 | $233 | 4 / 3 | 2,148 | 95 days on market | 0.06 mi |
| 5712 Pinecone Place | Sold | $340,000 | $185 | 3 / 2 | 1,838 | Sold 2026-04-30 | 0.07 mi |
| 1809 Wildwood Drive | Sold | $445,000 | $339 | 3 / 2 | 1,314 | Sold 2026-06-30 | 0.11 mi |
| 1825 Shadow Mountain Place | Sold | $380,000 | $248 | 3 / 2 | 1,530 | Sold 2026-10-15 | 0.14 mi |
| 5912 Velma Avenue | Sold | $379,000 | $276 | 3 / 2 | 1,372 | Sold 2026-10-06 | 0.23 mi |
| 5801 Martita Avenue | Sold | $417,900 | $228 | 4 / 2 | 1,833 | Sold 2026-09-09 | 0.26 mi |
| 1801 Palo Alto Circle | Sold | $380,000 | $230 | 4 / 3 | 1,652 | Sold 2026-07-20 | 0.31 mi |
| 1528 Saylor Way | Active | $409,000 | $243 | 3 / 2 | 1,683 | 61 days on market | 0.32 mi |
| 2009 North Michael Way | Active | $400,000 | $211 | 3 / 2 | 1,894 | 8 days on market | 0.32 mi |
| 5917 Martita Avenue | Sold | $350,000 | $187 | 3 / 2 | 1,874 | Sold 2026-05-05 | 0.32 mi |
| 1617 North Mallard Street | Sold | $429,000 | $229 | 4 / 2 | 1,874 | Sold 2026-06-03 | 0.33 mi |
| 5809 Pebble Beach Boulevard | Sold | $420,000 | $237 | 4 / 2 | 1,775 | Sold 2026-05-15 | 0.38 mi |


