
Comparable Sales Near 3813 Lower Saxon Avenue, North Las Vegas, NV 89085
1st Realty · Comparable sales report · 1st.estate · October 20, 2026
Read the North Las Vegas area guide →
3813 Lower Saxon Avenue, North Las Vegas, NV 89085
Status: Sold
$520,000 Sold Price
$208
$ / Sq Ft
2,505
Living Area
5,227 sqft
Lot Size
4
Beds
4
Baths
2006
Year Built
Search Parameters
Property Type
Status
Radius
Sold Within
Beds
Baths
Living Area (Sq Ft)
Lot Size (Sq Ft)
This comp search reflects your current search parameters — adjust the filters above as needed for a more accurate estimate.
Estimated Value
—
Average $/Sqft
—
Check one or more comps below to calculate an estimate.
Nearest 10 of 46 comparable sales and listings within 1 mile of this home. Use the filters above and press Search to refine.
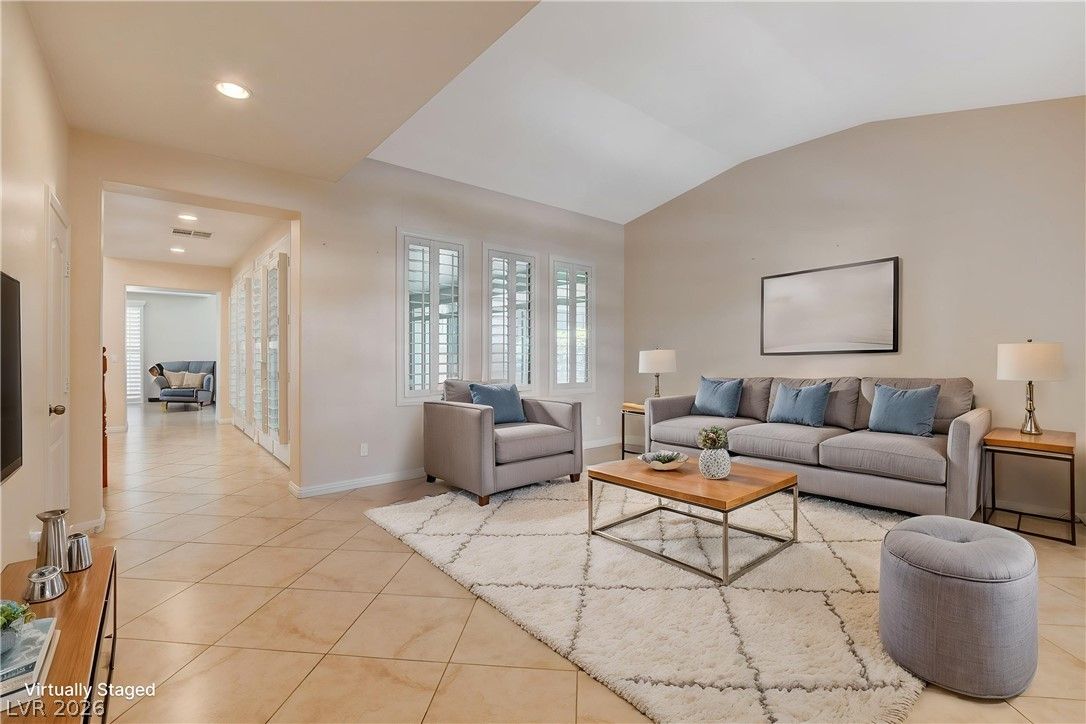
$507,0004 bd3 ba2,821 sqft$180/sqft0.05 mi13 daysSold 2026-10-15
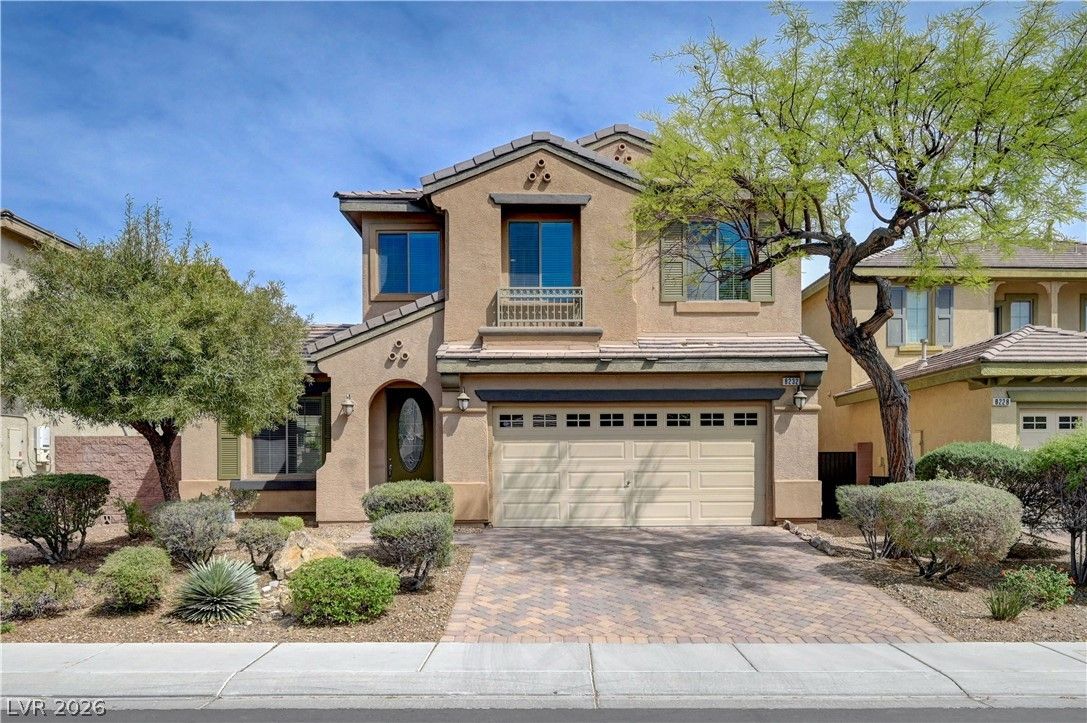
$482,0003 bd3 ba2,821 sqft$171/sqft0.06 mi17 daysSold 2026-08-18
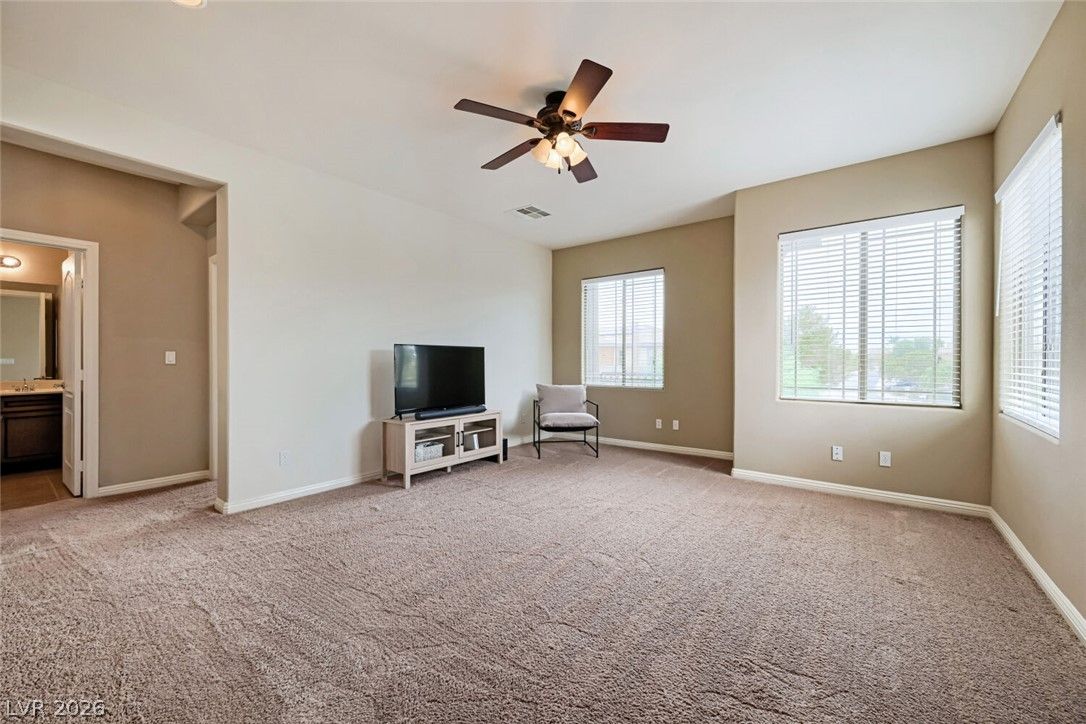
$535,0003 bd3 ba2,821 sqft$190/sqft0.08 mi3 daysSold 2026-09-30
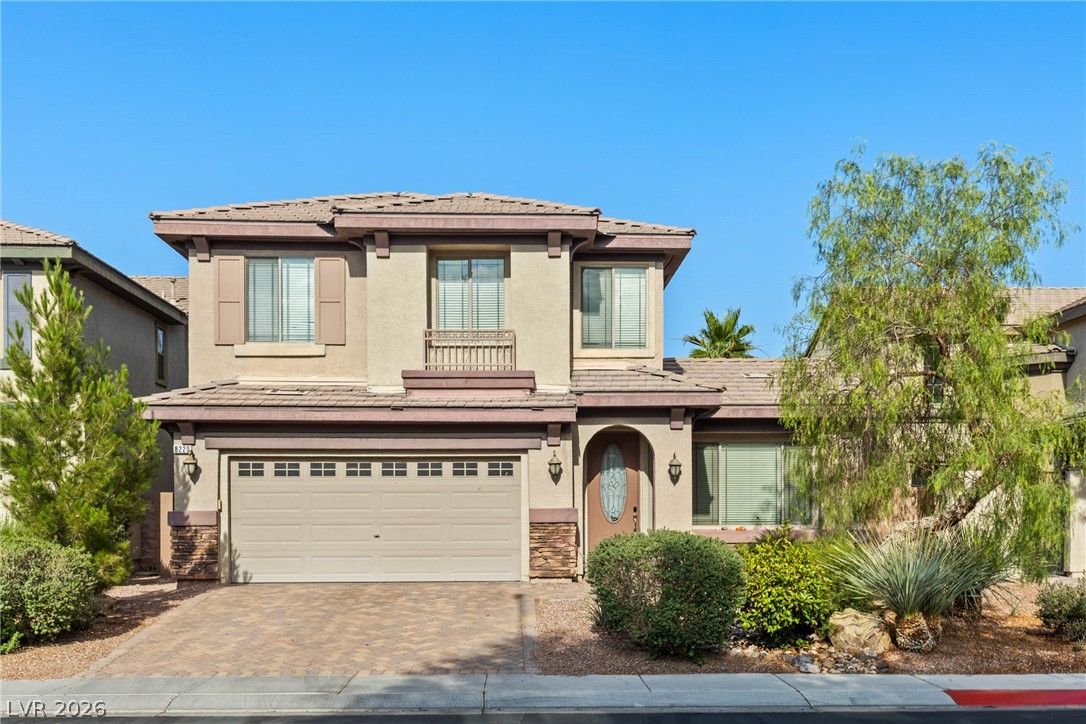
$501,0004 bd3 ba2,821 sqft$178/sqft0.09 mi13 daysSold 2026-08-20
$515,0004 bd3 ba2,821 sqft$183/sqft0.10 mi37 daysSold 2026-05-29

$540,0003 bd3 ba2,505 sqft$216/sqft0.11 mi41 days

3829 Hawkeye Falls AvenueUnder Contract
$545,0004 bd4 ba2,505 sqft$218/sqft0.15 mi27 days
$549,0004 bd4 ba2,972 sqft$185/sqft0.24 mi19 daysSold 2026-05-12
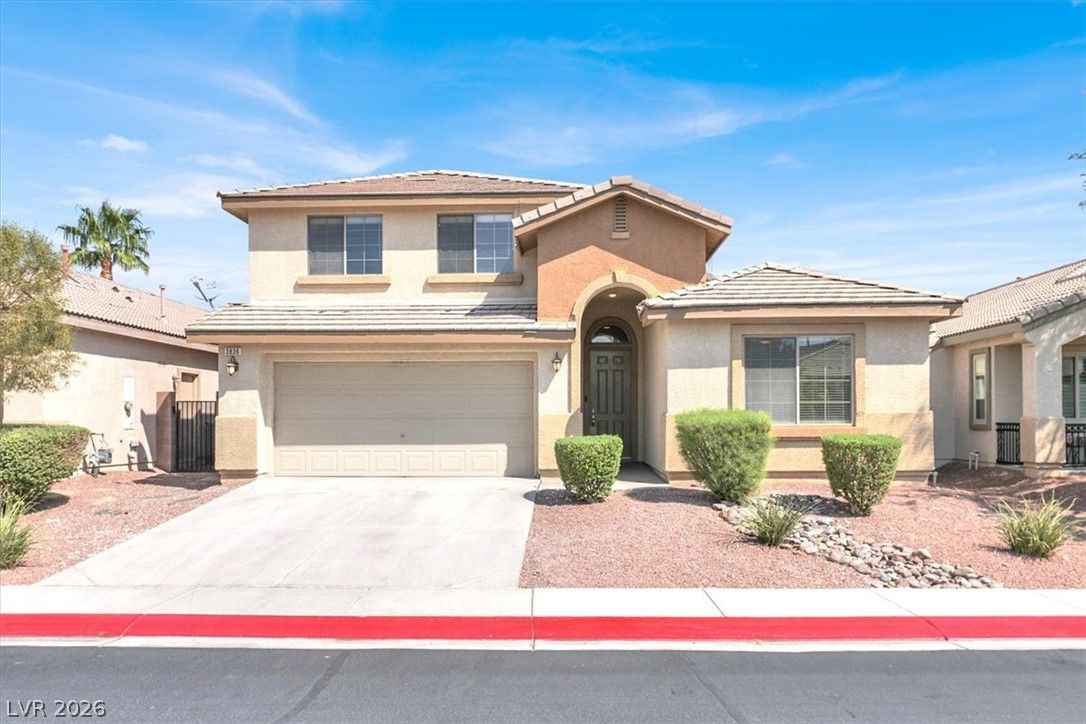
$485,0003 bd3 ba2,378 sqft$204/sqft0.37 mi20 days
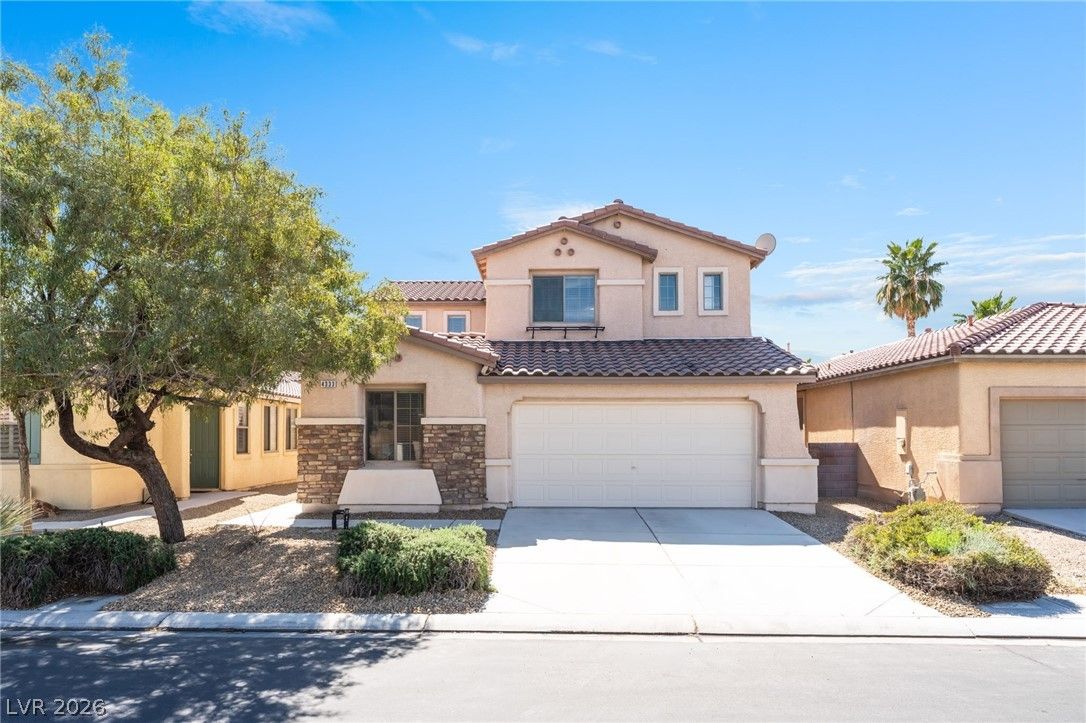
$480,0004 bd3 ba2,495 sqft$192/sqft0.48 mi139 daysSold 2026-07-31
Nearest comparable sales and listings
12 comparables · median price $504,000 · range $465,000 – $549,000 · median $/sq ft $191 · average $/sq ft $194
| Address | Status | Price | $/Sq Ft | Bd / Ba | Sq Ft | Sold / market time | Distance |
|---|---|---|---|---|---|---|---|
| 3809 Moonshine Falls Avenue | Sold | $507,000 | $180 | 4 / 3 | 2,821 | Sold 2026-10-15 | 0.05 mi |
| 8232 Chimney Bluffs Street | Sold | $482,000 | $171 | 3 / 3 | 2,821 | Sold 2026-08-18 | 0.06 mi |
| 8304 Seven Falls Street | Sold | $535,000 | $190 | 3 / 3 | 2,821 | Sold 2026-09-30 | 0.08 mi |
| 8220 Chimney Bluffs Street | Sold | $501,000 | $178 | 4 / 3 | 2,821 | Sold 2026-08-20 | 0.09 mi |
| 3912 Kettle Falls Avenue | Sold | $515,000 | $183 | 4 / 3 | 2,821 | Sold 2026-05-29 | 0.10 mi |
| 8212 Chimney Bluffs Street | Active | $540,000 | $216 | 3 / 3 | 2,505 | 41 days on market | 0.11 mi |
| 3829 Hawkeye Falls Avenue | Under Contract | $545,000 | $218 | 4 / 4 | 2,505 | 27 days on market | 0.15 mi |
| 8229 Fishtrap Hollow Street | Sold | $549,000 | $185 | 4 / 4 | 2,972 | Sold 2026-05-12 | 0.24 mi |
| 3836 Bowers Hollow Avenue | Active | $485,000 | $204 | 3 / 3 | 2,378 | 20 days on market | 0.37 mi |
| 4333 Desert Haven Avenue | Sold | $480,000 | $192 | 4 / 3 | 2,495 | Sold 2026-07-31 | 0.48 mi |
| 4336 Desert Haven Avenue | Under Contract | $485,000 | $194 | 4 / 4 | 2,495 | 114 days on market | 0.49 mi |
| 3823 Berenices Avenue | Sold | $465,000 | $219 | 4 / 3 | 2,127 | Sold 2026-08-19 | 0.51 mi |


