
Comparable Sales Near 10729 CHILLINGHAM Drive, Las Vegas, NV 89183
1st Realty · Comparable sales report · 1st.estate · October 20, 2026
Read the Silverado Ranch neighborhood guide →
10729 CHILLINGHAM Drive, Las Vegas, NV 89183
Status: Sold
$1,000,000 Sold Price
$238
$ / Sq Ft
4,197
Living Area
22,216 sqft
Lot Size
5
Beds
4
Baths
1999
Year Built
Search Parameters
Property Type
Status
Radius
Sold Within
Beds
Baths
Living Area (Sq Ft)
Lot Size (Sq Ft)
This comp search reflects your current search parameters — adjust the filters above as needed for a more accurate estimate.
Estimated Value
—
Average $/Sqft
—
Check one or more comps below to calculate an estimate.
Nearest 10 of 11 comparable sales and listings within 1 mile of this home. Use the filters above and press Search to refine.
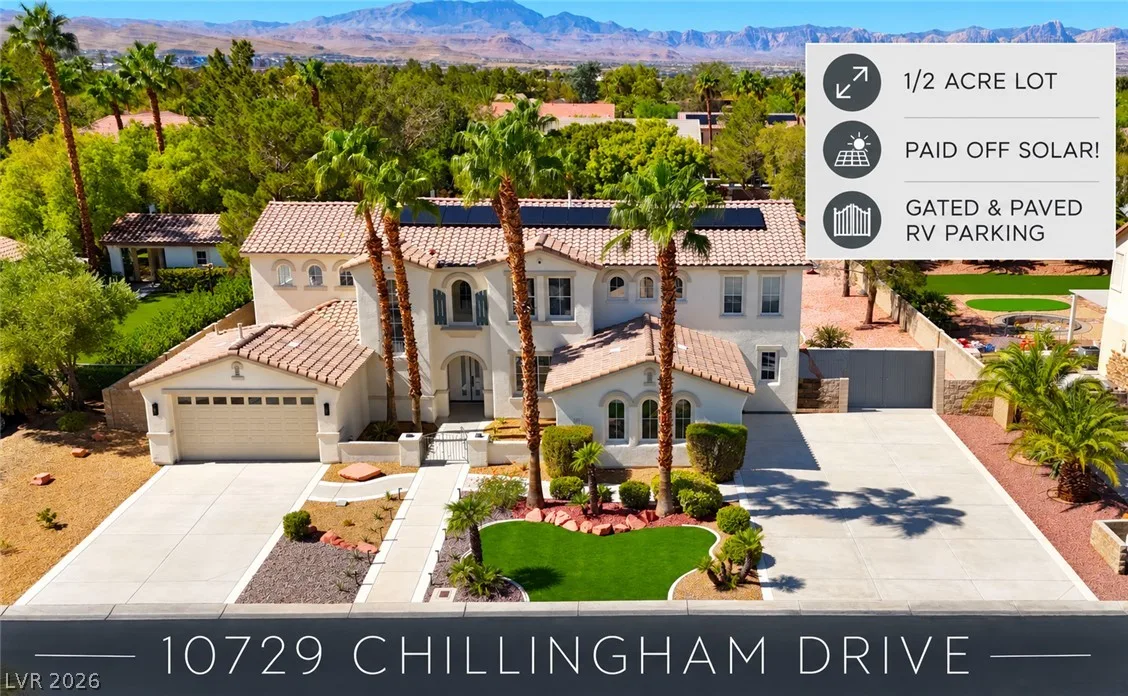
10729 Chillingham DriveActive
$1,374,9994 bd4 ba4,197 sqft$328/sqft0.00 mi7 days
$950,0005 bd4 ba3,877 sqft$245/sqft0.08 mi35 daysSold 2026-06-30
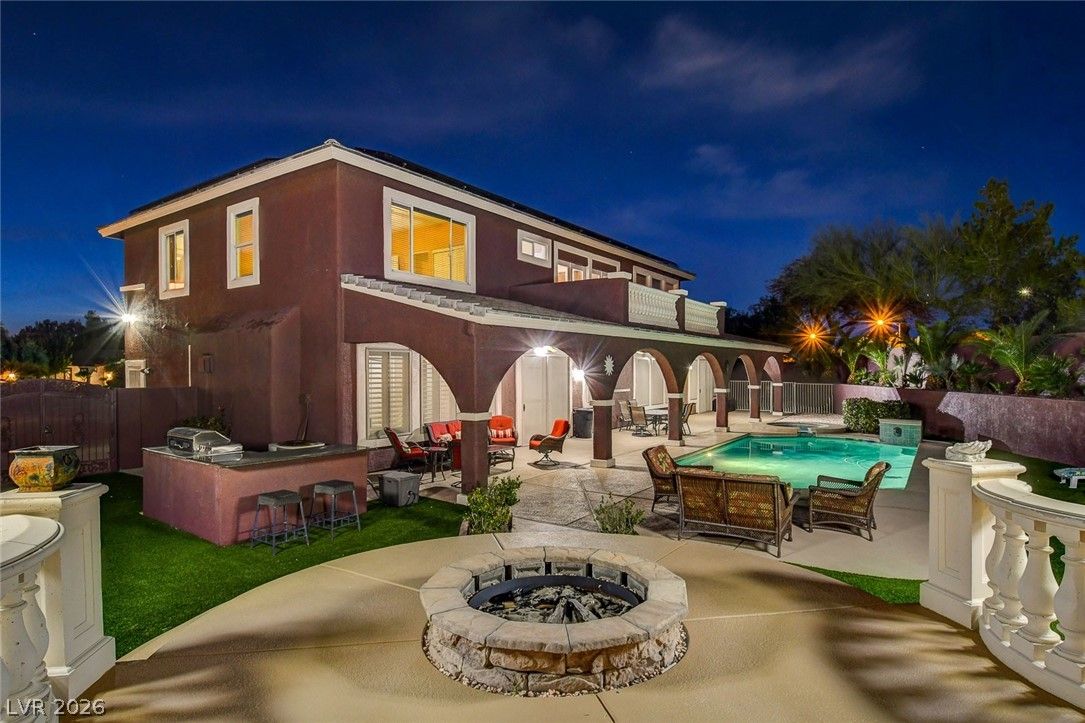
10798 Chillingham DriveActive
$975,0004 bd4 ba3,877 sqft$251/sqft0.11 mi141 days
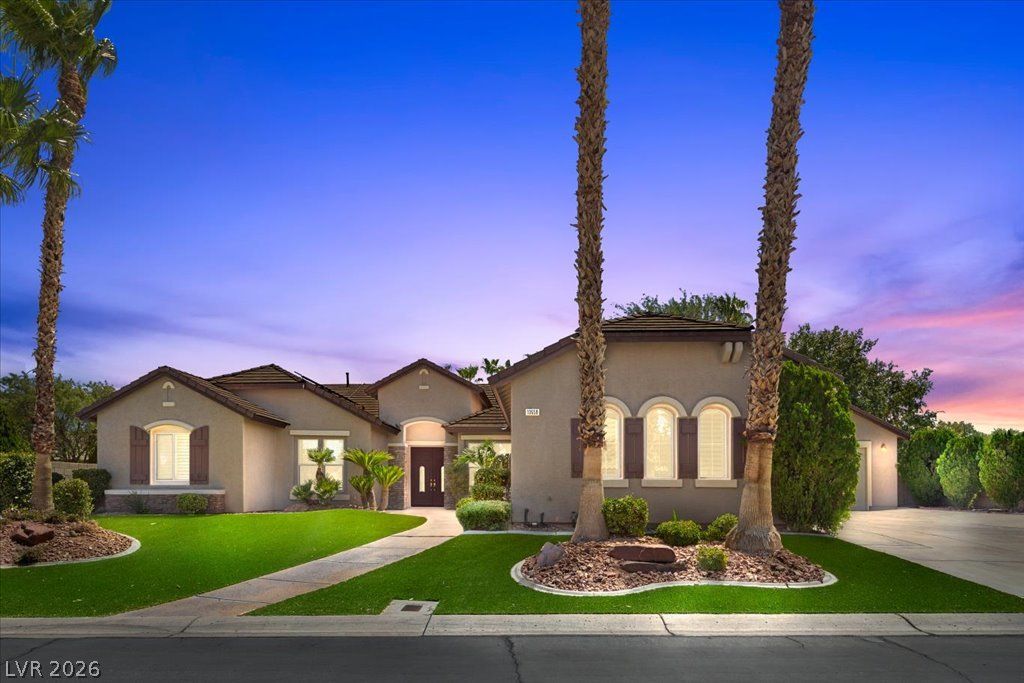
10658 Callington WayActive
$1,150,0004 bd5 ba3,788 sqft$304/sqft0.13 mi72 days
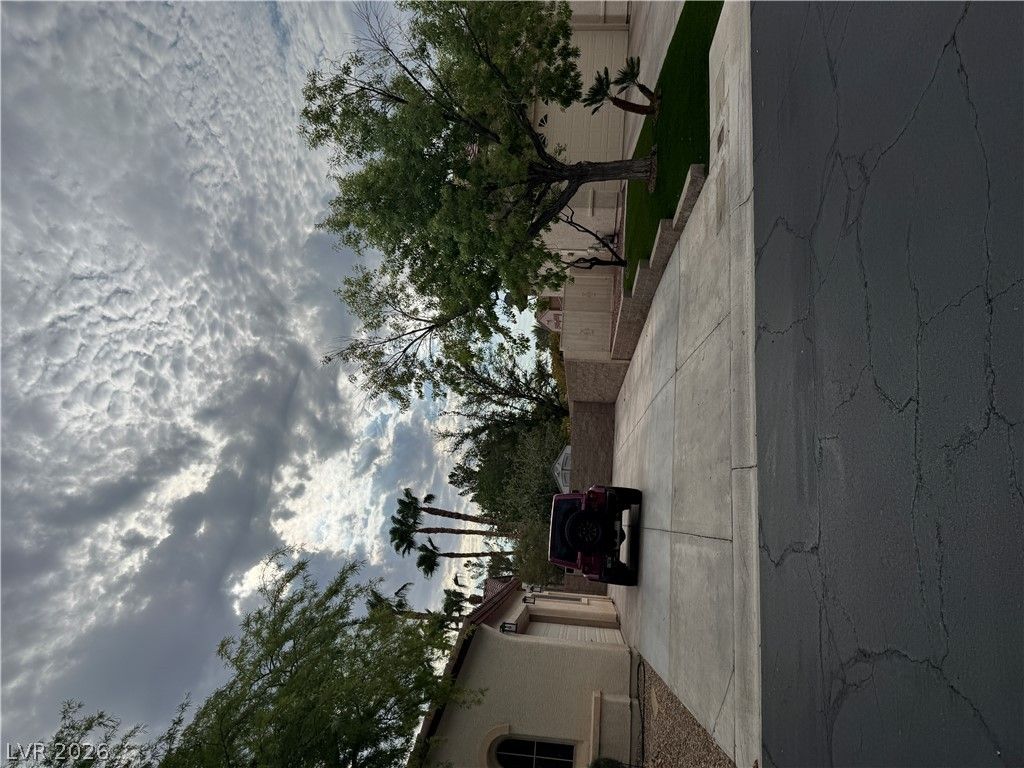
10610 Fairfield AvenueActive
$1,599,0004 bd4 ba3,574 sqft$447/sqft0.13 mi8 days
$1,485,0004 bd4 ba3,409 sqft$436/sqft0.23 mi47 daysSold 2026-06-09
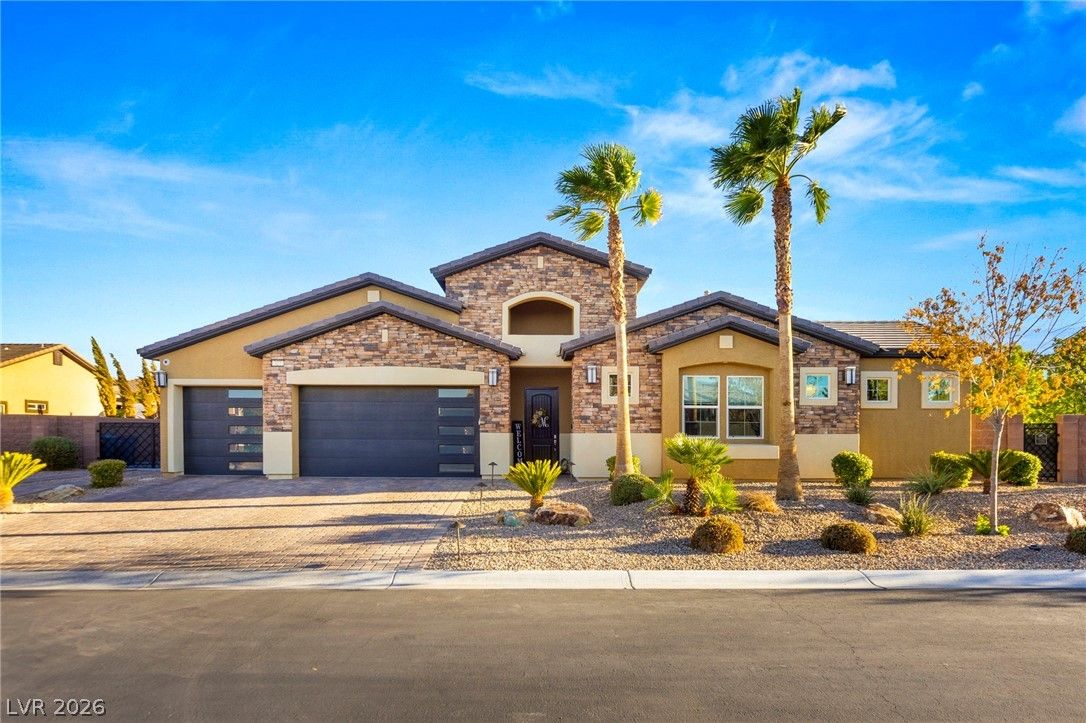
327 Castle Wynd AvenueActive
$1,599,9004 bd4 ba3,686 sqft$434/sqft0.37 mi31 days
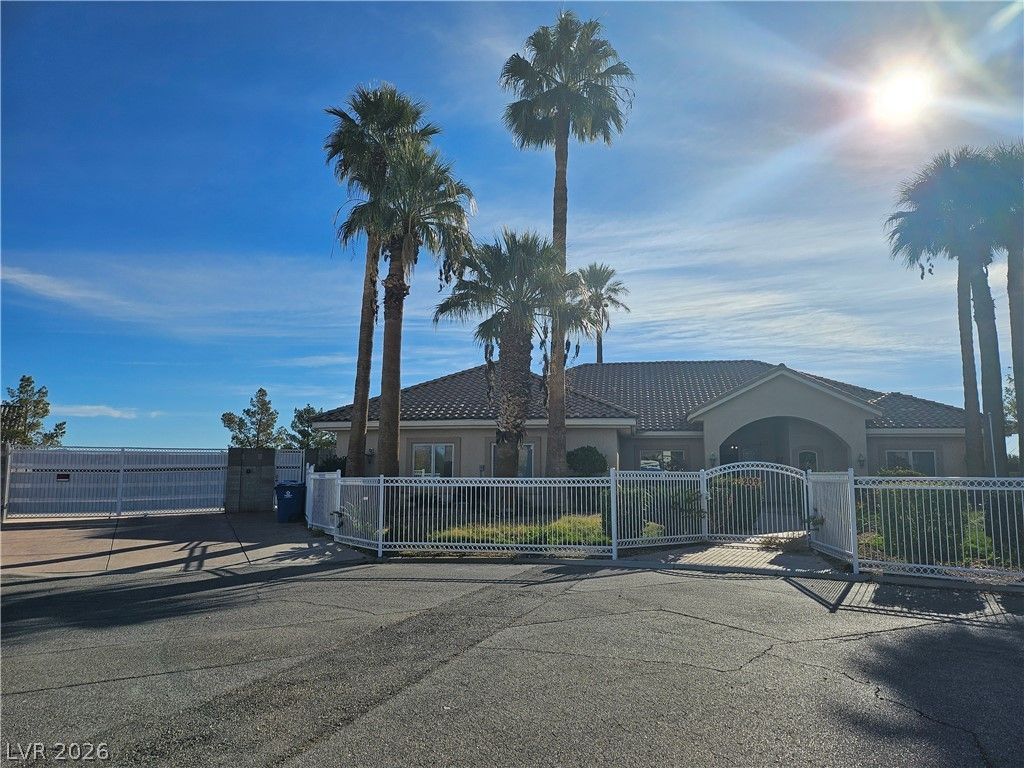
209 Irvin AvenueActive
$948,5004 bd4 ba3,239 sqft$293/sqft0.41 mi18 days
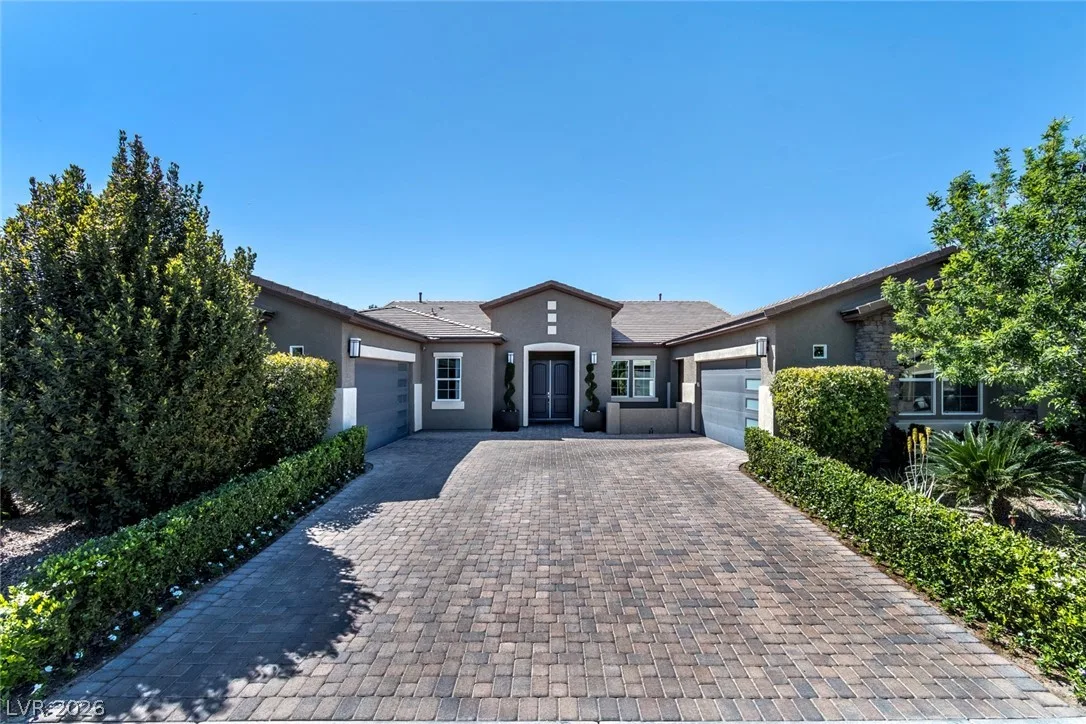
325 Greyjoy StreetActive
$2,199,9994 bd5 ba4,559 sqft$483/sqft0.43 mi6 days
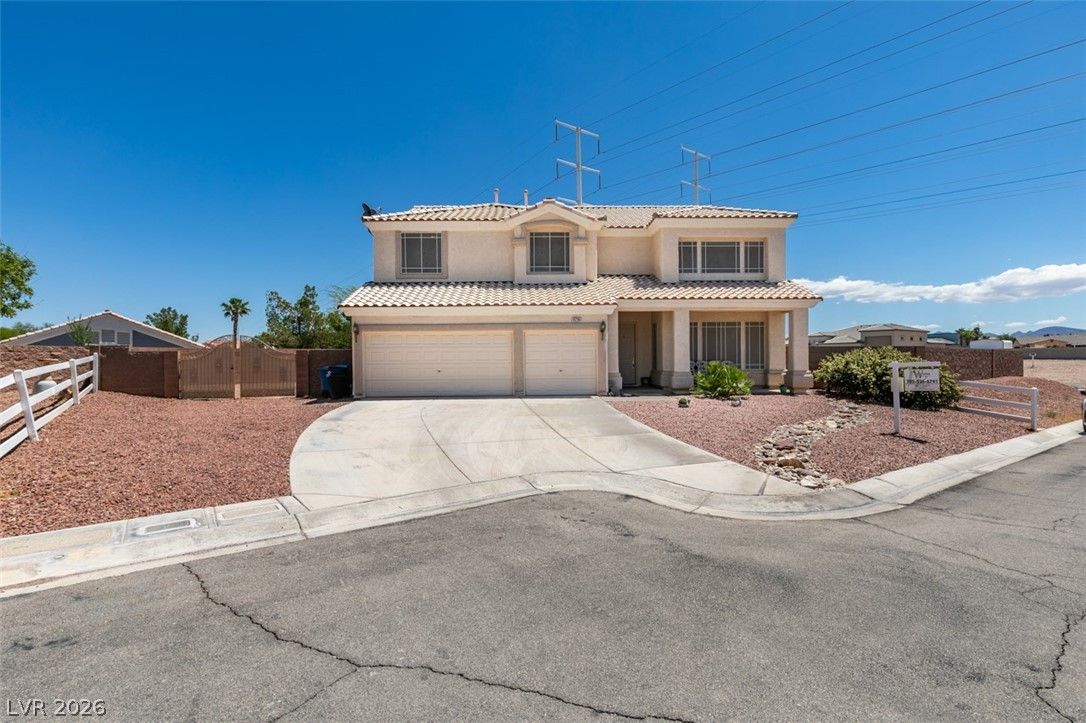
$988,8886 bd4 ba3,822 sqft$259/sqft0.61 mi0 days
Nearest comparable sales and listings
11 comparables · median price $1,265,000 · range $948,500 – $2,199,999 · median $/sq ft $328 · average $/sq ft $348
| Address | Status | Price | $/Sq Ft | Bd / Ba | Sq Ft | Sold / market time | Distance |
|---|---|---|---|---|---|---|---|
| 10729 Chillingham Drive | Active | $1,374,999 | $328 | 4 / 4 | 4,197 | 7 days on market | 0.00 mi |
| 10658 Chillingham Drive | Sold | $950,000 | $245 | 5 / 4 | 3,877 | Sold 2026-06-30 | 0.08 mi |
| 10798 Chillingham Drive | Active | $975,000 | $251 | 4 / 4 | 3,877 | 141 days on market | 0.11 mi |
| 10658 Callington Way | Active | $1,150,000 | $304 | 4 / 5 | 3,788 | 72 days on market | 0.13 mi |
| 10610 Fairfield Avenue | Active | $1,599,000 | $447 | 4 / 4 | 3,574 | 8 days on market | 0.13 mi |
| 360 Hedgehope Drive | Sold | $1,485,000 | $436 | 4 / 4 | 3,409 | Sold 2026-06-09 | 0.23 mi |
| 327 Castle Wynd Avenue | Active | $1,599,900 | $434 | 4 / 4 | 3,686 | 31 days on market | 0.37 mi |
| 209 Irvin Avenue | Active | $948,500 | $293 | 4 / 4 | 3,239 | 18 days on market | 0.41 mi |
| 325 Greyjoy Street | Active | $2,199,999 | $483 | 4 / 5 | 4,559 | 6 days on market | 0.43 mi |
| 10290 Marion Morrison Court | Active | $988,888 | $259 | 6 / 4 | 3,822 | 0 days on market | 0.61 mi |
| 164 Glenbrook Estates Drive | Active | $1,265,000 | $347 | 5 / 4 | 3,648 | 20 days on market | 0.68 mi |


