
Comparable Sales Near 716 Langtry Drive, Las Vegas, NV 89107
1st Realty · Comparable sales report · 1st.estate · October 20, 2026
Browse our Las Vegas area guides →
716 Langtry Drive, Las Vegas, NV 89107
Status: Sold
$420,000 Sold Price
$220
$ / Sq Ft
1,910
Living Area
7,841 sqft
Lot Size
4
Beds
2
Baths
1966
Year Built
Search Parameters
Property Type
Status
Radius
Sold Within
Beds
Baths
Living Area (Sq Ft)
Lot Size (Sq Ft)
This comp search reflects your current search parameters — adjust the filters above as needed for a more accurate estimate.
Estimated Value
—
Average $/Sqft
—
Check one or more comps below to calculate an estimate.
Nearest 10 of 29 comparable sales and listings within 1 mile of this home. Use the filters above and press Search to refine.
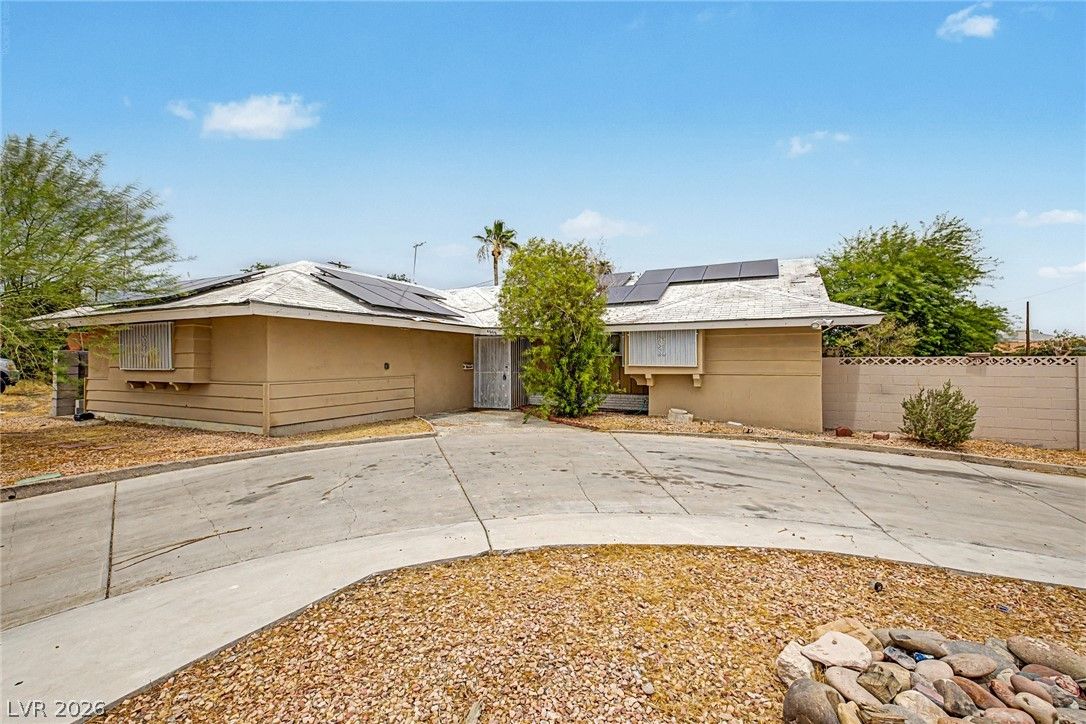
4000 Fortune AvenueActive
$420,0005 bd3 ba2,265 sqft$185/sqft0.07 mi97 days
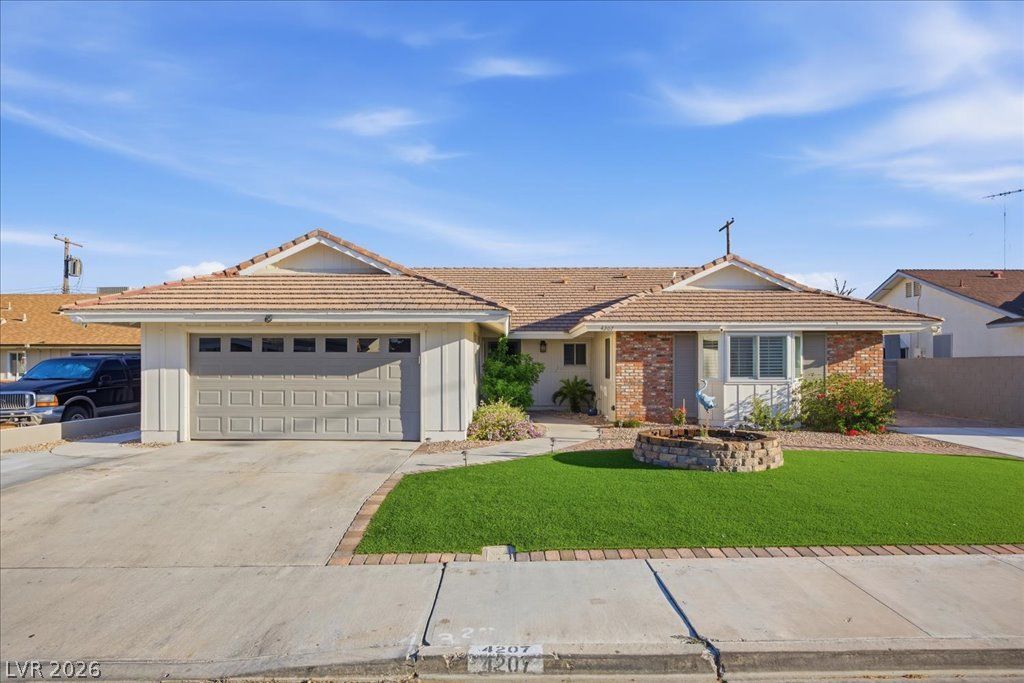
4207 Snead DriveSold
$480,0004 bd3 ba2,055 sqft$234/sqft0.15 mi59 daysSold 2026-09-10
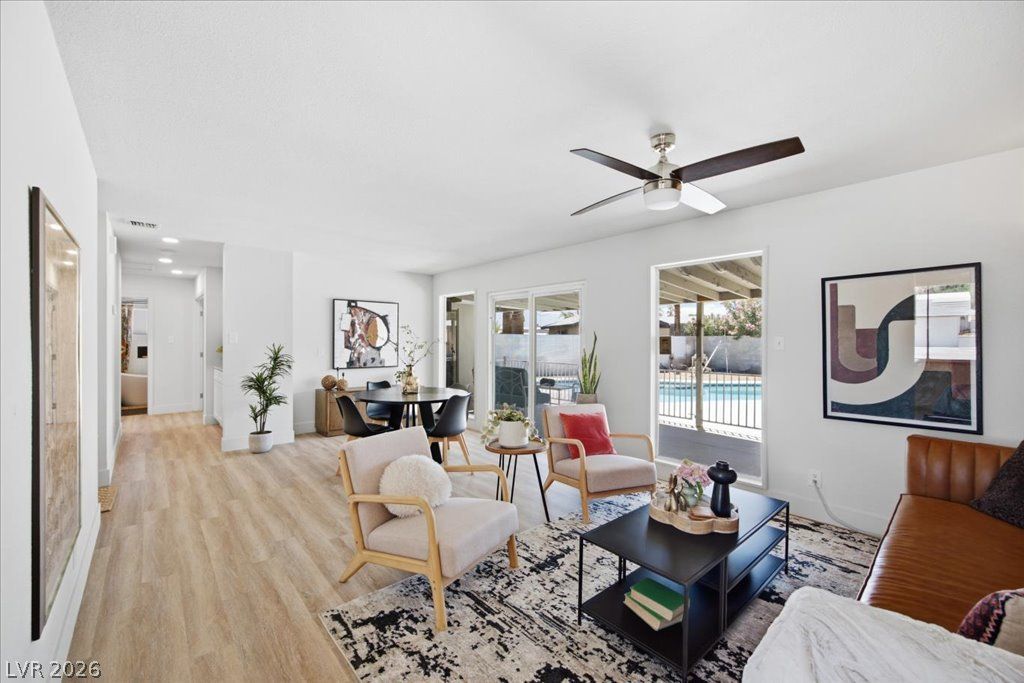
3605 Apache LaneUnder Contract
$445,0003 bd2 ba1,600 sqft$278/sqft0.18 mi48 days
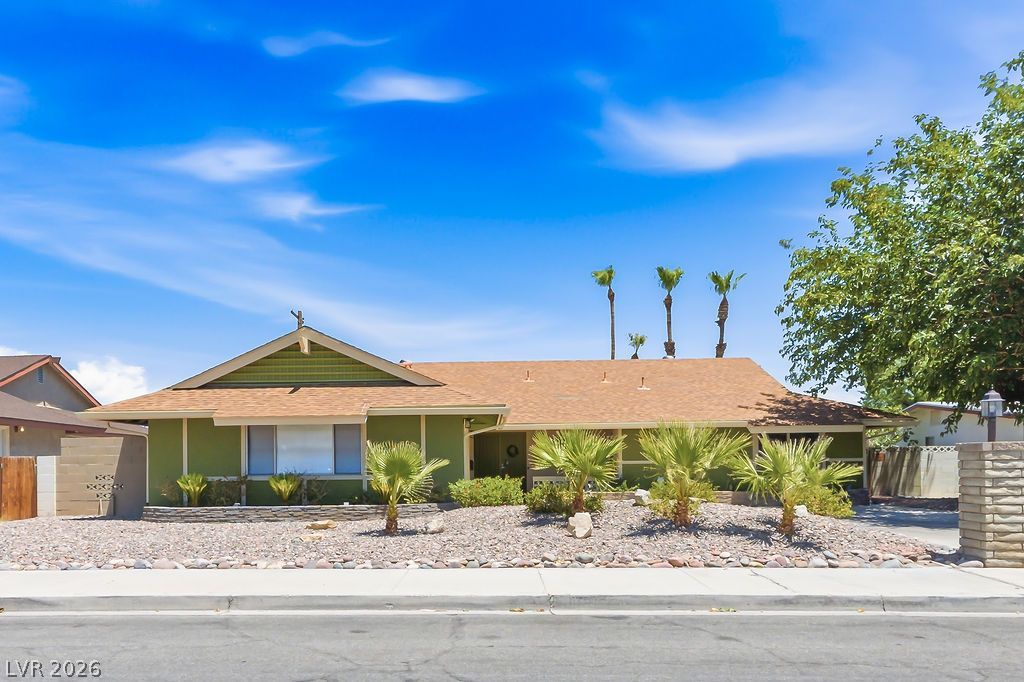
$475,0003 bd2 ba1,815 sqft$262/sqft0.23 mi31 daysSold 2026-08-27

$396,8003 bd2 ba2,267 sqft$175/sqft0.32 mi21 daysSold 2026-10-20
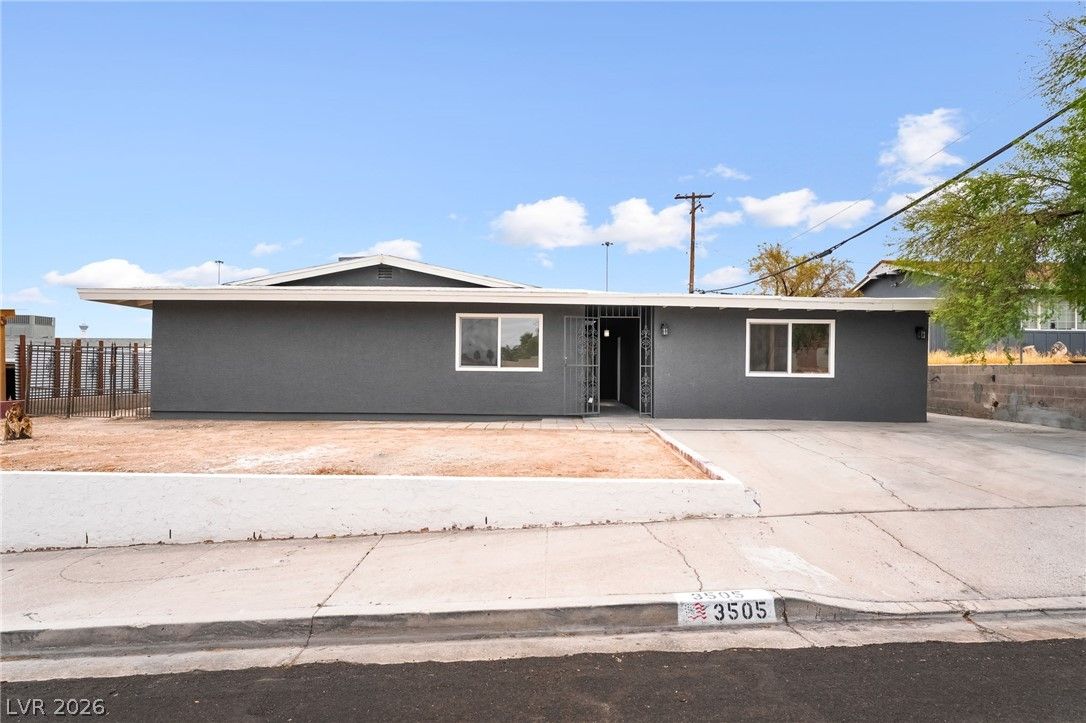
3505 West Bonanza RoadActive
$425,0003 bd2 ba2,198 sqft$193/sqft0.35 mi48 days
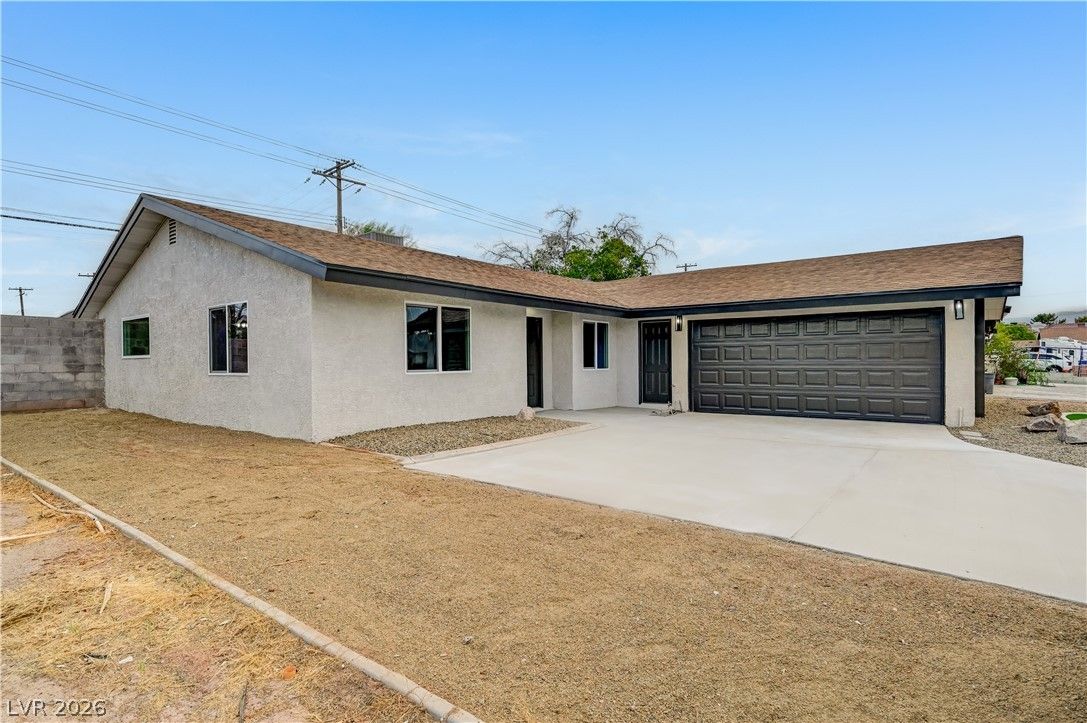
$434,9003 bd2 ba1,570 sqft$277/sqft0.35 mi44 days
$425,0003 bd2 ba1,580 sqft$269/sqft0.38 mi42 daysSold 2026-05-27
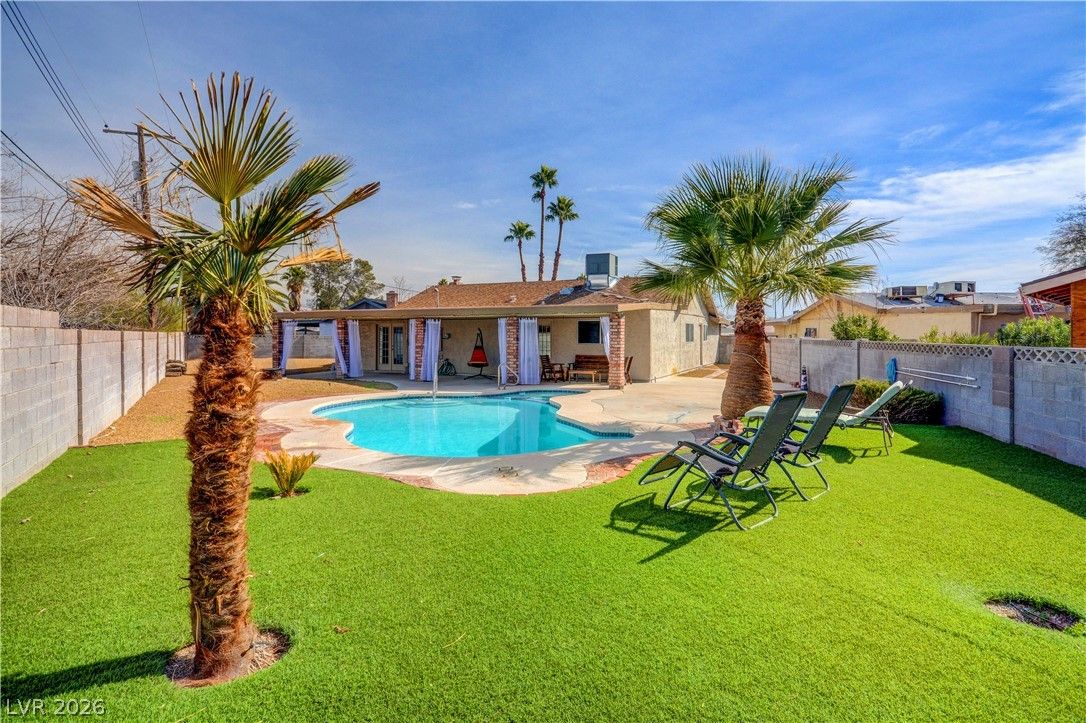
$434,0003 bd2 ba1,668 sqft$260/sqft0.40 mi79 daysSold 2026-09-10
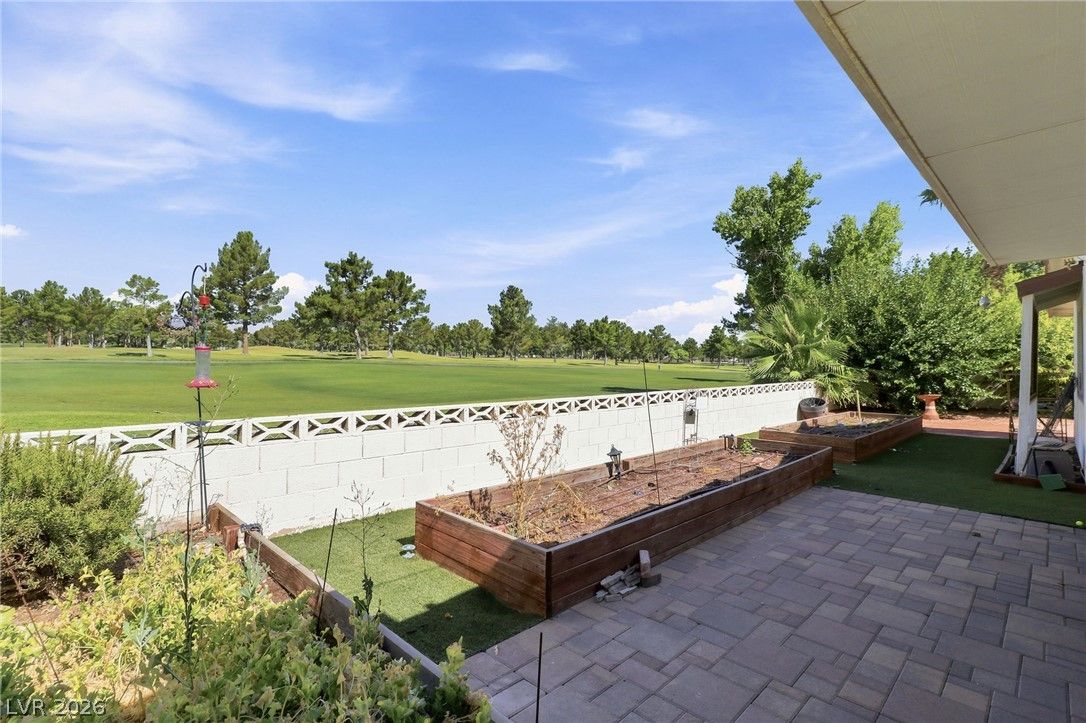
1209 Oak Tree LaneActive
$549,0003 bd3 ba2,176 sqft$252/sqft0.43 mi115 days
Nearest comparable sales and listings
12 comparables · median price $432,500 · range $389,995 – $549,000 · median $/sq ft $256 · average $/sq ft $239
| Address | Status | Price | $/Sq Ft | Bd / Ba | Sq Ft | Sold / market time | Distance |
|---|---|---|---|---|---|---|---|
| 4000 Fortune Avenue | Active | $420,000 | $185 | 5 / 3 | 2,265 | 97 days on market | 0.07 mi |
| 4207 Snead Drive | Sold | $480,000 | $234 | 4 / 3 | 2,055 | Sold 2026-09-10 | 0.15 mi |
| 3605 Apache Lane | Under Contract | $445,000 | $278 | 3 / 2 | 1,600 | 48 days on market | 0.18 mi |
| 924 Niblick Drive | Sold | $475,000 | $262 | 3 / 2 | 1,815 | Sold 2026-08-27 | 0.23 mi |
| 409 Estella Avenue | Sold | $396,800 | $175 | 3 / 2 | 2,267 | Sold 2026-10-20 | 0.32 mi |
| 3505 West Bonanza Road | Active | $425,000 | $193 | 3 / 2 | 2,198 | 48 days on market | 0.35 mi |
| 4409 Saint Andrews Circle | Active | $434,900 | $277 | 3 / 2 | 1,570 | 44 days on market | 0.35 mi |
| 4416 Saint Andrews Circle | Sold | $425,000 | $269 | 3 / 2 | 1,580 | Sold 2026-05-27 | 0.38 mi |
| 220 Moller Circle | Sold | $434,000 | $260 | 3 / 2 | 1,668 | Sold 2026-09-10 | 0.40 mi |
| 1209 Oak Tree Lane | Active | $549,000 | $252 | 3 / 3 | 2,176 | 115 days on market | 0.43 mi |
| 1201 Woodbridge Drive | Sold | $431,000 | $259 | 4 / 2 | 1,666 | Sold 2026-05-15 | 0.43 mi |
| 1004 Baker Avenue | Active | $389,995 | $225 | 5 / 2 | 1,732 | 4 days on market | 0.51 mi |


