
Comparable Sales Near 9533 Belmont Bay Avenue, Las Vegas, NV 89148
1st Realty · Comparable sales report · 1st.estate · October 20, 2026
Browse our Las Vegas area guides →
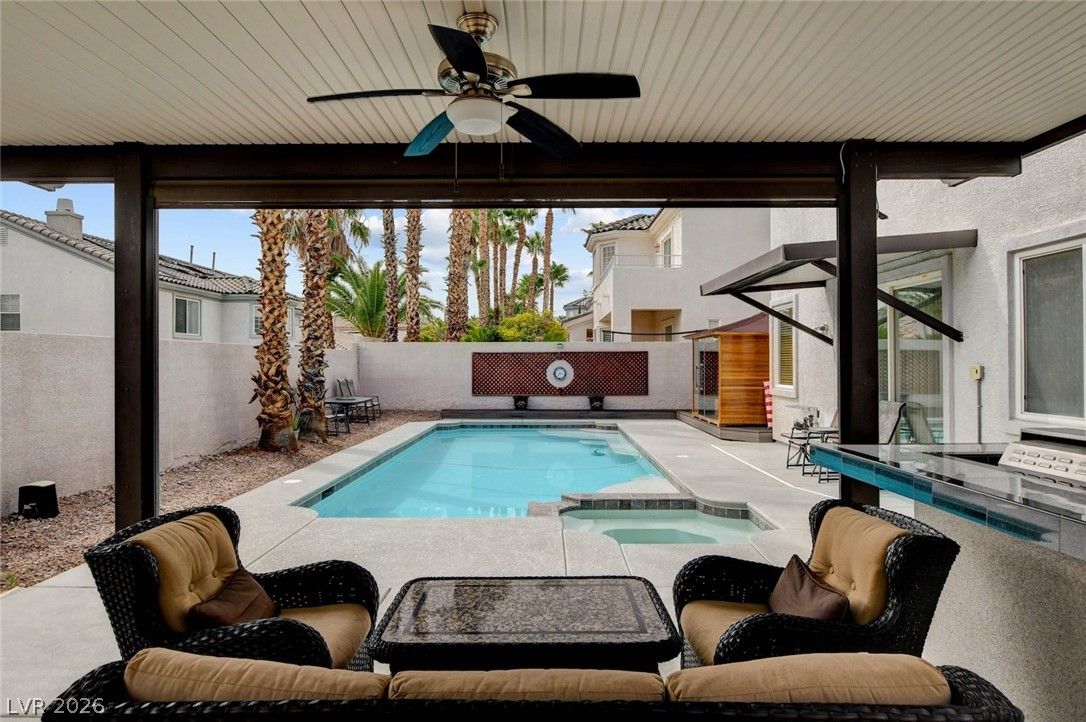
9533 Belmont Bay Avenue, Las Vegas, NV 89148
Status: Sold
$775,000 Sold Price
$229
$ / Sq Ft
3,386
Living Area
6,534 sqft
Lot Size
5
Beds
4
Baths
2016
Year Built
Search Parameters
Property Type
Status
Radius
Sold Within
Beds
Baths
Living Area (Sq Ft)
Lot Size (Sq Ft)
This comp search reflects your current search parameters — adjust the filters above as needed for a more accurate estimate.
Estimated Value
—
Average $/Sqft
—
Check one or more comps below to calculate an estimate.
Nearest 10 of 12 comparable sales and listings within 1 mile of this home. Use the filters above and press Search to refine.
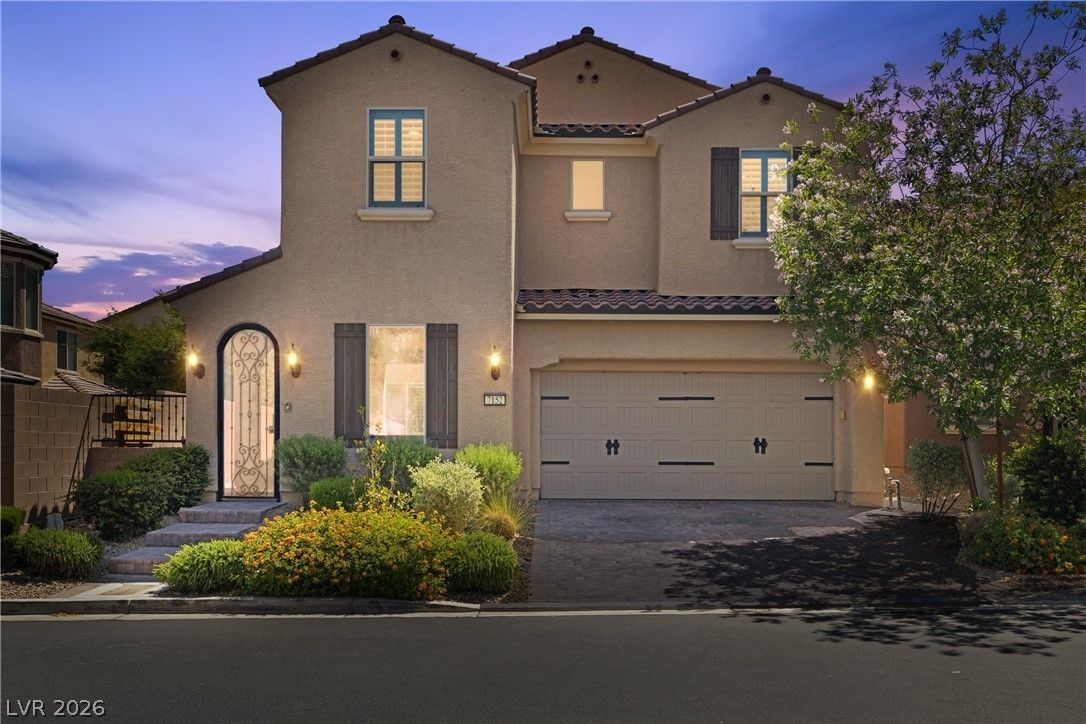
$723,0004 bd4 ba3,386 sqft$214/sqft0.04 mi94 daysSold 2026-08-28
$635,0005 bd4 ba3,212 sqft$198/sqft0.11 mi2 daysSold 2026-06-05
$1,130,0004 bd4 ba2,983 sqft$379/sqft0.21 mi29 daysSold 2026-06-17
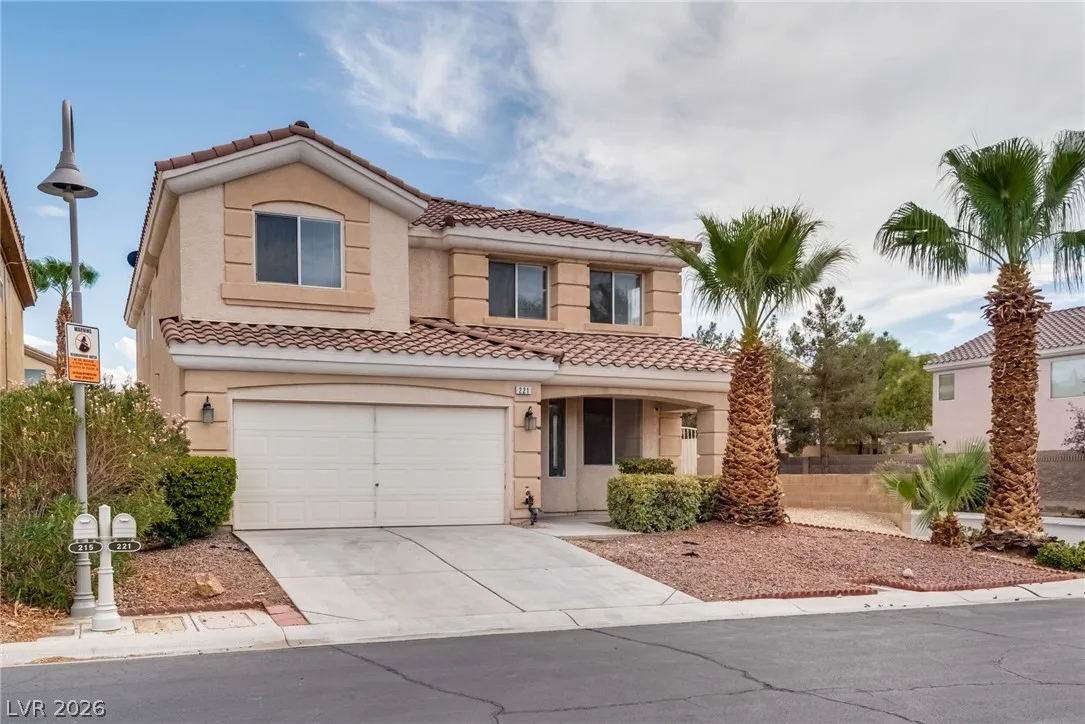
$539,0005 bd3 ba2,886 sqft$187/sqft0.63 mi0 days
$565,0004 bd4 ba2,780 sqft$203/sqft0.81 mi66 daysSold 2026-07-03
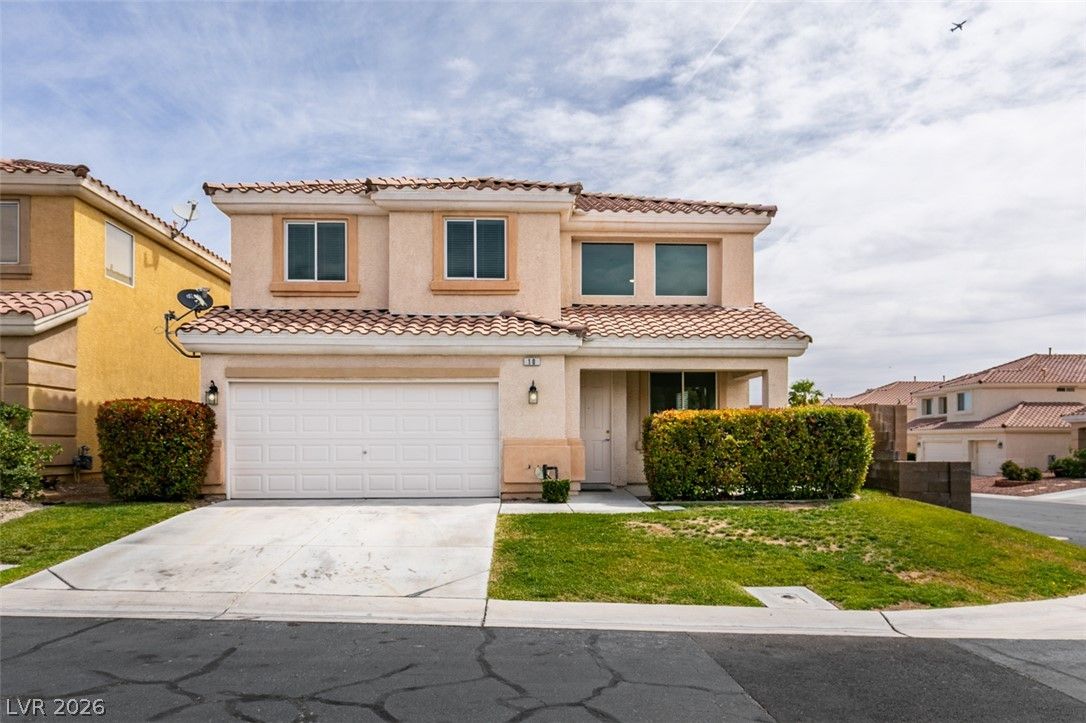
10 Indian Run WayActive
$549,0006 bd4 ba2,780 sqft$197/sqft0.84 mi108 days
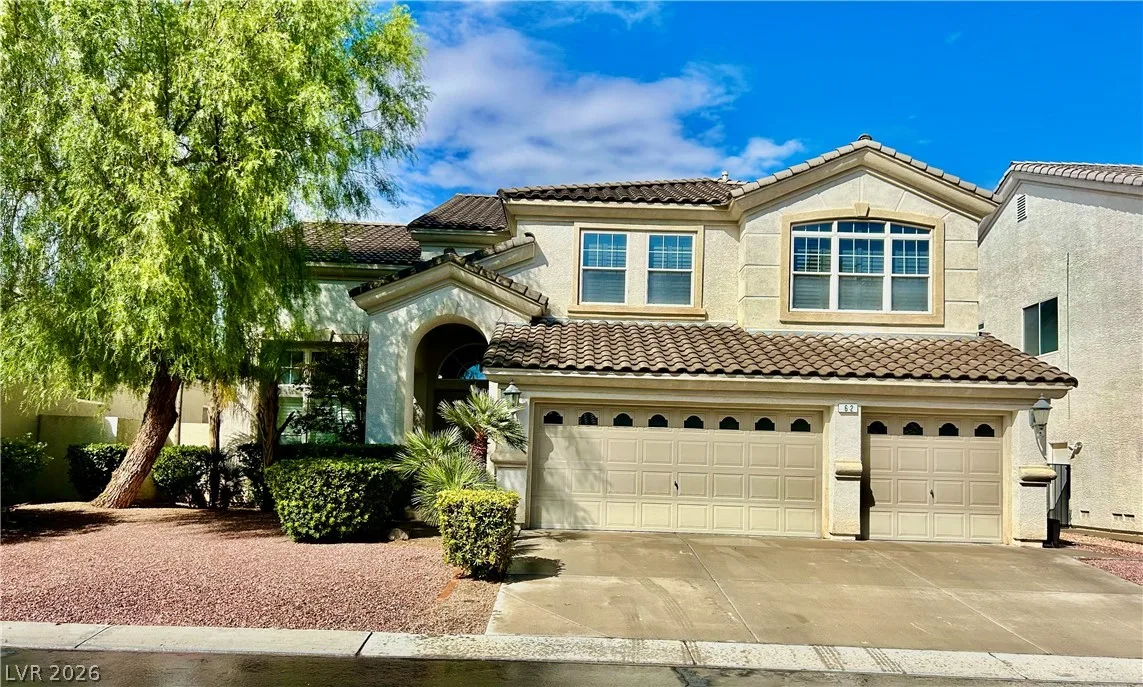
$799,9004 bd4 ba3,354 sqft$238/sqft0.87 mi6 days
$1,100,0004 bd4 ba3,354 sqft$328/sqft0.89 mi59 days

32 Cascade Lake StreetActive
$998,0006 bd5 ba4,148 sqft$241/sqft0.96 mi45 days
$980,0005 bd3 ba3,044 sqft$322/sqft0.97 mi2 daysSold 2026-06-11
Nearest comparable sales and listings
12 comparables · median price $725,944 · range $539,000 – $1,130,000 · median $/sq ft $226 · average $/sq ft $243
| Address | Status | Price | $/Sq Ft | Bd / Ba | Sq Ft | Sold / market time | Distance |
|---|---|---|---|---|---|---|---|
| 7152 Willow Moss Court | Sold | $723,000 | $214 | 4 / 4 | 3,386 | Sold 2026-08-28 | 0.04 mi |
| 7200 Cotton Bluff Street | Sold | $635,000 | $198 | 5 / 4 | 3,212 | Sold 2026-06-05 | 0.11 mi |
| 7230 Galaxy Dune Street | Sold | $1,130,000 | $379 | 4 / 4 | 2,983 | Sold 2026-06-17 | 0.21 mi |
| 221 Lenape Heights Avenue | Active | $539,000 | $187 | 5 / 3 | 2,886 | 0 days on market | 0.63 mi |
| 31 Indian Run Way | Sold | $565,000 | $203 | 4 / 4 | 2,780 | Sold 2026-07-03 | 0.81 mi |
| 10 Indian Run Way | Active | $549,000 | $197 | 6 / 4 | 2,780 | 108 days on market | 0.84 mi |
| 62 Perennial Border Court | Active | $799,900 | $238 | 4 / 4 | 3,354 | 6 days on market | 0.87 mi |
| 74 Tamarron Cliffs Street | Active | $1,100,000 | $328 | 4 / 4 | 3,354 | 59 days on market | 0.89 mi |
| 32 Cascade Lake Street | Active | $998,000 | $241 | 6 / 5 | 4,148 | 45 days on market | 0.96 mi |
| 161 Rancho Maria Street | Sold | $980,000 | $322 | 5 / 3 | 3,044 | Sold 2026-06-11 | 0.97 mi |
| 141 Rancho Maria Street | Active | $728,888 | $239 | 5 / 3 | 3,045 | 4 days on market | 0.98 mi |
| 9609 Rolling Thunder Avenue | Sold | $550,000 | $173 | 4 / 3 | 3,178 | Sold 2026-07-21 | 0.98 mi |


