
Comparable Sales Near 1101 Enderly Lane, Las Vegas, NV 89144
1st Realty · Comparable sales report · 1st.estate · October 21, 2026
Browse our Las Vegas area guides →
1101 Enderly Lane, Las Vegas, NV 89144
Status: Sold
$3,000 Sold Price
$2
$ / Sq Ft
1,868
Living Area
7,841 sqft
Lot Size
4
Beds
3
Baths
1995
Year Built
Search Parameters
Property Type
Status
Radius
Sold Within
Beds
Baths
Living Area (Sq Ft)
Lot Size (Sq Ft)
This comp search reflects your current search parameters — adjust the filters above as needed for a more accurate estimate.
Estimated Value
—
Average $/Sqft
—
Check one or more comps below to calculate an estimate.
Nearest 10 of 16 comparable sales and listings within 1 mile of this home. Use the filters above and press Search to refine.
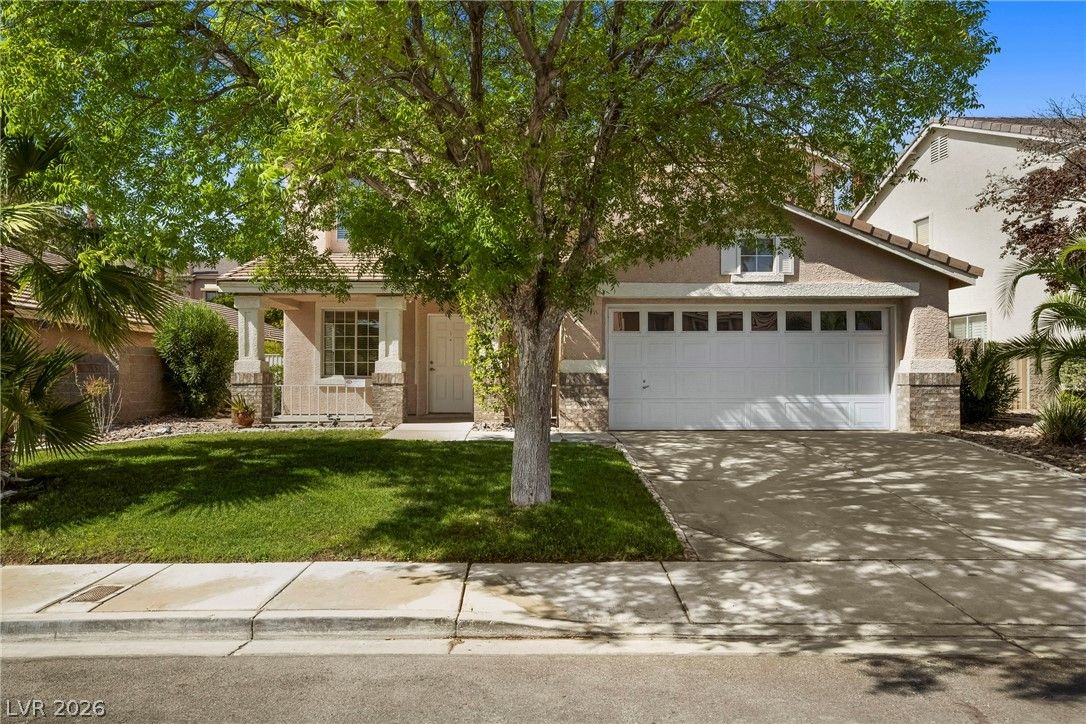
10129 Oakmoor PlaceActive
$619,9983 bd3 ba1,868 sqft$332/sqft0.08 mi43 days
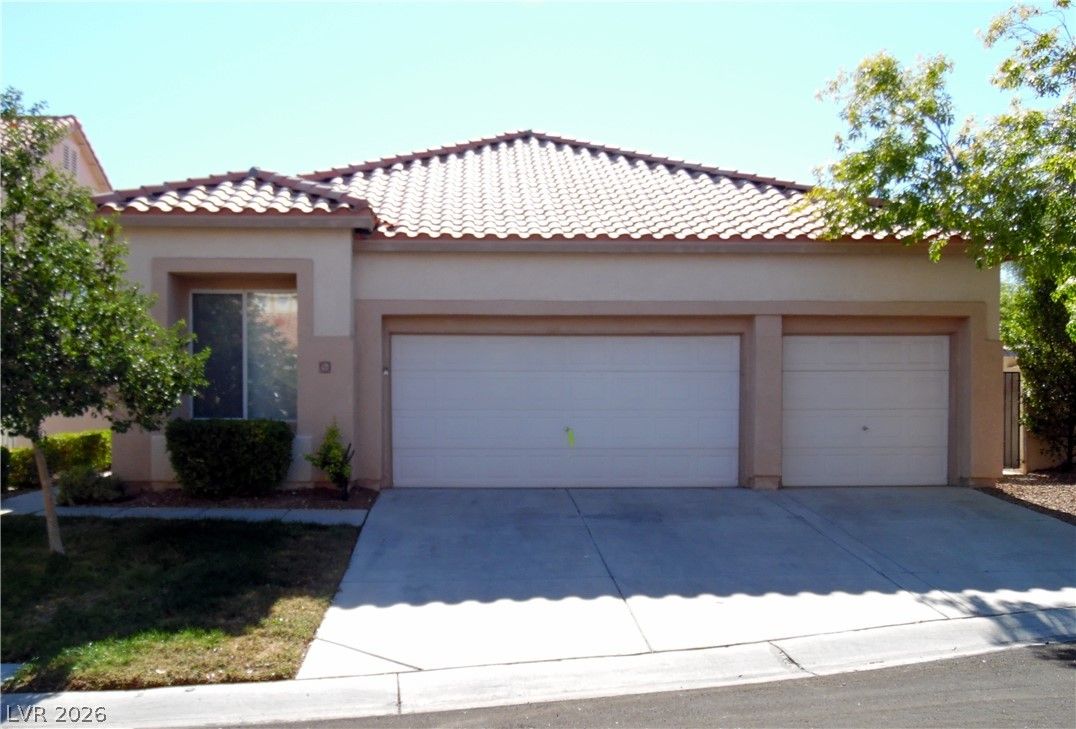
$520,0004 bd2 ba1,940 sqft$268/sqft0.45 mi39 daysSold 2026-10-13
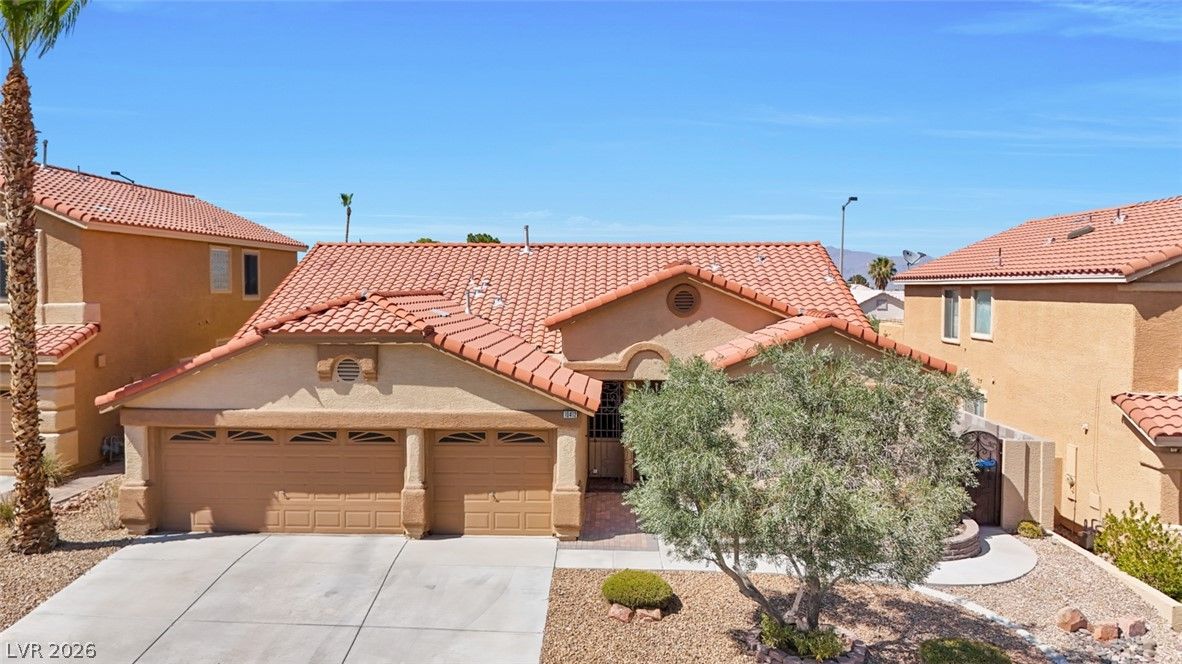
$589,0004 bd3 ba2,193 sqft$269/sqft0.46 mi72 daysSold 2026-10-08
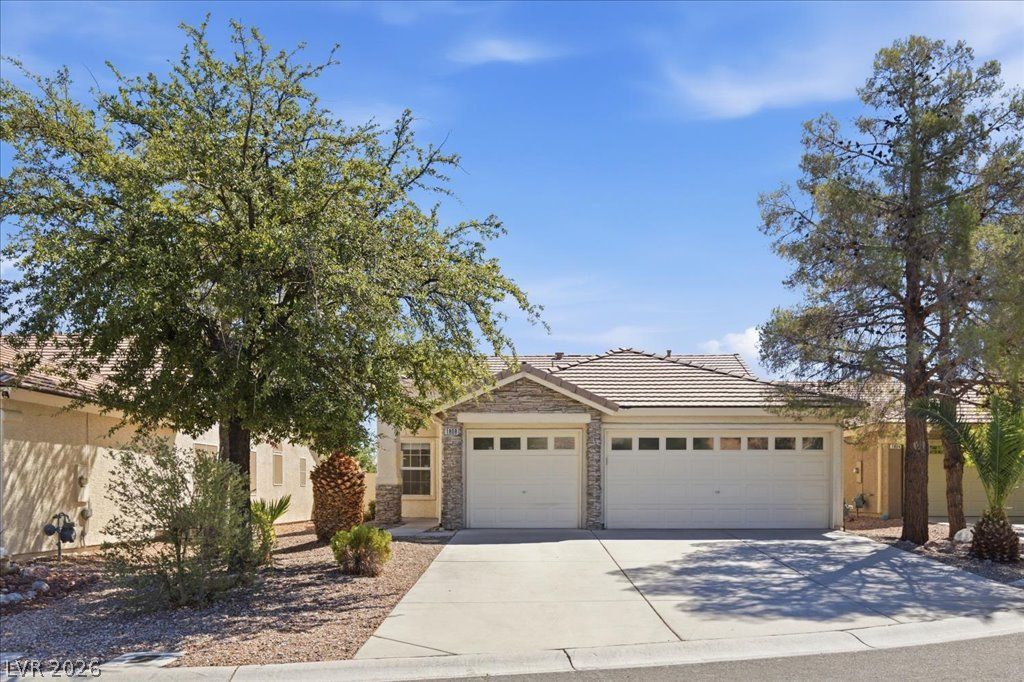
1808 Lyell Canyon LanePending
$480,0003 bd2 ba1,560 sqft$308/sqft0.55 mi12 days
$525,0003 bd2 ba1,597 sqft$329/sqft0.64 mi11 daysSold 2026-07-08
$563,0004 bd3 ba1,874 sqft$300/sqft0.65 mi8 daysSold 2026-06-05
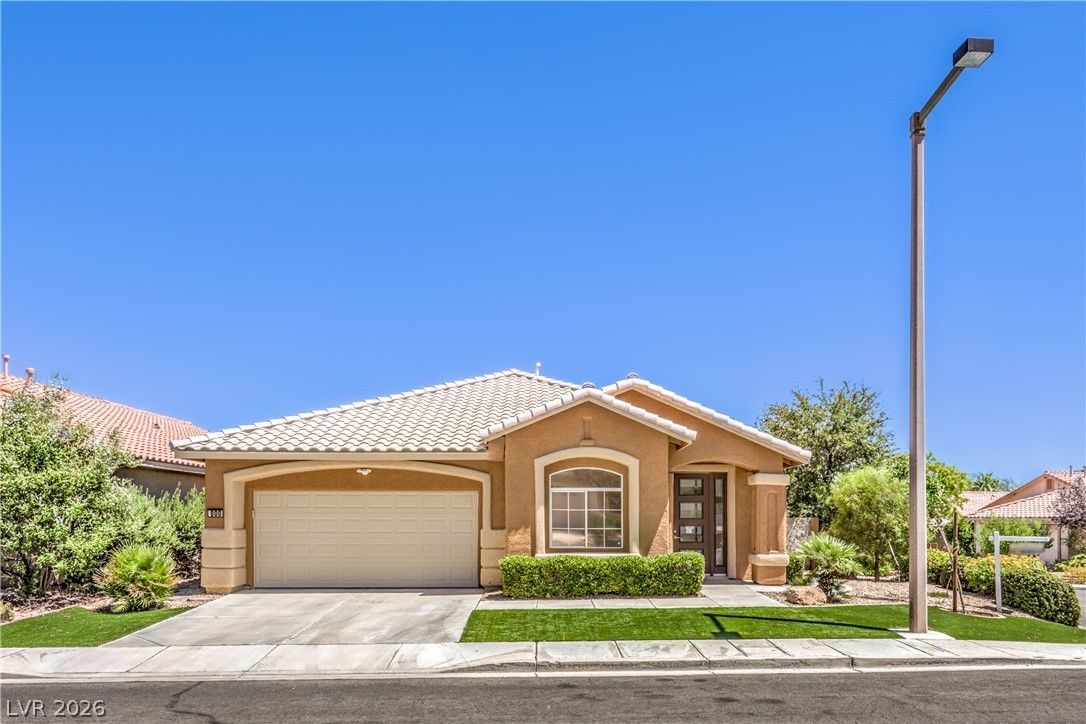
800 Royal Elm LaneActive
$649,0003 bd2 ba1,987 sqft$327/sqft0.68 mi77 days

$600,0003 bd3 ba1,576 sqft$381/sqft0.70 mi21 days
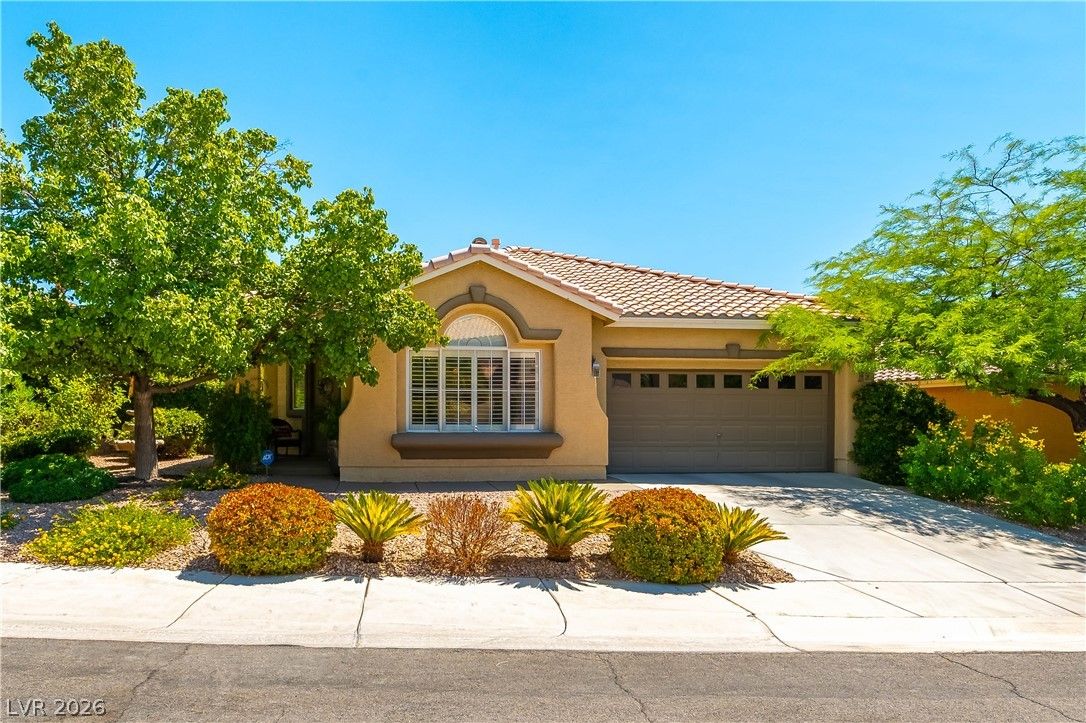
328 Autumn Palace CourtActive
$550,9003 bd2 ba1,738 sqft$317/sqft0.79 mi79 days
$725,0004 bd3 ba2,276 sqft$319/sqft0.79 mi16 daysSold 2026-06-02
Nearest comparable sales and listings
12 comparables · median price $594,500 · range $480,000 – $820,000 · median $/sq ft $318 · average $/sq ft $315
| Address | Status | Price | $/Sq Ft | Bd / Ba | Sq Ft | Sold / market time | Distance |
|---|---|---|---|---|---|---|---|
| 10129 Oakmoor Place | Active | $619,998 | $332 | 3 / 3 | 1,868 | 43 days on market | 0.08 mi |
| 10313 Huxley Cross Lane | Sold | $520,000 | $268 | 4 / 2 | 1,940 | Sold 2026-10-13 | 0.45 mi |
| 10412 FALLS CHURCH Avenue | Sold | $589,000 | $269 | 4 / 3 | 2,193 | Sold 2026-10-08 | 0.46 mi |
| 1808 Lyell Canyon Lane | Pending | $480,000 | $308 | 3 / 2 | 1,560 | 12 days on market | 0.55 mi |
| 10644 Brianhurst Avenue | Sold | $525,000 | $329 | 3 / 2 | 1,597 | Sold 2026-07-08 | 0.64 mi |
| 10653 Oak Apple Avenue | Sold | $563,000 | $300 | 4 / 3 | 1,874 | Sold 2026-06-05 | 0.65 mi |
| 800 Royal Elm Lane | Active | $649,000 | $327 | 3 / 2 | 1,987 | 77 days on market | 0.68 mi |
| 1701 Drifters Peak Street | Active | $600,000 | $381 | 3 / 3 | 1,576 | 21 days on market | 0.70 mi |
| 328 Autumn Palace Court | Active | $550,900 | $317 | 3 / 2 | 1,738 | 79 days on market | 0.79 mi |
| 1957 Sondrio Drive | Sold | $725,000 | $319 | 4 / 3 | 2,276 | Sold 2026-06-02 | 0.79 mi |
| 121 Torchwood Lane | Sold | $612,800 | $278 | 3 / 2 | 2,203 | Sold 2026-05-07 | 0.84 mi |
| 121 Torchwood Lane | Sold | $820,000 | $353 | 4 / 3 | 2,326 | Sold 2026-10-15 | 0.84 mi |


