
Comparable Sales Near 228 Redstone Street, Las Vegas, NV 89145
1st Realty · Comparable sales report · 1st.estate · October 21, 2026
Browse our Las Vegas area guides →
228 Redstone Street, Las Vegas, NV 89145
Status: Sold
$1,750 Sold Price
$1
$ / Sq Ft
1,519
Living Area
6,534 sqft
Lot Size
3
Beds
2
Baths
1969
Year Built
Search Parameters
Property Type
Status
Radius
Sold Within
Beds
Baths
Living Area (Sq Ft)
Lot Size (Sq Ft)
This comp search reflects your current search parameters — adjust the filters above as needed for a more accurate estimate.
Estimated Value
—
Average $/Sqft
—
Check one or more comps below to calculate an estimate.
Nearest 10 of 63 comparable sales and listings within 1 mile of this home. Use the filters above and press Search to refine.

329 Santa Fe StreetActive
$407,9503 bd2 ba1,663 sqft$245/sqft0.12 mi27 days
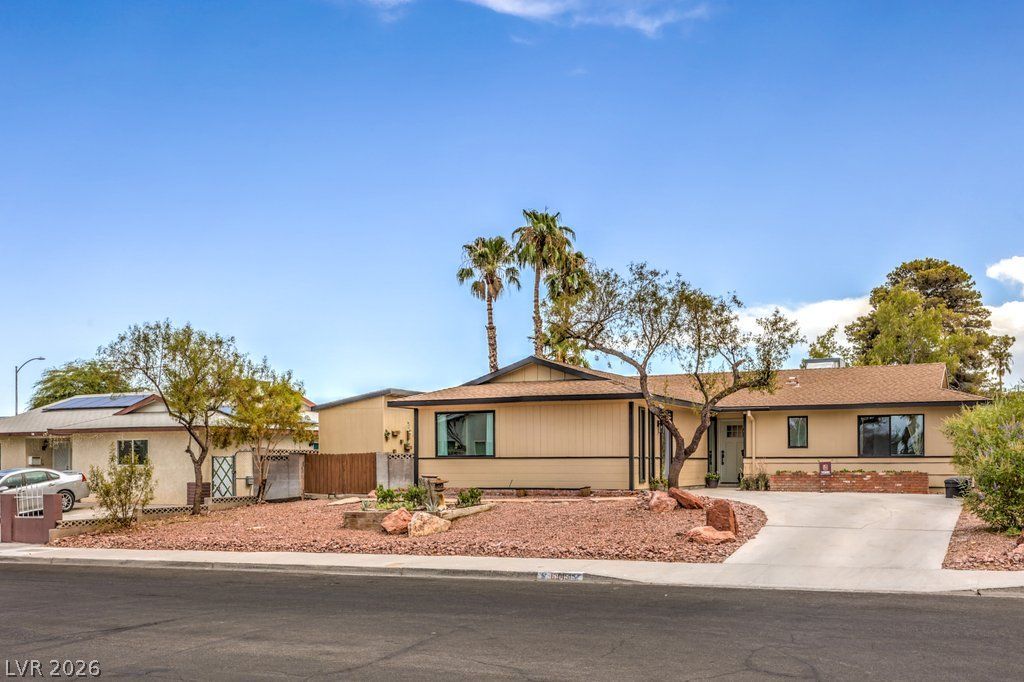
$440,0004 bd3 ba1,617 sqft$272/sqft0.15 mi5 daysSold 2026-09-17
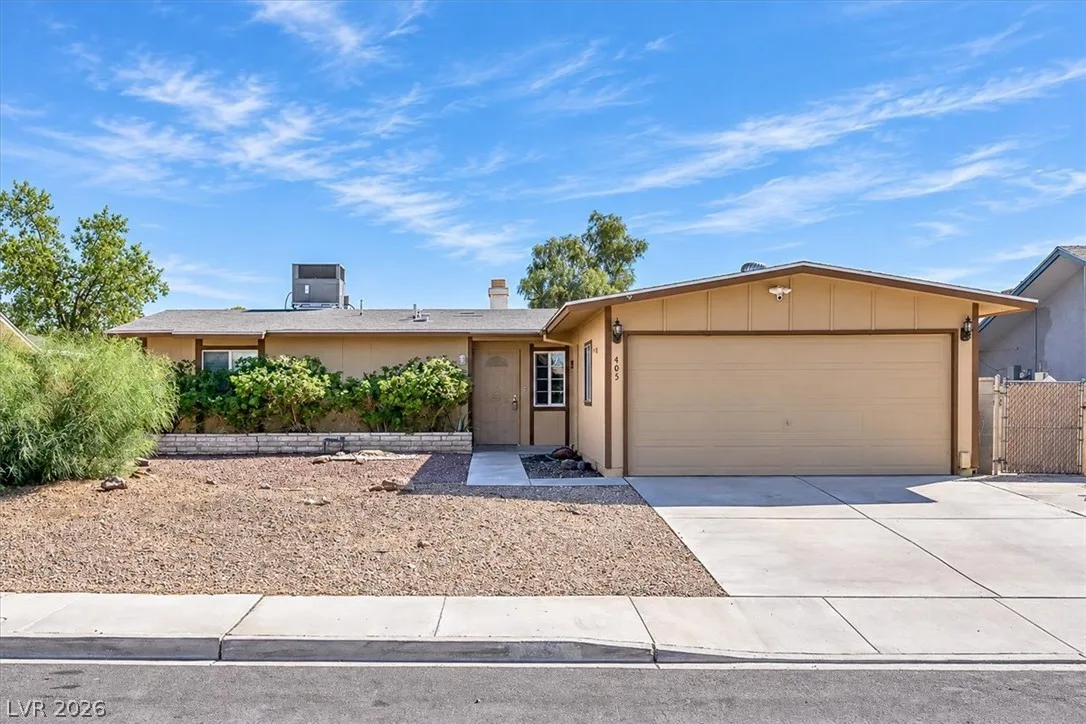
405 Santa Fe StreetActive
$385,0003 bd2 ba1,680 sqft$229/sqft0.16 mi4 days
$381,0004 bd2 ba1,784 sqft$214/sqft0.17 mi5 daysSold 2026-05-19
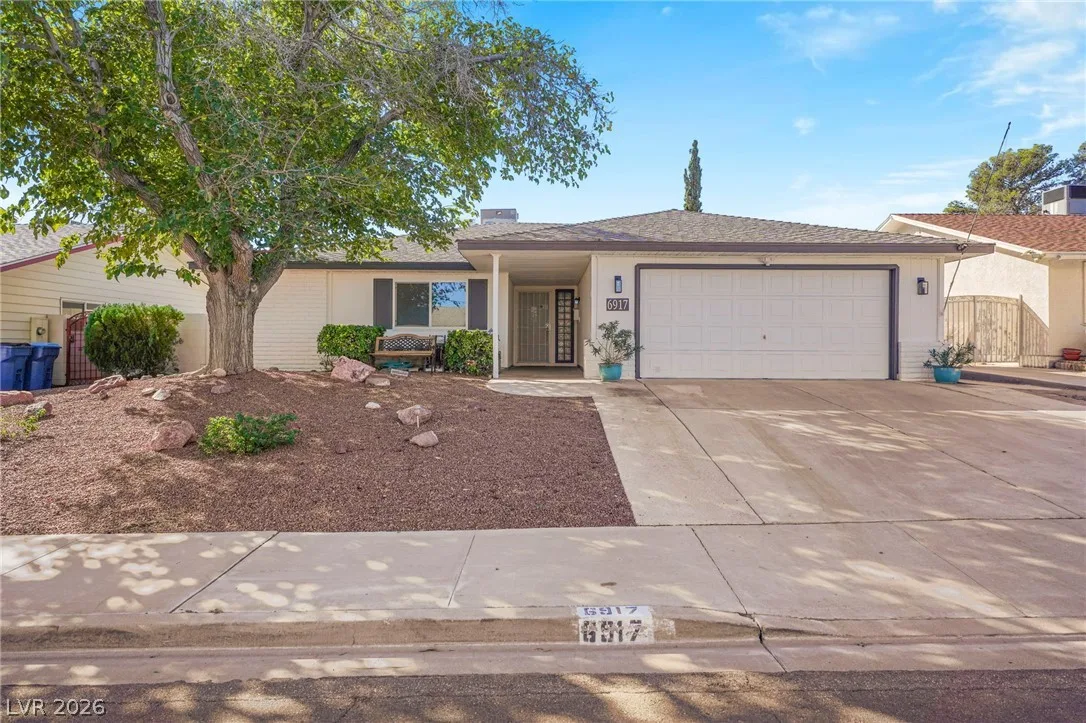
6917 Creekside LaneActive
$445,0003 bd2 ba1,620 sqft$275/sqft0.19 mi0 days
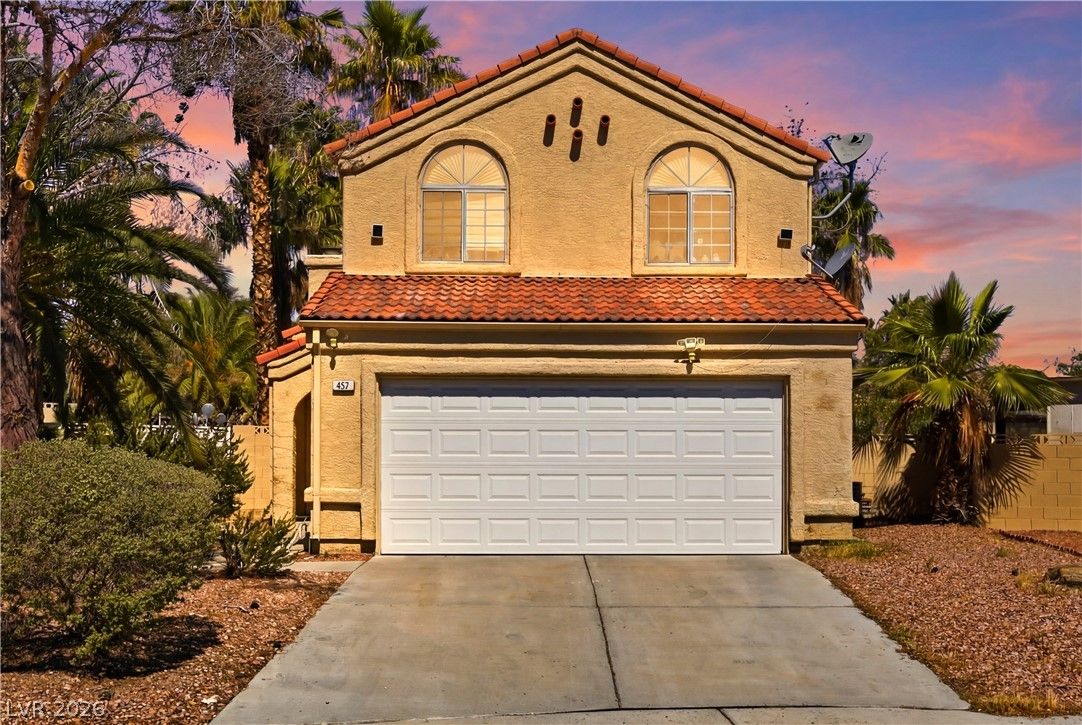
$415,0003 bd3 ba1,514 sqft$274/sqft0.22 mi11 daysSold 2026-08-19

321 Bent Creek DriveActive
$459,9003 bd3 ba1,893 sqft$243/sqft0.27 mi18 days
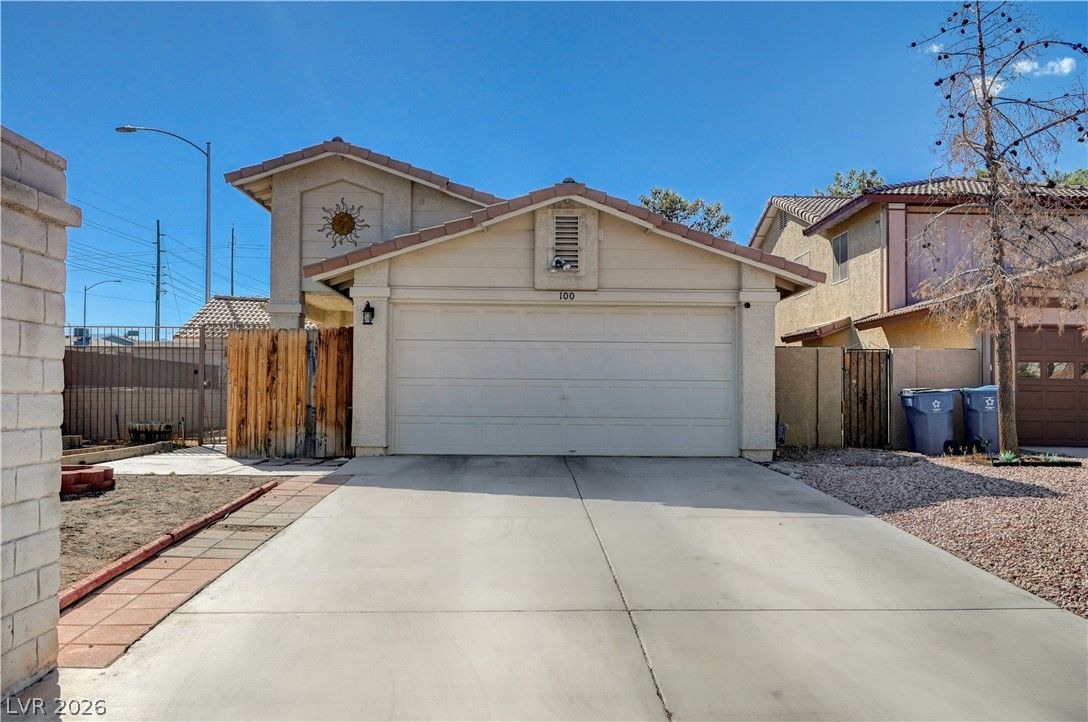
100 Underhill CourtActive
$425,0003 bd2 ba1,182 sqft$360/sqft0.28 mi13 days

$415,0004 bd2 ba1,688 sqft$246/sqft0.30 mi32 days
$450,0004 bd2 ba1,519 sqft$296/sqft0.34 mi96 daysSold 2026-05-22
Nearest comparable sales and listings
12 comparables · median price $420,000 · range $320,000 – $459,900 · median $/sq ft $246 · average $/sq ft $259
| Address | Status | Price | $/Sq Ft | Bd / Ba | Sq Ft | Sold / market time | Distance |
|---|---|---|---|---|---|---|---|
| 329 Santa Fe Street | Active | $407,950 | $245 | 3 / 2 | 1,663 | 27 days on market | 0.12 mi |
| 6945 Cobblestone Avenue | Sold | $440,000 | $272 | 4 / 3 | 1,617 | Sold 2026-09-17 | 0.15 mi |
| 405 Santa Fe Street | Active | $385,000 | $229 | 3 / 2 | 1,680 | 4 days on market | 0.16 mi |
| 220 Candlelight Street | Sold | $381,000 | $214 | 4 / 2 | 1,784 | Sold 2026-05-19 | 0.17 mi |
| 6917 Creekside Lane | Active | $445,000 | $275 | 3 / 2 | 1,620 | 0 days on market | 0.19 mi |
| 432 Capertino Street | Sold | $415,000 | $274 | 3 / 3 | 1,514 | Sold 2026-08-19 | 0.22 mi |
| 321 Bent Creek Drive | Active | $459,900 | $243 | 3 / 3 | 1,893 | 18 days on market | 0.27 mi |
| 100 Underhill Court | Active | $425,000 | $360 | 3 / 2 | 1,182 | 13 days on market | 0.28 mi |
| 6721 North Brunswick Circle | Active | $415,000 | $246 | 4 / 2 | 1,688 | 32 days on market | 0.30 mi |
| 7113 Stormson Drive | Sold | $450,000 | $296 | 4 / 2 | 1,519 | Sold 2026-05-22 | 0.34 mi |
| 7121 Hurricane Way | Sold | $435,000 | $244 | 4 / 2 | 1,784 | Sold 2026-05-14 | 0.37 mi |
| 7120 Pinedale Avenue | Sold | $320,000 | $212 | 4 / 2 | 1,506 | Sold 2026-10-15 | 0.39 mi |


