
Comparable Sales Near 4833 Spanish Wells Drive, North Las Vegas, NV 89031
1st Realty · Comparable sales report · 1st.estate · October 21, 2026
Read the North Las Vegas area guide →
4833 Spanish Wells Drive, North Las Vegas, NV 89031
Status: Sold
$590,000 Sold Price
$211
$ / Sq Ft
2,801
Living Area
6,098 sqft
Lot Size
5
Beds
3
Baths
1994
Year Built
Search Parameters
Property Type
Status
Radius
Sold Within
Beds
Baths
Living Area (Sq Ft)
Lot Size (Sq Ft)
This comp search reflects your current search parameters — adjust the filters above as needed for a more accurate estimate.
Estimated Value
—
Average $/Sqft
—
Check one or more comps below to calculate an estimate.
Nearest 10 of 27 comparable sales and listings within 1 mile of this home. Use the filters above and press Search to refine.
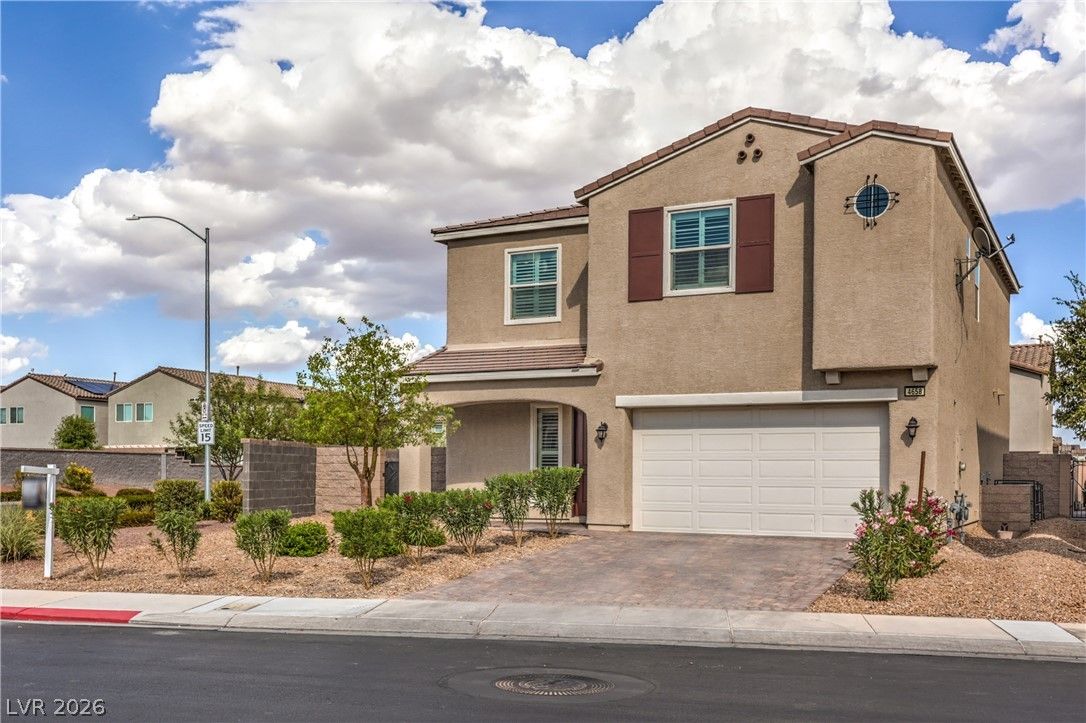
$509,0004 bd4 ba2,834 sqft$180/sqft0.19 mi30 days
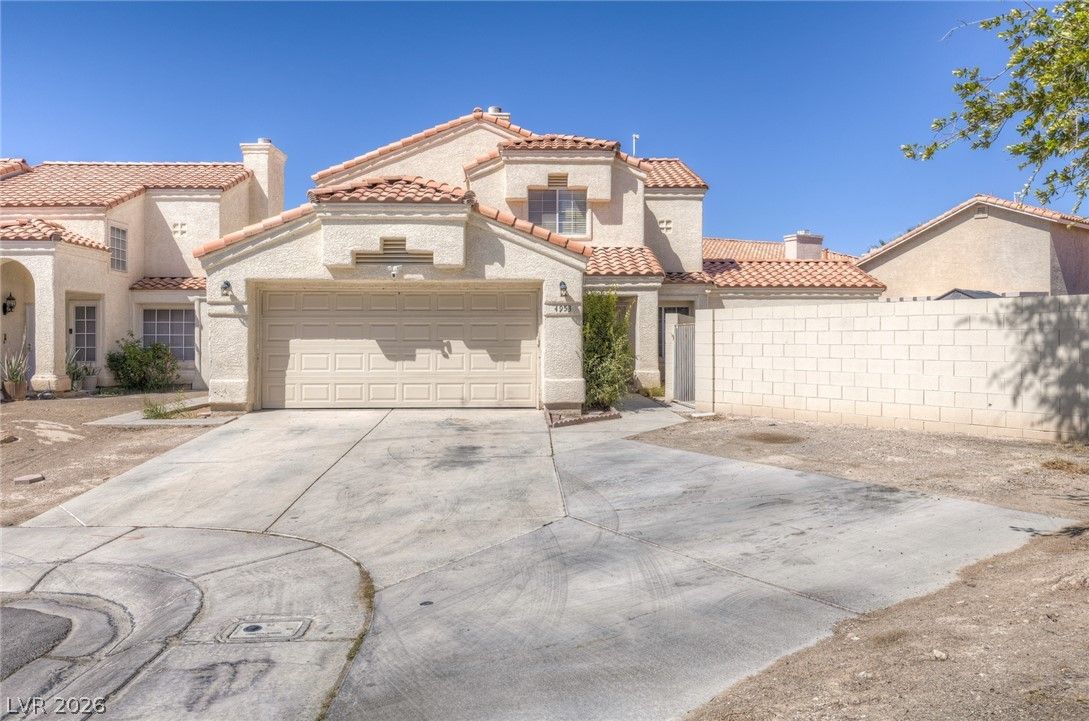
4953 El Sur CourtActive
$399,9004 bd3 ba2,106 sqft$190/sqft0.19 mi26 days
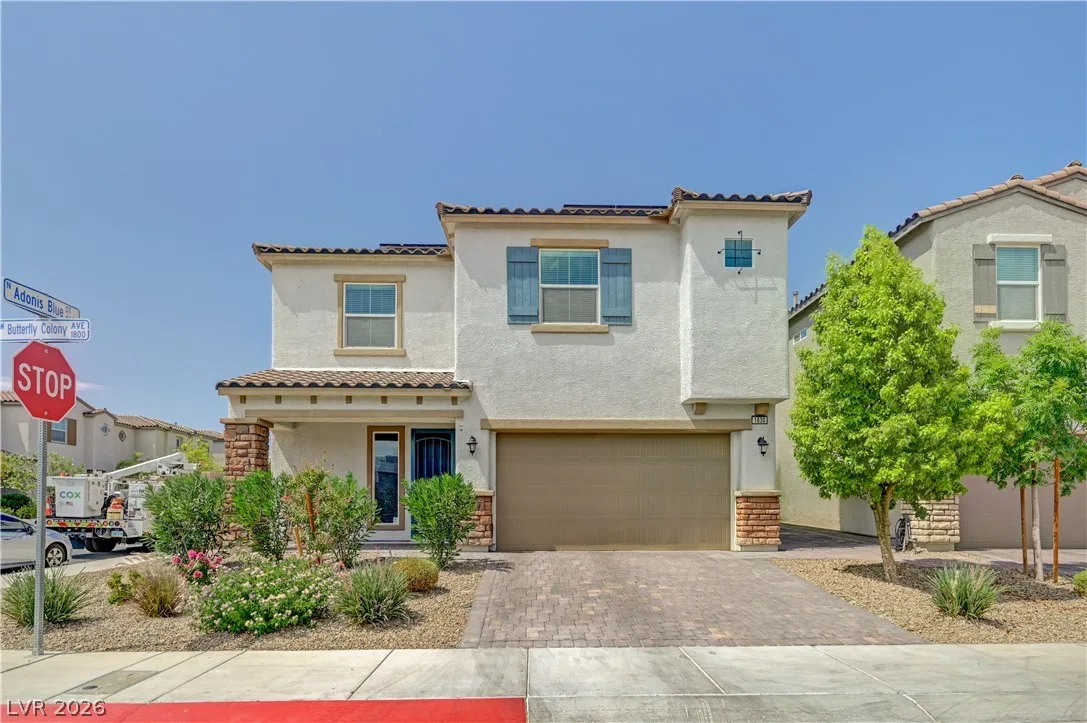
$534,9904 bd3 ba2,834 sqft$189/sqft0.30 mi7 days
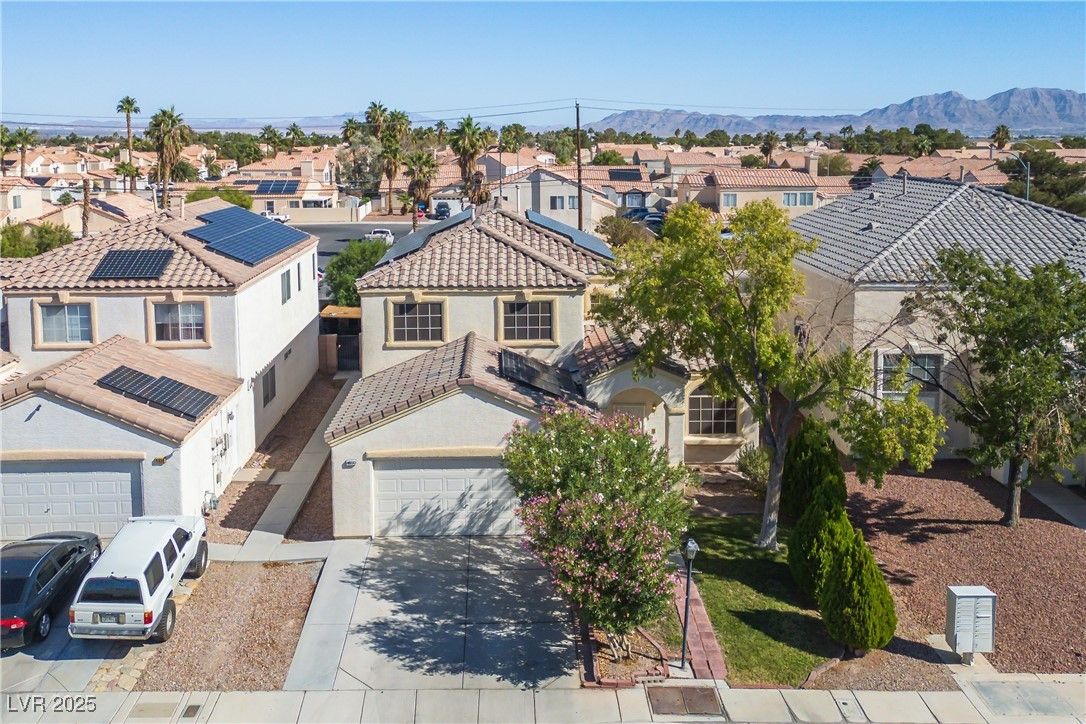
$449,0004 bd4 ba2,665 sqft$168/sqft0.30 mi183 daysSold 2026-07-30
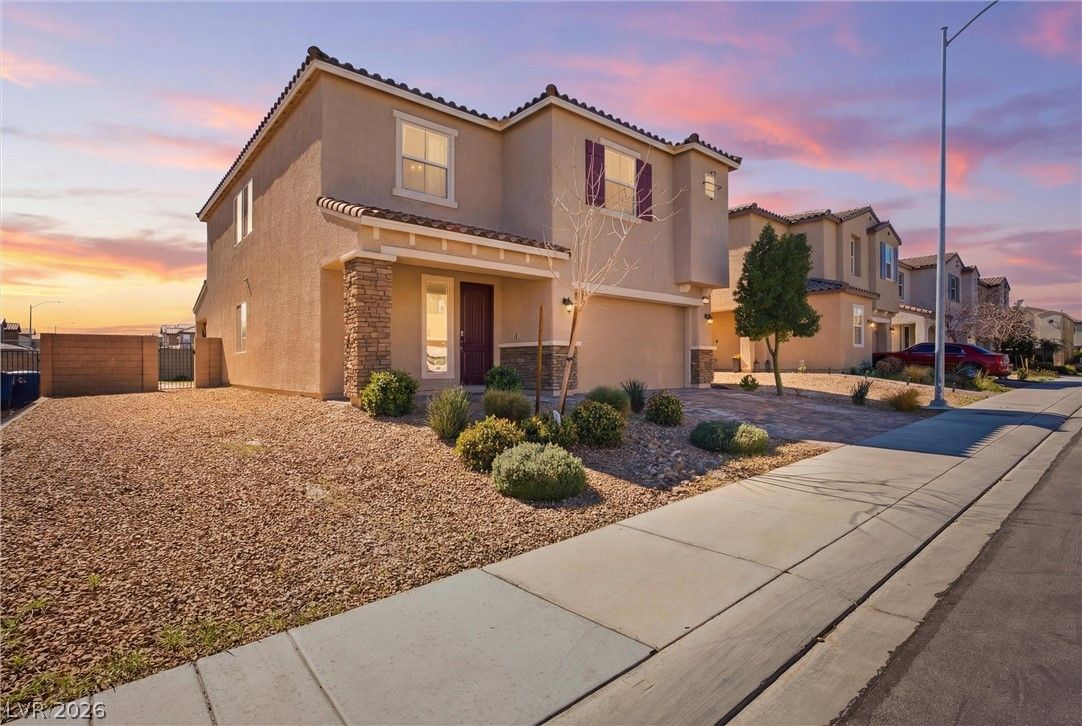
$525,0004 bd3 ba2,834 sqft$185/sqft0.32 mi3 daysSold 2026-09-01
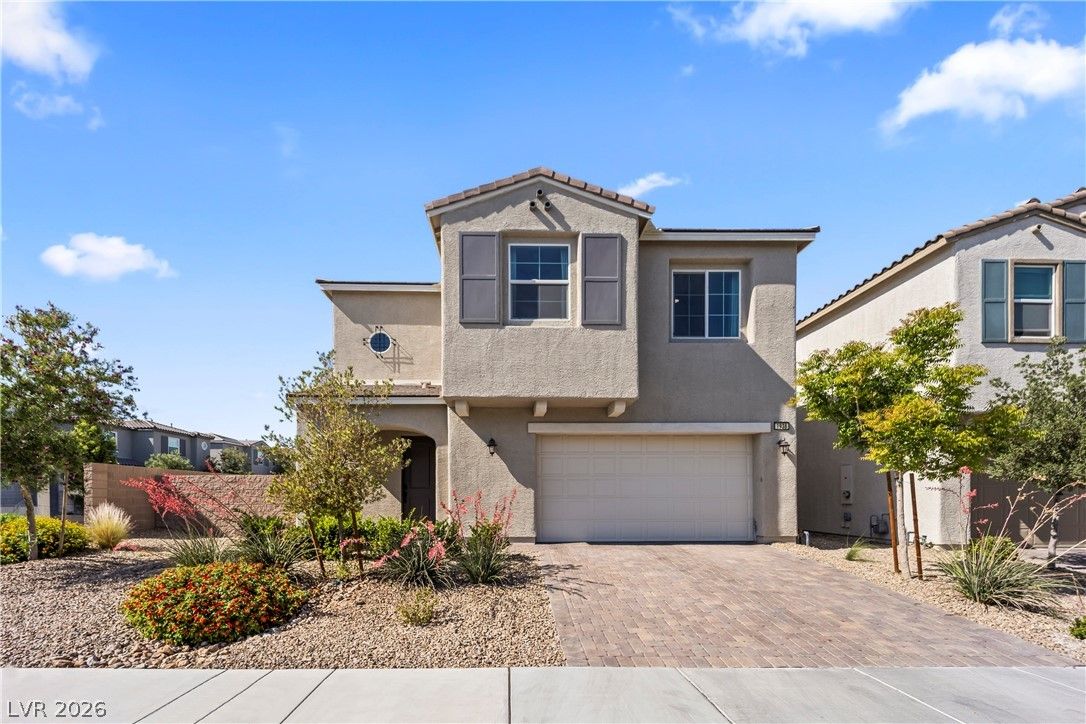
$599,9994 bd4 ba2,942 sqft$204/sqft0.37 mi9 daysSold 2026-08-07
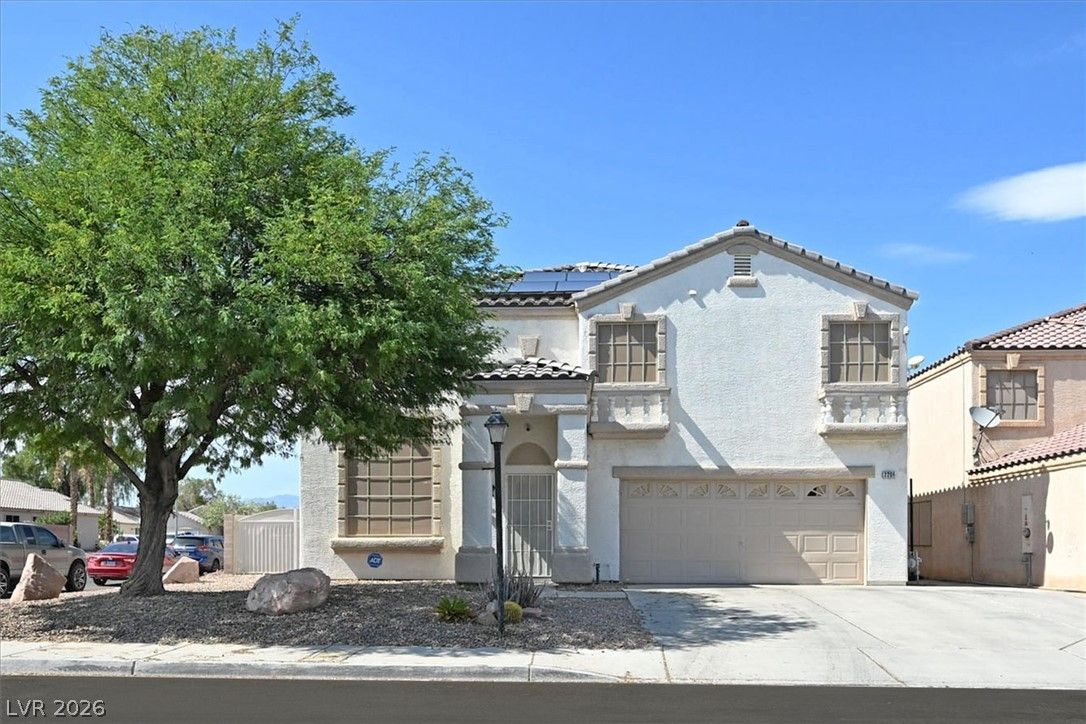
2206 Spanish Town AvenueActive
$469,9005 bd3 ba2,476 sqft$190/sqft0.41 mi2 days
$615,0005 bd3 ba2,944 sqft$209/sqft0.58 mi47 daysSold 2026-06-22
1058 Willow Berry AvenueActive
$516,0005 bd3 ba2,944 sqft$175/sqft0.64 mi0 days
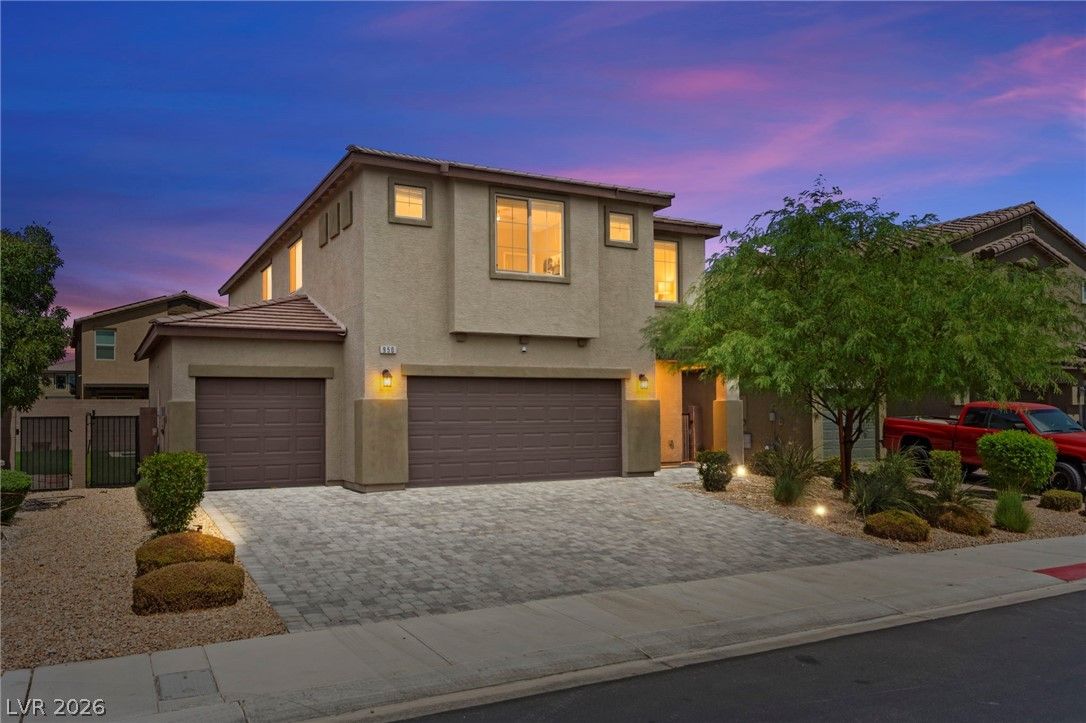
950 Willow Berry AvenueUnder Contract
$500,0005 bd3 ba2,639 sqft$189/sqft0.67 mi18 days
Nearest comparable sales and listings
12 comparables · median price $512,500 · range $399,900 – $615,000 · median $/sq ft $187 · average $/sq ft $184
| Address | Status | Price | $/Sq Ft | Bd / Ba | Sq Ft | Sold / market time | Distance |
|---|---|---|---|---|---|---|---|
| 4658 Chestnut Tiger Street | Active | $509,000 | $180 | 4 / 4 | 2,834 | 30 days on market | 0.19 mi |
| 4953 El Sur Court | Active | $399,900 | $190 | 4 / 3 | 2,106 | 26 days on market | 0.19 mi |
| 1830 Butterfly Colony Avenue | Active | $534,990 | $189 | 4 / 3 | 2,834 | 7 days on market | 0.30 mi |
| 4850 Little Cayman Street | Sold | $449,000 | $168 | 4 / 4 | 2,665 | Sold 2026-07-30 | 0.30 mi |
| 1815 Butterfly Colony Avenue | Sold | $525,000 | $185 | 4 / 3 | 2,834 | Sold 2026-09-01 | 0.32 mi |
| 1938 Karner Blue Avenue | Sold | $599,999 | $204 | 4 / 4 | 2,942 | Sold 2026-08-07 | 0.37 mi |
| 2206 Spanish Town Avenue | Active | $469,900 | $190 | 5 / 3 | 2,476 | 2 days on market | 0.41 mi |
| 1168 Strigose Avenue | Sold | $615,000 | $209 | 5 / 3 | 2,944 | Sold 2026-06-22 | 0.58 mi |
| 1058 Willow Berry Avenue | Active | $516,000 | $175 | 5 / 3 | 2,944 | 0 days on market | 0.64 mi |
| 950 Willow Berry Avenue | Under Contract | $500,000 | $189 | 5 / 3 | 2,639 | 18 days on market | 0.67 mi |
| 4622 Pointleaf Street | Under Contract | $520,000 | $177 | 5 / 3 | 2,944 | 56 days on market | 0.68 mi |
| 2422 Island Paradise Avenue | Sold | $435,000 | $150 | 4 / 4 | 2,904 | Sold 2026-08-19 | 0.69 mi |


