
Comparable Sales Near 7541 Port Orchard Avenue, Las Vegas, NV 89113
1st Realty · Comparable sales report · 1st.estate · October 21, 2026
Read the Enterprise neighborhood guide →
7541 Port Orchard Avenue, Las Vegas, NV 89113
Status: Sold
$2,132 Sold Price
$1
$ / Sq Ft
1,944
Living Area
5,663 sqft
Lot Size
3
Beds
2
Baths
2005
Year Built
Search Parameters
Property Type
Status
Radius
Sold Within
Beds
Baths
Living Area (Sq Ft)
Lot Size (Sq Ft)
This comp search reflects your current search parameters — adjust the filters above as needed for a more accurate estimate.
Estimated Value
—
Average $/Sqft
—
Check one or more comps below to calculate an estimate.
Nearest 10 of 18 comparable sales and listings within 1 mile of this home. Use the filters above and press Search to refine.
$499,9003 bd2 ba1,701 sqft$294/sqft0.09 mi80 daysSold 2026-06-25

7471 Burnt Oak AvenueActive
$495,0003 bd2 ba1,536 sqft$322/sqft0.21 mi0 days
$477,0003 bd3 ba1,763 sqft$271/sqft0.28 mi14 daysSold 2026-05-27
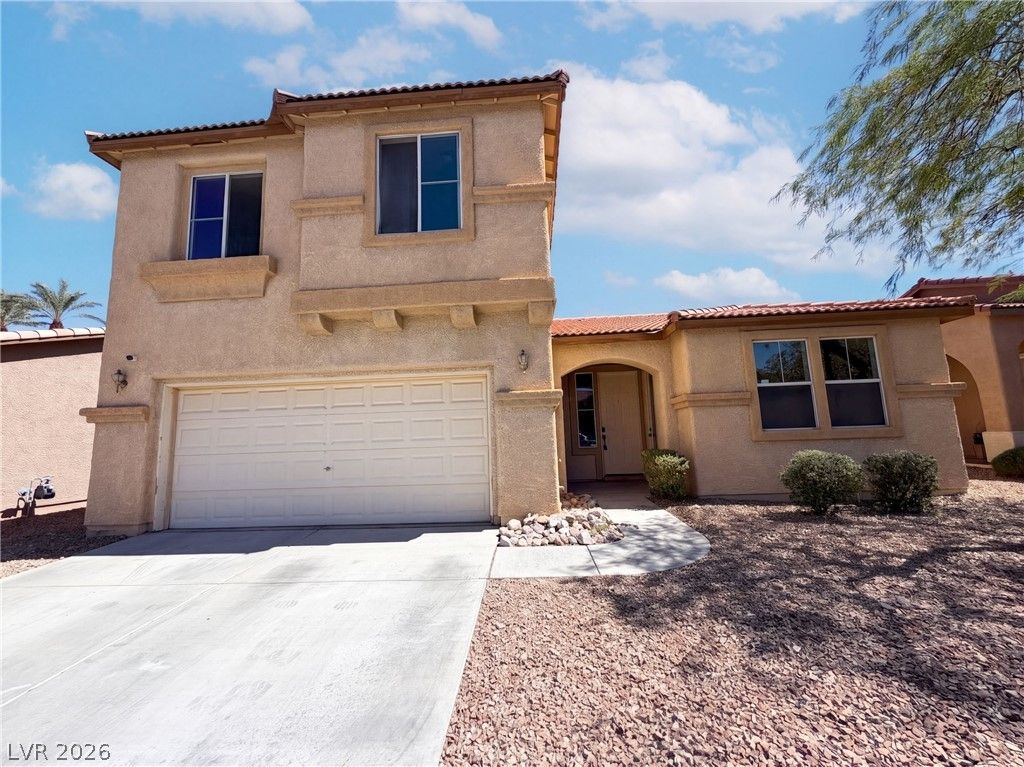
$469,0003 bd3 ba1,950 sqft$241/sqft0.32 mi20 days
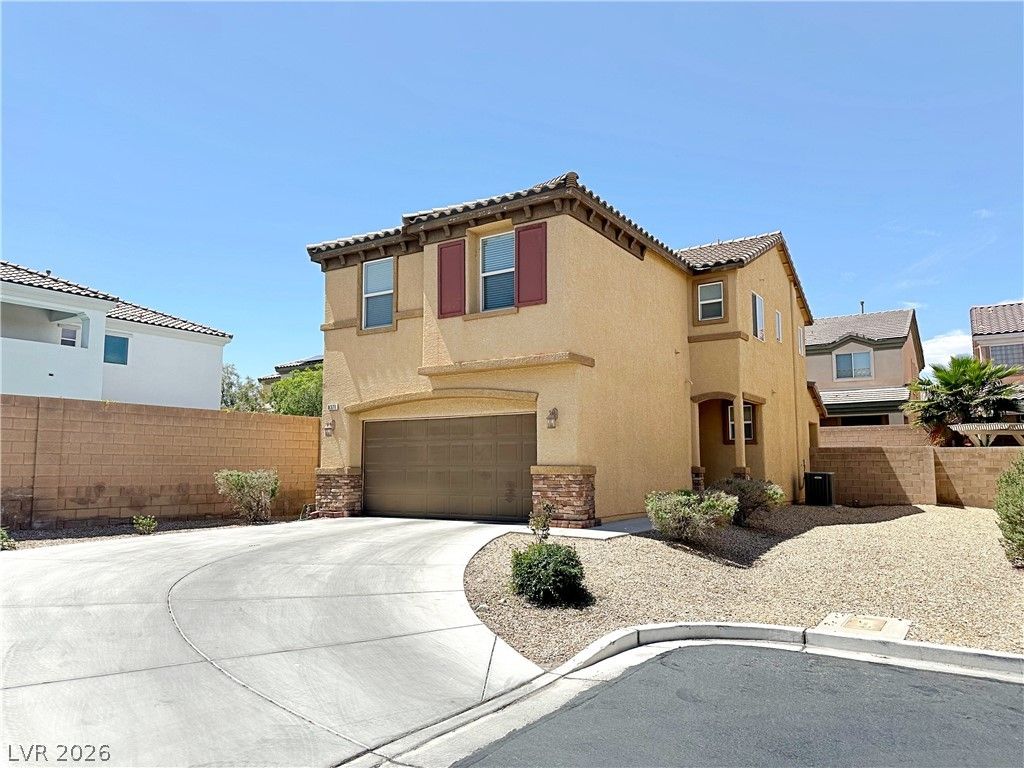
$415,0003 bd3 ba1,697 sqft$245/sqft0.36 mi124 daysSold 2026-07-28
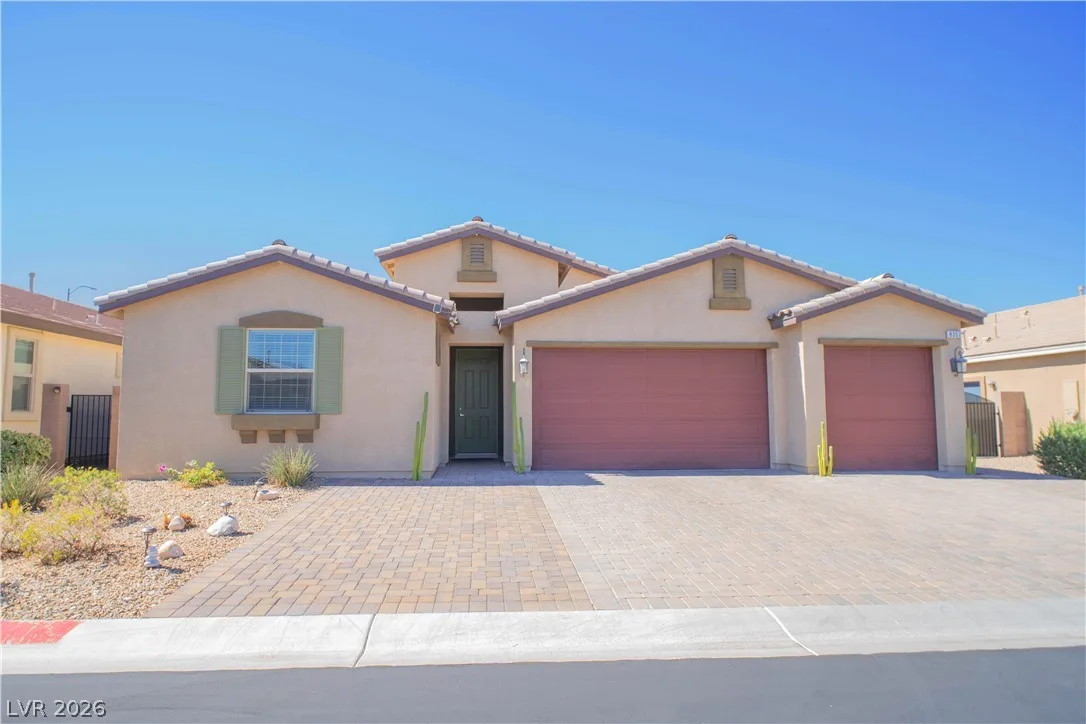
$688,0004 bd3 ba2,412 sqft$285/sqft0.43 mi17 days
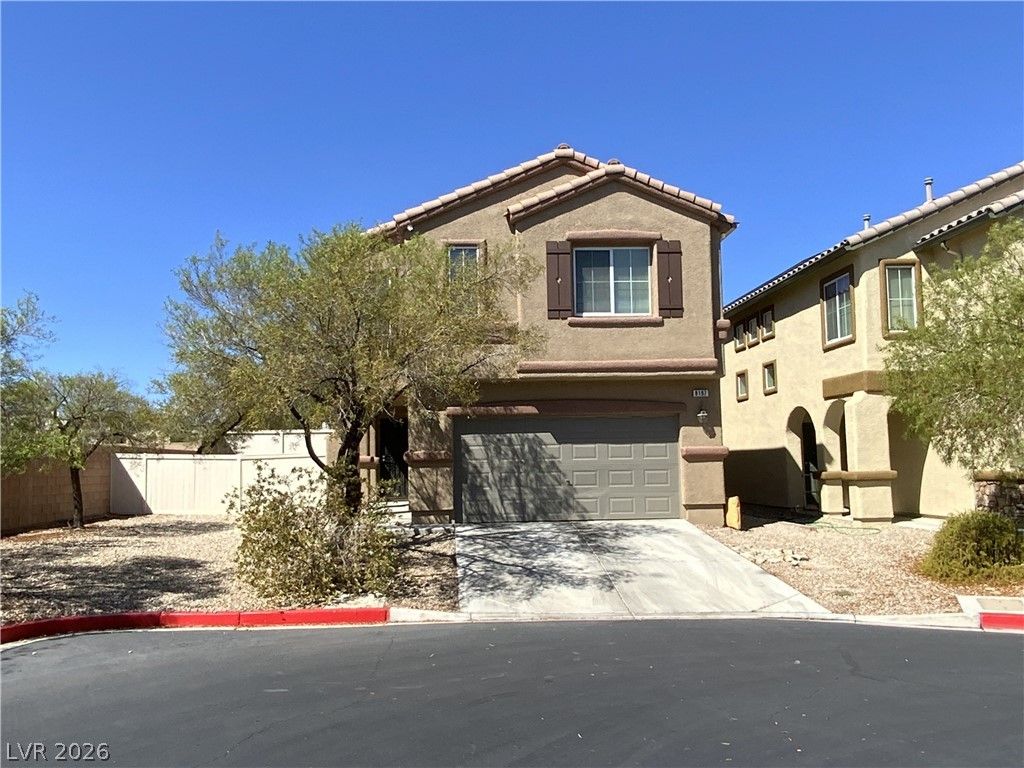
8197 Sandy Slope CourtActive
$425,0003 bd3 ba1,526 sqft$279/sqft0.45 mi21 days
$530,0003 bd3 ba1,844 sqft$287/sqft0.46 mi11 daysSold 2026-05-06
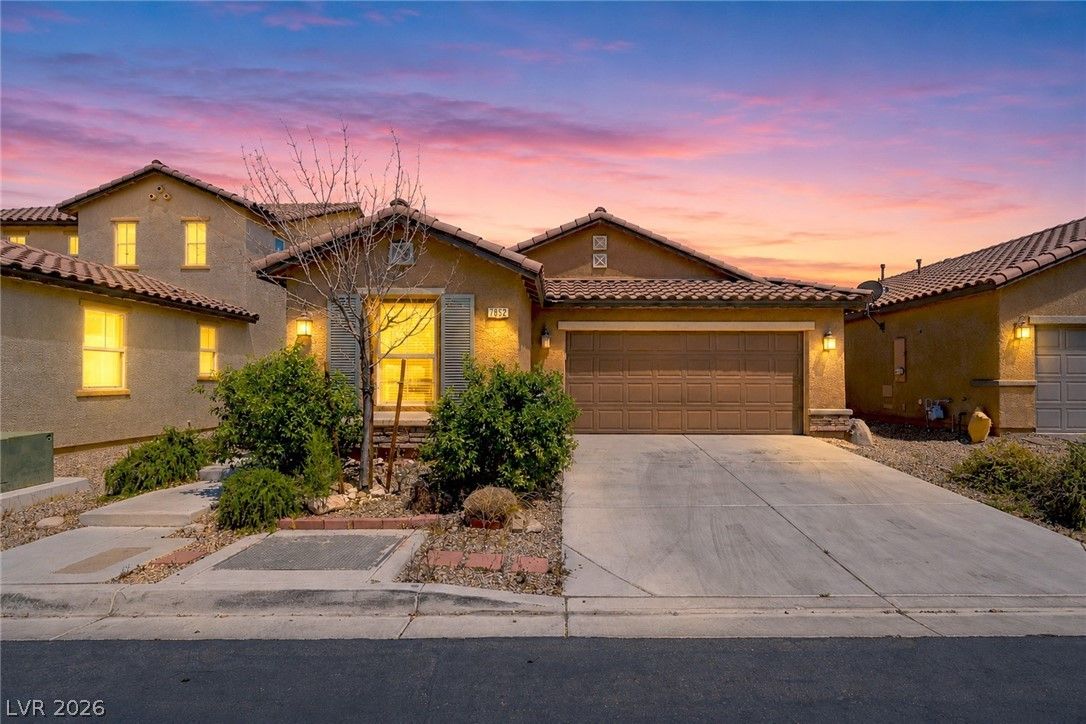
7852 Hamilton Pool DriveActive
$525,0003 bd2 ba1,844 sqft$285/sqft0.47 mi97 days
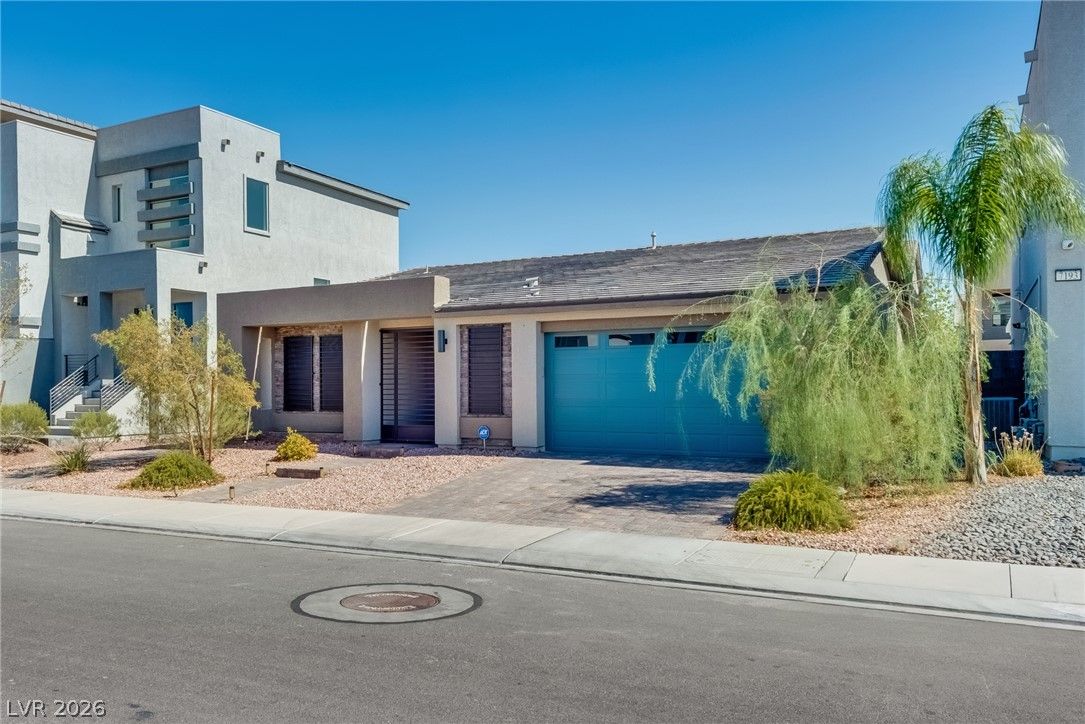
7177 West Camero AvenueActive
$698,8803 bd2 ba2,212 sqft$316/sqft0.57 mi60 days
Nearest comparable sales and listings
12 comparables · median price $512,450 · range $415,000 – $699,000 · median $/sq ft $285 · average $/sq ft $282
| Address | Status | Price | $/Sq Ft | Bd / Ba | Sq Ft | Sold / market time | Distance |
|---|---|---|---|---|---|---|---|
| 7621 Port Orchard Avenue | Sold | $499,900 | $294 | 3 / 2 | 1,701 | Sold 2026-06-25 | 0.09 mi |
| 7471 Burnt Oak Avenue | Active | $495,000 | $322 | 3 / 2 | 1,536 | 0 days on market | 0.21 mi |
| 8306 Stillhouse Court | Sold | $477,000 | $271 | 3 / 3 | 1,763 | Sold 2026-05-27 | 0.28 mi |
| 7878 Mohican Canyon Street | Active | $469,000 | $241 | 3 / 3 | 1,950 | 20 days on market | 0.32 mi |
| 8371 Stillhouse Court | Sold | $415,000 | $245 | 3 / 3 | 1,697 | Sold 2026-07-28 | 0.36 mi |
| 8357 Sonora Del Sol Street | Active | $688,000 | $285 | 4 / 3 | 2,412 | 17 days on market | 0.43 mi |
| 8197 Sandy Slope Court | Active | $425,000 | $279 | 3 / 3 | 1,526 | 21 days on market | 0.45 mi |
| 7863 Hamilton Pool Drive | Sold | $530,000 | $287 | 3 / 3 | 1,844 | Sold 2026-05-06 | 0.46 mi |
| 7852 Hamilton Pool Drive | Active | $525,000 | $285 | 3 / 2 | 1,844 | 97 days on market | 0.47 mi |
| 7177 West Camero Avenue | Active | $698,880 | $316 | 3 / 2 | 2,212 | 60 days on market | 0.57 mi |
| 7142 Bold Rock Avenue | Active | $699,000 | $316 | 3 / 2 | 2,212 | 18 days on market | 0.63 mi |
| 7608 Stray Horse Avenue | Active | $568,000 | $250 | 4 / 3 | 2,270 | 68 days on market | 0.68 mi |


