
Comparable Sales Near 10589 Natural Bridge Street, Las Vegas, NV 89179
1st Realty · Comparable sales report · 1st.estate · October 20, 2026
Read the Mountain's Edge neighborhood guide →
10589 Natural Bridge Street, Las Vegas, NV 89179
Status: Sold
$485,000 Sold Price
$223
$ / Sq Ft
2,171
Living Area
4,792 sqft
Lot Size
4
Beds
3
Baths
2012
Year Built
Search Parameters
Property Type
Status
Radius
Sold Within
Beds
Baths
Living Area (Sq Ft)
Lot Size (Sq Ft)
This comp search reflects your current search parameters — adjust the filters above as needed for a more accurate estimate.
Estimated Value
—
Average $/Sqft
—
Check one or more comps below to calculate an estimate.
Nearest 10 of 69 comparable sales and listings within 1 mile of this home. Use the filters above and press Search to refine.
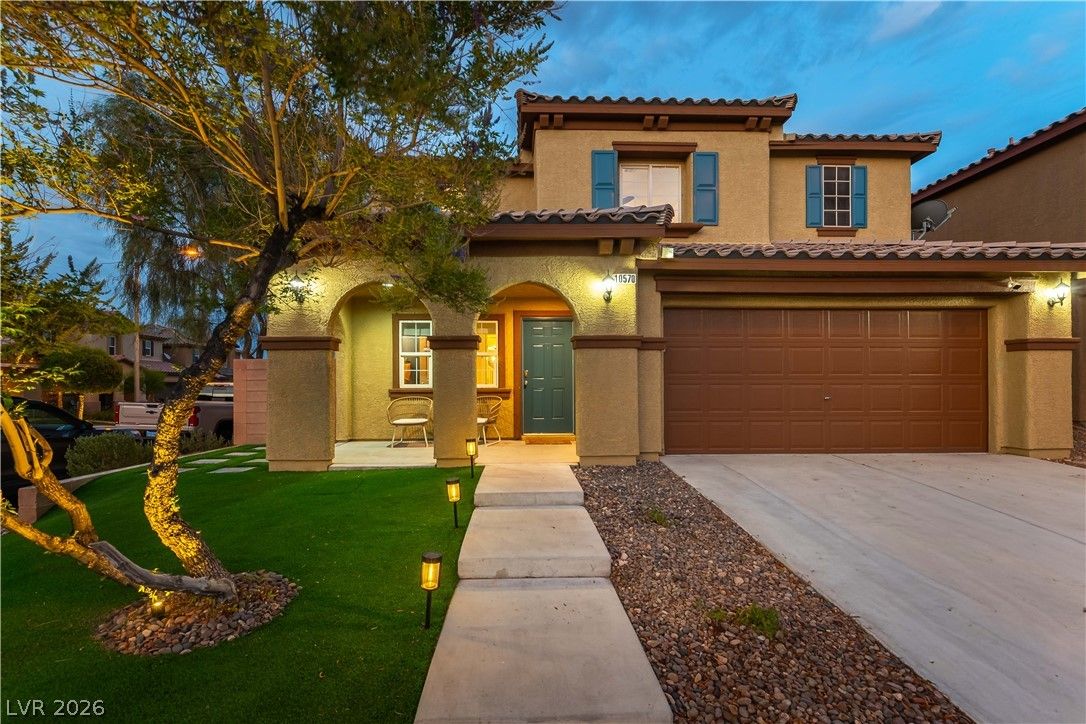
$590,0004 bd4 ba2,563 sqft$230/sqft0.03 mi52 daysSold 2026-10-09
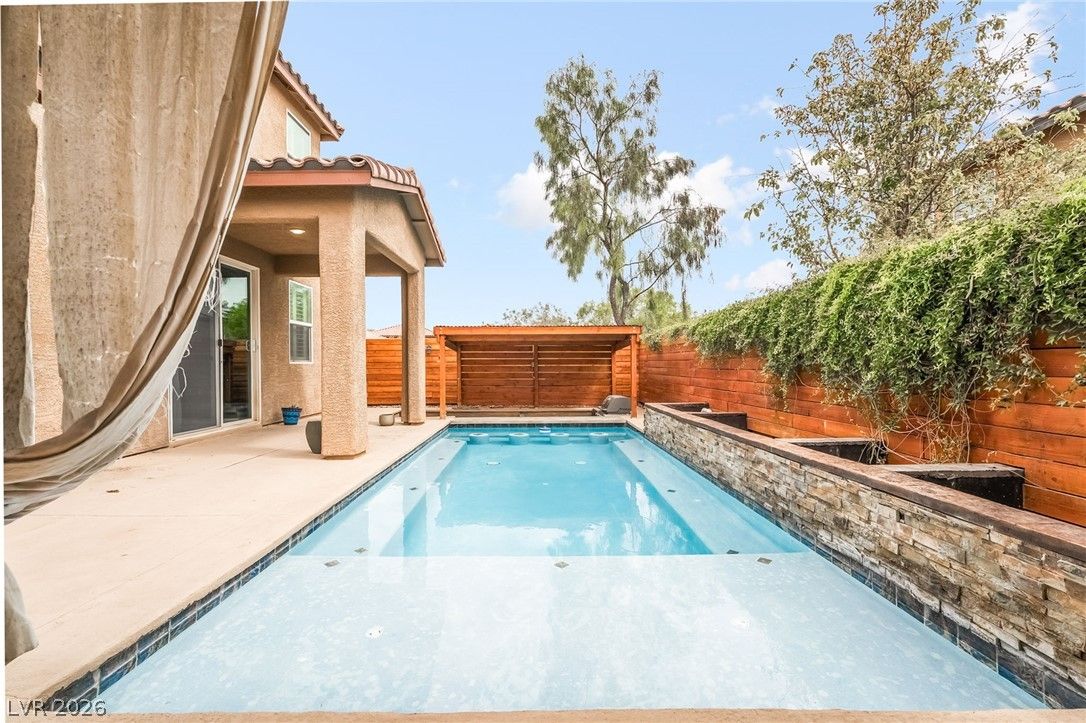
$589,0004 bd4 ba2,563 sqft$230/sqft0.07 mi64 days
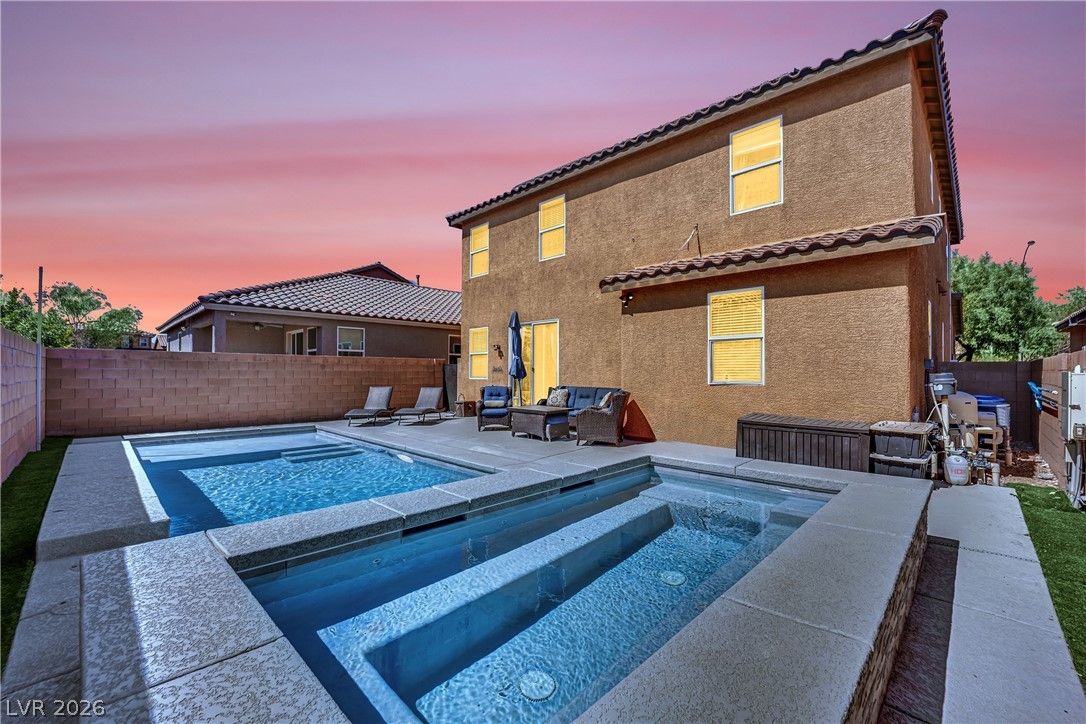
$568,9994 bd4 ba2,563 sqft$222/sqft0.11 mi125 days
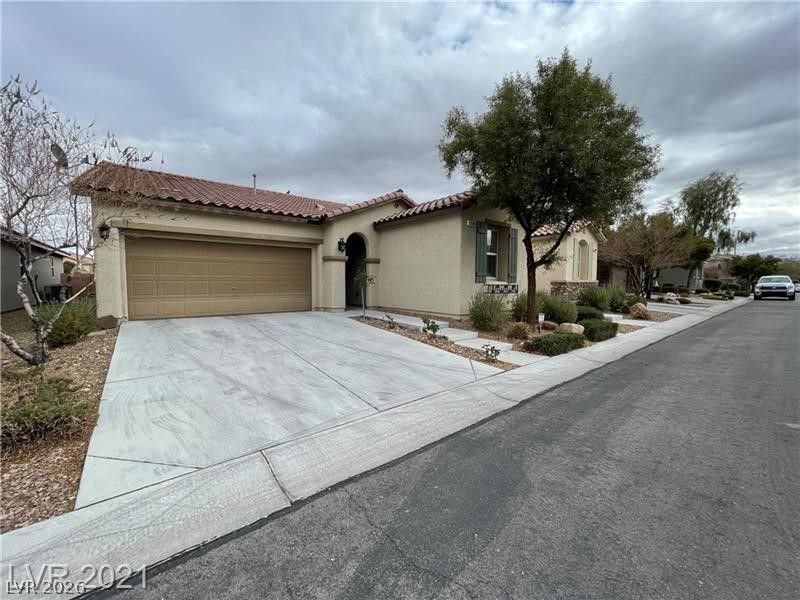
$459,0003 bd2 ba1,676 sqft$274/sqft0.11 mi119 days
$492,5003 bd2 ba1,836 sqft$268/sqft0.11 mi13 daysSold 2026-07-01
$555,0003 bd2 ba1,986 sqft$279/sqft0.26 mi11 daysSold 2026-05-15
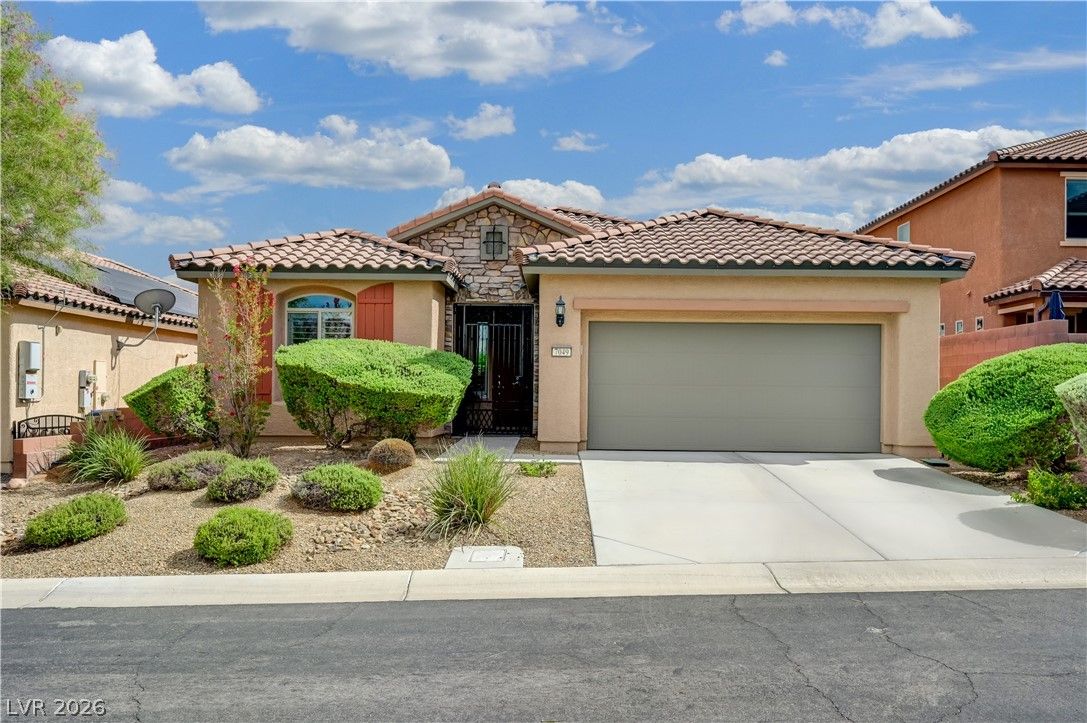
7049 Motley RoadSold
$515,0003 bd2 ba1,970 sqft$261/sqft0.26 mi19 daysSold 2026-09-30
$535,0004 bd3 ba2,314 sqft$231/sqft0.33 mi11 daysSold 2026-05-13
$471,0003 bd4 ba2,077 sqft$227/sqft0.33 mi16 daysSold 2026-06-16
$465,0003 bd3 ba1,991 sqft$234/sqft0.41 mi131 daysSold 2026-05-04
Nearest comparable sales and listings
12 comparables · median price $512,500 · range $459,000 – $590,000 · median $/sq ft $232 · average $/sq ft $245
| Address | Status | Price | $/Sq Ft | Bd / Ba | Sq Ft | Sold / market time | Distance |
|---|---|---|---|---|---|---|---|
| 10570 Cranbrook Cross Street | Sold | $590,000 | $230 | 4 / 4 | 2,563 | Sold 2026-10-09 | 0.03 mi |
| 10568 Painted Bridge Street | Active | $589,000 | $230 | 4 / 4 | 2,563 | 64 days on market | 0.07 mi |
| 10608 Upper Laurel Street | Active | $568,999 | $222 | 4 / 4 | 2,563 | 125 days on market | 0.11 mi |
| 10596 Upper Laurel Street | Active | $459,000 | $274 | 3 / 2 | 1,676 | 119 days on market | 0.11 mi |
| 7030 Glencoe Harbor Avenue | Sold | $492,500 | $268 | 3 / 2 | 1,836 | Sold 2026-07-01 | 0.11 mi |
| 7190 Sunny Countryside Avenue | Sold | $555,000 | $279 | 3 / 2 | 1,986 | Sold 2026-05-15 | 0.26 mi |
| 7049 Motley Road | Sold | $515,000 | $261 | 3 / 2 | 1,970 | Sold 2026-09-30 | 0.26 mi |
| 10527 Peach Creek Street | Sold | $535,000 | $231 | 4 / 3 | 2,314 | Sold 2026-05-13 | 0.33 mi |
| 7283 Sterling Rock Avenue | Sold | $471,000 | $227 | 3 / 4 | 2,077 | Sold 2026-06-16 | 0.33 mi |
| 10281 Numaga Road | Sold | $465,000 | $234 | 3 / 3 | 1,991 | Sold 2026-05-04 | 0.41 mi |
| 10266 Copalito Drive | Active | $479,000 | $205 | 4 / 4 | 2,337 | 82 days on market | 0.43 mi |
| 7420 Painted Mural Avenue | Active | $510,000 | $275 | 3 / 2 | 1,854 | 27 days on market | 0.44 mi |


